Significance
Gas-filled microbubbles physically oscillate in an ultrasound field and have been shown to potentiate the delivery of therapeutic payloads. The biophysical mechanisms by which vibrating microbubbles stimulate macromolecule uptake across the cell membrane, however, remain unknown. With a coupled microscopy system capable of bright-field imaging up to 25 million frames per second, we show correlations between microsecond-scale bubble oscillations and second-to-minute–scale macromolecule diffusion, uniquely highlighting that microbubble-induced shear stress is a threshold indicator for membrane pore generation. Further insight into membrane reorganization using real-time confocal microscopy demonstrates that ultrasound-triggered microbubbles create resealing pores through both layers of cellular membrane, and gaps between confluent cells. This work presents mechanistic, biophysical insight into sonoporation as a tool for local delivery of therapeutic macromolecules.
Keywords: ultrasound therapy, microbubble contrast agent, endothelial membrane, gene delivery, sonoporation
Abstract
This study presents a unique approach to understanding the biophysical mechanisms of ultrasound-triggered cell membrane disruption (i.e., sonoporation). We report direct correlations between ultrasound-stimulated encapsulated microbubble oscillation physics and the resulting cellular membrane permeability by simultaneous microscopy of these two processes over their intrinsic physical timescales (microseconds for microbubble dynamics and seconds to minutes for local macromolecule uptake and cell membrane reorganization). We show that there exists a microbubble oscillation-induced shear-stress threshold, on the order of kilopascals, beyond which endothelial cellular membrane permeability increases. The shear-stress threshold exhibits an inverse square-root relation to the number of oscillation cycles and an approximately linear dependence on ultrasound frequency from 0.5 to 2 MHz. Further, via real-time 3D confocal microscopy measurements, our data provide evidence that a sonoporation event directly results in the immediate generation of membrane pores through both apical and basal cell membrane layers that reseal along their lateral area (resealing time of ∼<2 min). Finally, we demonstrate the potential for sonoporation to indirectly initiate prolonged, intercellular gaps between adjacent, confluent cells (∼>30–60 min). This real-time microscopic approach has provided insight into both the physical, cavitation-based mechanisms of sonoporation and the biophysical, cell-membrane–based mechanisms by which microbubble acoustic behaviors cause acute and sustained enhancement of cellular and vascular permeability.
Delivery vehicles for therapeutic nucleic acids (e.g., siRNA, mRNA, plasmids, oligonucleotides), including nanoparticles or viruses, are intended to increase the local effectiveness of the therapeutic within a target tissue while reducing off-target effects. A major barrier to the successful delivery of molecular therapeutics in this manner is the endothelial cell membrane. Viral vectors, although able to efficiently deliver genetic material to target cells via their intracellular trafficking machinery, may elicit specific inflammatory and nonspecific antiviral immune responses (1, 2). As an alternative, nonviral vectors––for example, localized needle injection of naked therapeutic nucleic acids or lipofection––use physical forces or compounds, respectively, to deliver a genetic payload into a cell and are generally less toxic and immunogenic than viral vectors (3). However, direct needle injection into the target poses challenges in achieving homogeneous tissue distribution of the payload (4), and clinical implementation is limited by the impractical requirements of repetitive needle injections into sites which may be difficult to access. Systemically injected liposomes face the endothelial barrier, are vulnerable to intravascular destruction and/or renal excretion (depending on size), and, when endocytosed by the target cell, must escape early endosomes to deliver the payload to the cell (5). To address these limitations, i.v.-injected nucleic-acid–loaded microbubble contrast agents have been investigated as nonviral delivery vehicles which can be targeted to release their payloads by direct navigation of an ultrasound beam to the target tissue during microvascular transit of the microbubbles through the tissue. The resulting selective release and uptake of the payload within the ultrasound focal volume is a major advantage over other nonviral, noninvasive delivery methods. As an ultrasound contrast agent, microbubbles can also be visualized via standard B-mode (or contrast-mode) ultrasound imaging techniques, and therefore a cargo-loaded microbubble platform has the potential to offer a noninvasive, image-guided, and targeted molecular therapeutic delivery strategy.
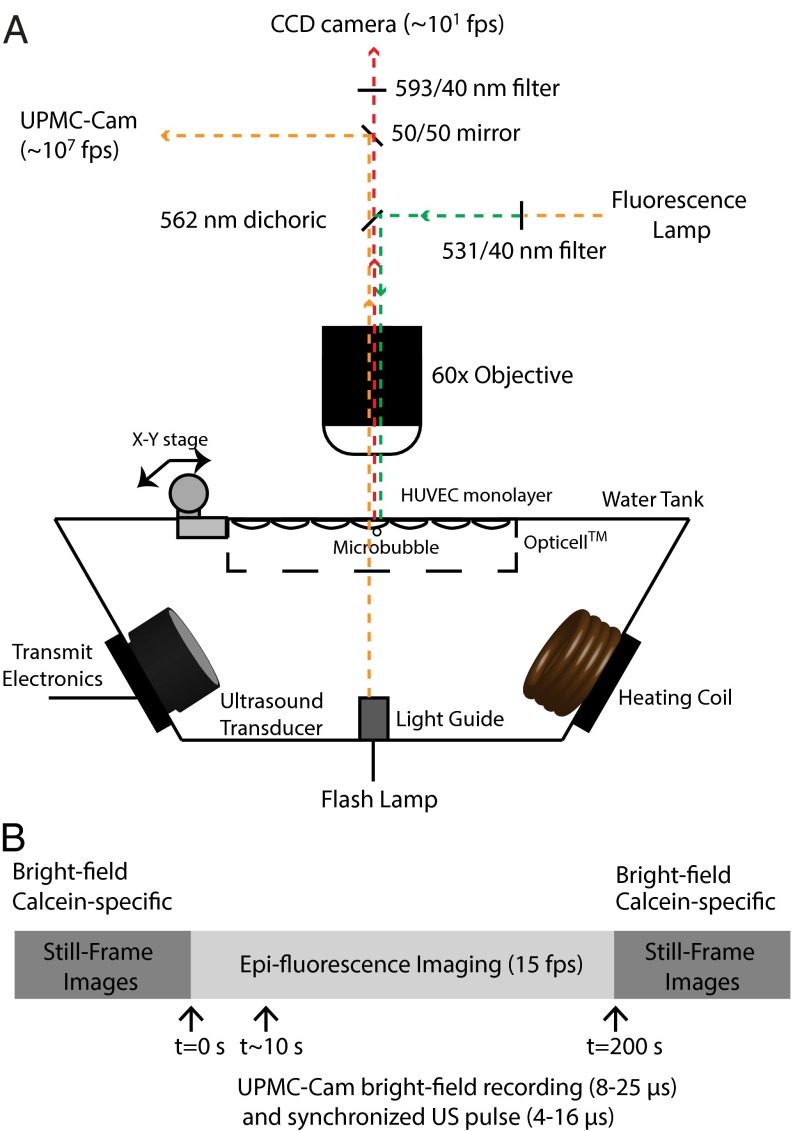
Studies using microbubbles driven by ultrasound in the megahertz frequency range have shown initial success in delivering therapeutic payloads in in vitro (6–10) and animal models (11–13). The delivery efficiency, however, remains inferior to that demonstrated via viral methods (4), in large part due to an incomplete physical, mechanistic understanding of the manner in which acoustic cavitation alters endothelial membrane permeability. To address this, a direct correlation between microbubble cavitation physics and subsequent cell membrane permeability is required. To achieve this, we have coupled a custom-designed, ultrafast microscopy system (submicrosecond resolution) with a second CCD camera (millisecond resolution) to simultaneously investigate ultrasound-mediated microbubble megahertz oscillation dynamics and the resulting cellular permeability dynamics over their relevant physical timescales (Fig. 1A). Phospholipid encapsulated microbubbles were allowed to rest adjacent to a cultured, calcein-loaded human umbilical vein endothelial cell (HUVEC) monolayer within a cell culture cassette. The cassette was filled with culture medium containing propidium iodide (PI), a 668-Da reagent that we chose as a model drug and primary marker of sonoporation (SI Methods) due to its fluorescence exclusively upon entering the cell and interacting with nucleotides. Synchronous triggering between the ultrasound transducer and ultrafast microscopy system was achieved to collect an ultrafast frame rate bright-field recording of microbubble behavior (∼8–25 µs), a fluorescence video recording of the corresponding PI uptake before, during, and after ultrasound transmission (∼2–3 min), and a set of bright-field and calcein pre- and postultrasound still frames (Fig. 1B).
Fig. 1.
Simultaneous ultrafast bright-field (Mfps) and slow-speed epifluorescence (fps) microscopy bridges observations over 6 orders of magnitude in time. (A) A schematic cross-section of a custom-designed water tank, housing a single-element transducer and a coil heater, mounted on a microscope stage. The light collected from the objective lens was split with a 50/50 mirror to two detectors––the UPMC-Cam (26) and a CCD camera used for epifluorescence microscopy. To ensure simultaneous fluorescence recording before, during, and after ultrasound exposure, the appropriate filter cube was decomposed to leave the dichroic mirror in the beam path. The emission filter was placed downstream of the beam-splitting mirror to ensure that a sufficient amount of photons from the flash lamp reached the UPMC-Cam detectors. (B) Synchronous triggering between the ultrasound transducer and ultrafast microscopy system was achieved to collect an ultrafast frame rate bright-field recording of microbubble behavior (∼8–25 µs), a fluorescence video recording of the corresponding PI uptake before, during, and after ultrasound transmission (∼2–3 min), and a set of bright-field and calcein pre- and postultrasound still frames. The UPMC-Cam (26), currently the only imaging system of its kind in North America, is based on a rotating mirror framing camera. A mirror prism, rotated by a gas (helium) turbine, achieves up to 20,000 rotations per second to direct the incoming photons through a bank of relay lenses and beam splitters, projecting two images on a single CCD camera. This optical system therefore results in 128 temporally separated images (1,360 × 1,024 pixels) spatially projected onto 64 CCD cameras at a maximum of 25 Mfps.
Results and Discussion
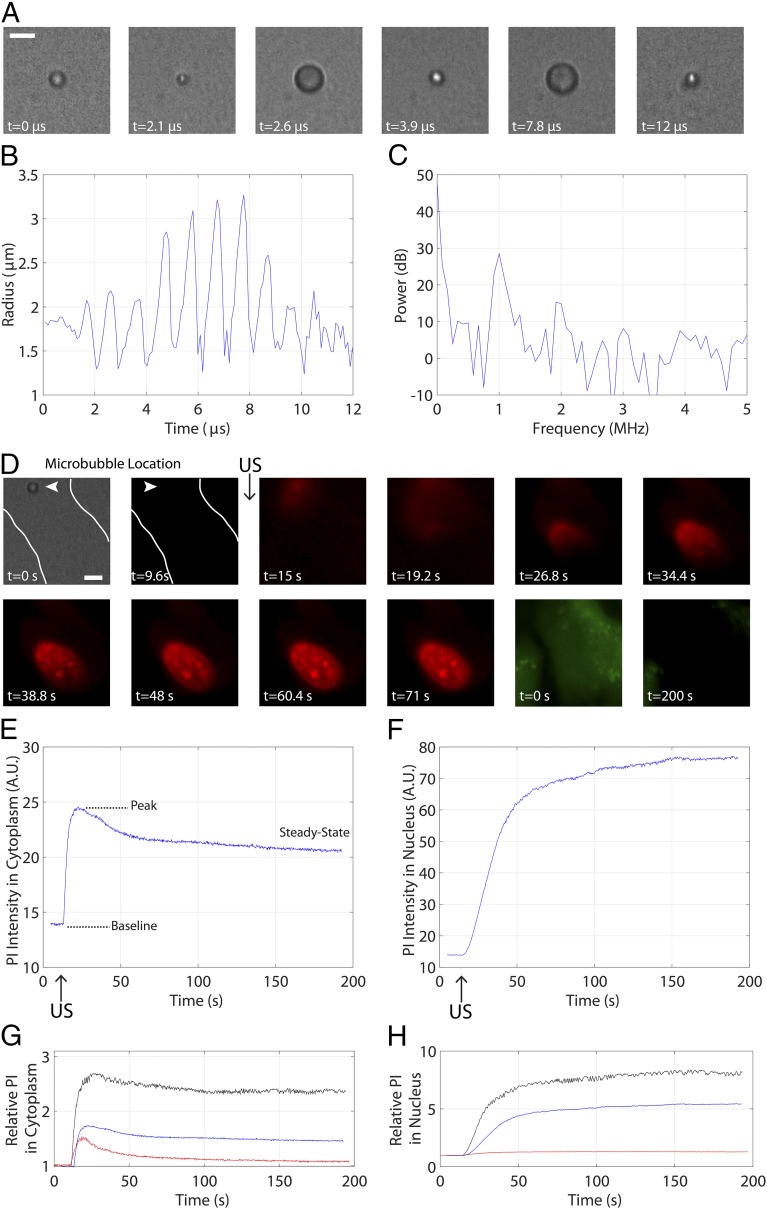
Fig. 2 depicts a representative example of the simultaneous ultrafast bright-field/slow epifluorescence recording strategy: a microbubble with a resting radius of =1.8 µm in contact with an endothelial cell, insonicated with an 8-cycle, 1-MHz pulse at 0.8 MPa. Selected frames from the ultrahigh-speed recording [∼10.8 Mfps (million frames per second)] illustrate microbubble cavitation (Fig. 2A), from which the quantification of the microbubble radial oscillation and its frequency content are extracted (Fig. 2 B and C). The microbubble achieves a maximum radius of =3.3 µm and exhibits preferential expansion over compression––an expected nonlinear result for a microbubble interrogated at a pressure amplitude of 0.8 MPa (Movie S1). Indeed, the associated power spectrum (Fig. 2C) highlights large contributions of energy at the fundamental, second-harmonic and third-harmonic frequencies to the microbubble cavitation. This cavitation event results in immediate sonoporation (Movie S2) initiating at the point of bubble–cell contact (Fig. 2D, arrowhead), characterized by PI entry into the cytoplasm [commencing between panels 2 and 3 (9.6–15 s)] and eventual diffusion to the nucleus (panel 5), as well as intracellular calcein loss (panels 11 and 12). Further quantification of the PI uptake dynamics reveals both qualitative and quantitative differences within the cytoplasm (Fig. 2E) and nucleus (Fig. 2F). The cytoplasmic PI profile is consistent with a time-limited PI entry within the cell (e.g., pore resealing or PI saturation), whereas the monotonically increasing, plateau-like nature of the nuclear PI uptake reflects the spatial confinement of DNA within the nucleus. The final two panels depict the range of PI uptake curves within the cytoplasm (Fig. 2G) and nucleus (Fig. 2H) for all microbubbles interrogated at 1 MHz (Fig. S1 and Table S1).
Fig. 2.
Individual ultrasound-stimulated microbubble oscillation increases endothelial membrane permeability. (A) Select frames from an ultrahigh-speed recording from the UPMC-Cam at 10.86 Mfps, highlighting microbubble spherical oscillation at 1 MHz and 0.8 MPa. (Scale bar, 5 µm.) (B) Quantification of the radial profile of the microbubble shown in A over time and (C) corresponding radial power spectrum as extracted from the UPMC-Cam bright-field recording. This microbubble exhibits some gas loss due to ultrasound (US) exposure, resulting in a slightly smaller size (1.4-µm radius) by the end of the US pulse and up to 3 min thereafter. (D) Simultaneous epifluorescence imaging before, during, and after US delivery highlights the uptake of a normally cell-impermeable model drug PI (red). The first two frames depict the microbubble–cell geometry (white lines denote cell contours and arrowheads denote microbubble location) in bright-field and epifluorescence frames, respectively. Frames 3–10 demonstrate PI uptake after US delivery. The commencement of PI uptake is spatially localized to the position of bubble–cell contact (arrowhead), entering the cytoplasm and continuing to diffuse within the nucleus. Frames 11 and 12, taken during calcein-specific imaging (green) before US (frame 11) and about 200 s later (frame 12), illustrate that calcein is lost during this sonoporation process. (Scale bar, 5 µm.) Note the characteristic differences in PI uptake dynamics within (E) the cytoplasm and (F) the nucleus, likely related to the diffusion physics of these two cellular compartments. The cytoplasmic PI profile is consistent with the arrest of PI entry within the cell (e.g., pore resealing, PI saturation), whereas the monotonically increasing, plateau-like nature of the nuclear PI reflects the immobile nature of the DNA within the nuclear cavity. (G and H) The range of PI uptake curves exhibited by all microbubbles interrogated at 1 MHz. These curves are normalized to their respective baseline-subtracted values. See Movies S1 and S2.
Fig. S1.
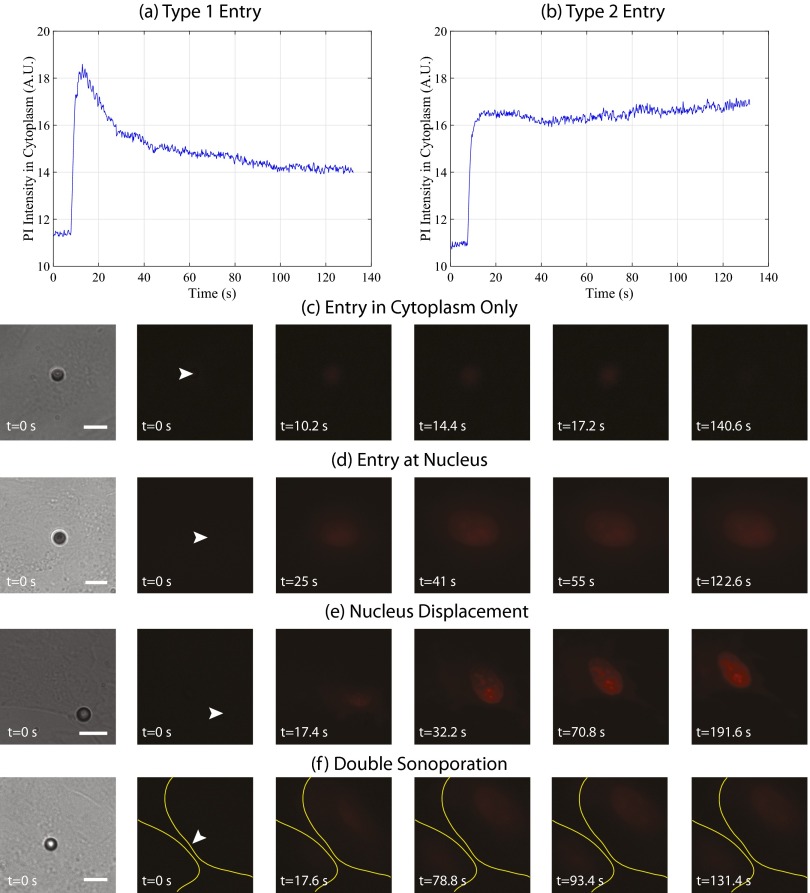
Heterogeneous uptake dynamics and qualitative sonoporation response. The dynamics of PI entry exhibit two distinct behaviors, reaching a maximum value and (A) returning to a steady-state value or (B) remaining at maximum signal intensity. In the following panels, the first frame depicts the pre-US delivery bright-field image, illustrating the microbubble–cell positioning. In the second frame, the white arrowhead denotes the microbubble location before US delivery. Indeed, epifluorescence microscopy highlights a spectrum of qualitative sonoporation events, including (C) the immediate entry of PI restricted to the cytoplasm, resulting in no nuclear staining, and (D) direct entry within the nucleus, dictated in part by the specific microbubble location relative to the nucleus. Furthermore, (E) significant nucleus displacement as a function of recording time post-US exposure was observed, as well as (F) an individual microbubble causing sonoporation of two adjacent cells (yellow lines denote cell boundaries). (Scale bar, 10 µm.) See Table S1.
Table S1.
Summary of all microbubble–cell behaviors, categorized by transmit pulse
| Waveform | Type 1 | Type 2 | Entry at nuc. | Nuc. disp. | Double sono. | PI + | PI − | Total | Entry cyto. only |
| 0.5 MHz, 8-cycle | 9 | 5 | 6 | 1 | 2 | 23 | 35 | 58 | 5 |
| 0.5 MHz, 4-cycle | 20 | 4 | 2 | 4 | 1 | 31 | 37 | 68 | 1 |
| 1 MHz, 8-cycle | 17 | 4 | 5 | 4 | 0 | 30 | 27 | 57 | 5 |
| 2 MHz, 8-cycle | 21 | 6 | 6 | 1 | 2 | 36 | 29 | 65 | 6 |
| 2 MHz, 16-cycle | 24 | 0 | 4 | 3 | 1 | 32 | 27 | 59 | 8 |
| Total | 91 | 19 | 23 | 13 | 6 | 152 | 155 | 307 | 25 |
| Total % of PI + | 59.4 | 12.4 | 15.0 | 8.5 | 3.9 | 100 | N/A | N/A | 16.3 |
| Total % | 29.6 | 6.2 | 7.5 | 4.2 | 1.9 | 49.5 | 50.5 | 100 | 8.14 |
Peak negative acoustic pressures ranged from 0.1 to 0.4 MPa, 0.2 to 0.8 MPa, and 0.2 to 0.6 MPa for 0.5 MHz, 1 MHz, and 2 MHz, respectively. Type 1 and type 2 cytoplasmic PI entry, as well as entry at nucleus (Entry at nuc.), nucleus displacement (Nuc. disp.), double sonoporation (Double sono.), and entry in cytoplasm only (Entry cyto. only) are all defined as illustrated in Fig. S1.
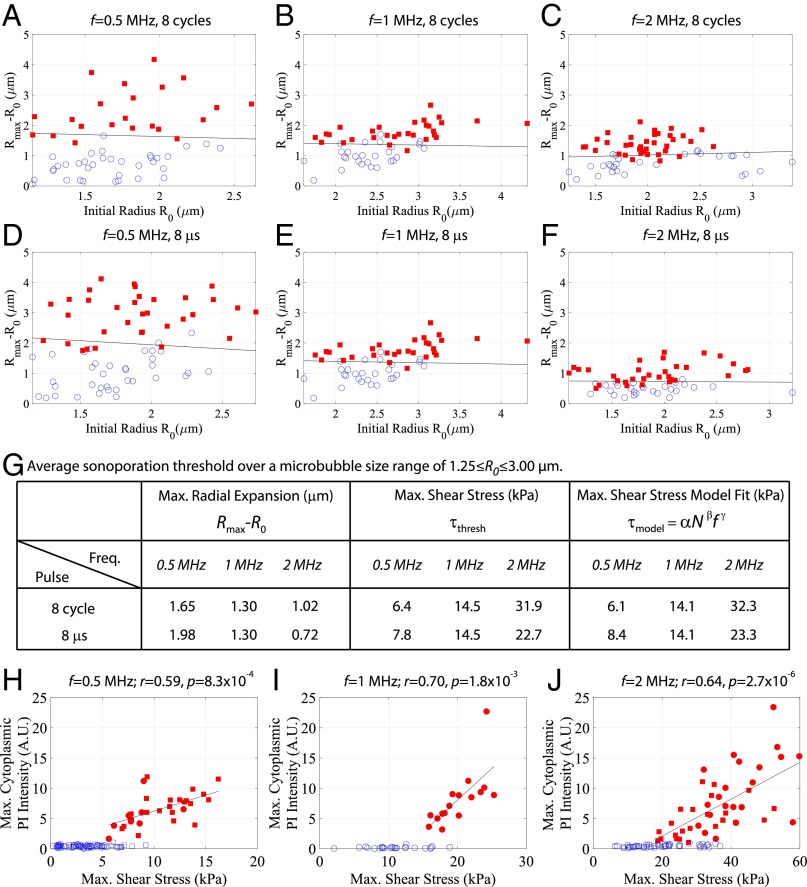
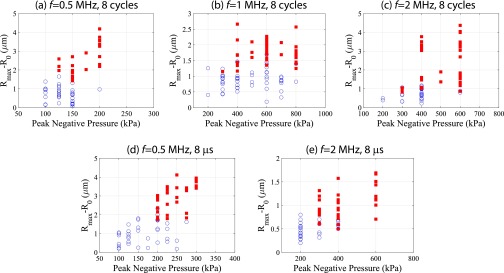
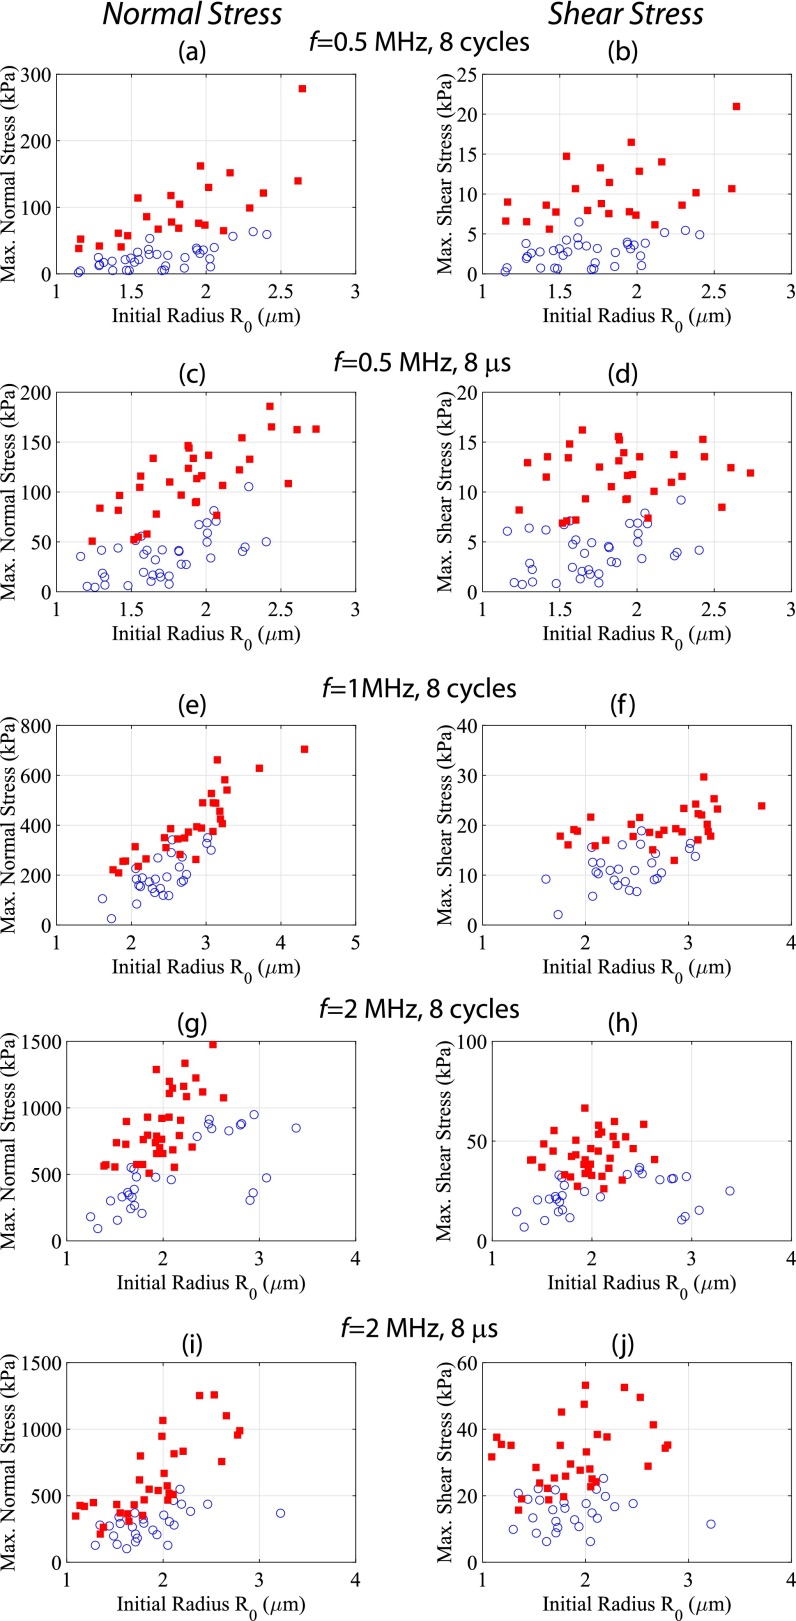
A global summary of the dataset taken from n = 361 individual microbubble–cell pairs is shown in Fig. 3, where the bubble–cell pairs that elicit sonoporation are denoted with a red square. The maximum absolute microbubble expansion as a function of initial radius is presented. This figure presents the results from two sets of experiments, each performed at an ultrasound frequency of 0.5, 1.0, or 2 MHz, with either the number of cycles (8 cycles; Fig. 3 A–C) or the time duration (8 µs; Fig. 3 D–F) of the single pulse held constant (i.e., five independent conditions; Fig. S2). There was a threshold in absolute microbubble radial excursion above which sonoporation occurs that is approximately independent of initial radius, as determined through linear discriminant analysis (solid line). These data were acquired over a range of acoustic pressures (Fig. 3) to build up the physically relevant parameter space. The required maximum expansion threshold increases for decreasing frequencies for both sets of experiments (Fig. 3G). At a fixed frequency, the bubble oscillation threshold required to initiate sonoporation increases as the pulse time duration decreases. Placing the recorded microbubble dynamics within a physical framework, the maximum normal and shear stresses were estimated. Whereas there was no clear normal stress threshold, microbubble-induced shear stress was found to be a threshold indicator of sonoporation occurrence (Figs. S3 and S4). Sonoporation thresholds for bubbles between 1.25 ≤ R0 ≤ 3.00 µm, both in terms of oscillation amplitude and associated shear stress, are presented in Fig. 3G. Insight into the dependence of oscillation frequency and duration on membrane rupture thresholds can be gained by taking a materials engineering approach: The shear-stress threshold for cell membrane sonoporation can be viewed as an analog to the stress threshold for material failure. This analysis is conducted by constructing a Wohler curve (S–N curve), indicating the required number of cycles (N) at a constant stress (S) for material failure, and is modeled by , where and are material constants with < 0 (14). By assuming that the viscoelastic rheology of cellular membranes exhibits a power law on displacement frequency (15), a model is proposed for the sonoporation shear-stress threshold:
| [1] |
where is expressed in kilopascals and is the transmit frequency in megahertz. Mathematical fitting of the above equation to the estimated maximum shear-stress threshold values results in = 37.4 ± 2.1, = −0.47 ± 0.03, and = 1.195 ± 0.005. Maximum shear-stress values, both experimentally estimated and those resulting from the best fit of Eq. 1, are reported in Fig. 3G, highlighting good agreement between the observed data and the model (R2 = 0.99). Once sonoporation is achieved, a direct, linear correlation between microbubble-induced shear stress and the peak cytoplasmic PI intensity at the site of sonoporation at all three frequencies is observed (Fig. 3 H–J). This suggests that larger microbubble-induced shear stresses correlate to either larger pores or more prolonged pore openings.
Fig. 3.
Microbubble-generated shear stress is a mechanistic threshold indicator for sonoporation, resulting in a commensurate increase in macromolecule influx within endothelial cells. (A–F) The effect of US frequency and pulse duration on sonoporation. Two frequency-dependent studies were performed; with either the number of cycles (8 cycles; A–C) or the pulse time duration (8 µs; D–F) held constant (i.e., five independent conditions). Red squares denote microbubble–cell pairs that exhibited PI uptake (sonoporation), whereas blue circles denote no PI entry. Rmax − R0 indicates the maximum absolute microbubble shell excursion during US exposure measured from the ultrafast recordings (y axis), and is plotted against initial microbubble radius R0. Peak negative acoustic pressures ranged from 0.1 to 0.4 MPa, 0.2 to 0.8 MPa, and 0.2 to 0.6 MPa for 0.5 MHz, 1 MHz and 2 MHz, respectively, to build up this physically relevant parameter space. The threshold in absolute microbubble excursion above which sonoporation occurs as a function of initial radius was determined through linear discriminant analysis (solid line), resulting in an approximately constant relation. (G) Sonoporation thresholds averaged over a microbubble size range of 1.25 ≤R0 ≤ 3.00 µm for the US frequencies and pulse durations tested. To model the maximum shear-stress threshold, a materials engineering approach was adopted of the form , where = 37.4 ± 2.1, = -0.47 ± 0.03, and = 1.195 ± 0.005 are the fitted parameters. (H–J) Correlation between maximum PI signal intensity (baseline subtracted) at the site of entry (within cytoplasm) and the maximum shear stress for the 8-cycle (circles) and 8-µs (squares) transmit pulses. Red symbols denote microbubble–cell pairs that exhibited PI uptake, whereas blue symbols denote no PI entry. These data indicate that larger shear forces result in either larger pores or longer pore durations. Pearson correlation coefficients and significance are shown.
Fig. S2.
Absolute maximum radial excursion is an indicator for sonoporation. In these panels, a closed square denotes sonoporation of the cell in contact with the microbubble (i.e., PI uptake) and an open circle denotes no sonoporation. The range of resulting excursions for a given pressure is due in part to microbubble size (resonance effects) and intrinsic variations in microbubble encapsulation uniformity.
Fig. S3.
Sonoporation results when oscillating microbubbles exert shear stresses on HUVECs above a critical threshold. The estimated maximum normal (Left) and shear (Right) stresses from Eqs. S1 and S2 for all interrogated microbubbles. In these panels, a closed square denotes sonoporation of the cell in contact with the microbubble (i.e., PI uptake) and an open circle denotes no sonoporation. The estimated maximum normal stresses exhibit a linear dependence, i.e., larger bubbles requiring a larger normal stress to elicit sonoporation. The maximum shear-stress estimates, however, exhibit an approximately constant threshold over which sonoporation occurs––suggesting a potential mechanism for increases in cell membrane permeability.
Fig. S4.
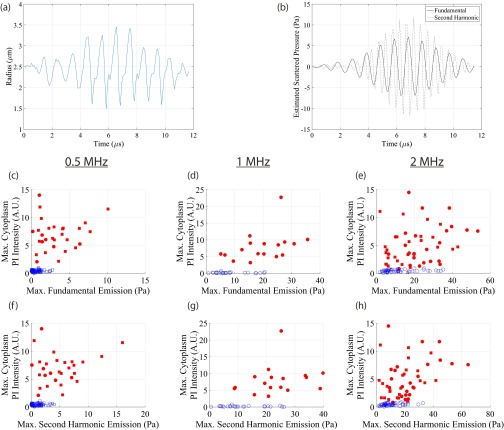
Estimated scattered emissions do not directly correlate with sonoporation propensity. (A) Individual measured microbubble radial response from a single 1-MHz, 8-cycle pulse at 0.7 MPa. (B) Estimated scattered emissions, according to Eq. S3, with filtered fundamental (1 MHz; solid line) and second-harmonic (2 MHz; dashed line) response. (C–H) Maximum PI signal intensity (baseline subtracted) at the site of entry (within cytoplasm) as a function of maximum emission for the 8-cycle (circles) and 8-µs (squares) transmit pulses. Red symbols denote microbubble–cell pairs that exhibited PI uptake, whereas blue symbols denote no PI entry. Unlike its shear-stress analog (Fig. 3 H–J), there is no direct, mechanistic correlation between sonoporation and scattered emissions. This highlights the physical, mechanical origin of sonoporation: namely the exertion of localized, high-magnitude (kilopascal), short-lived (approximately microsecond) shear stress.
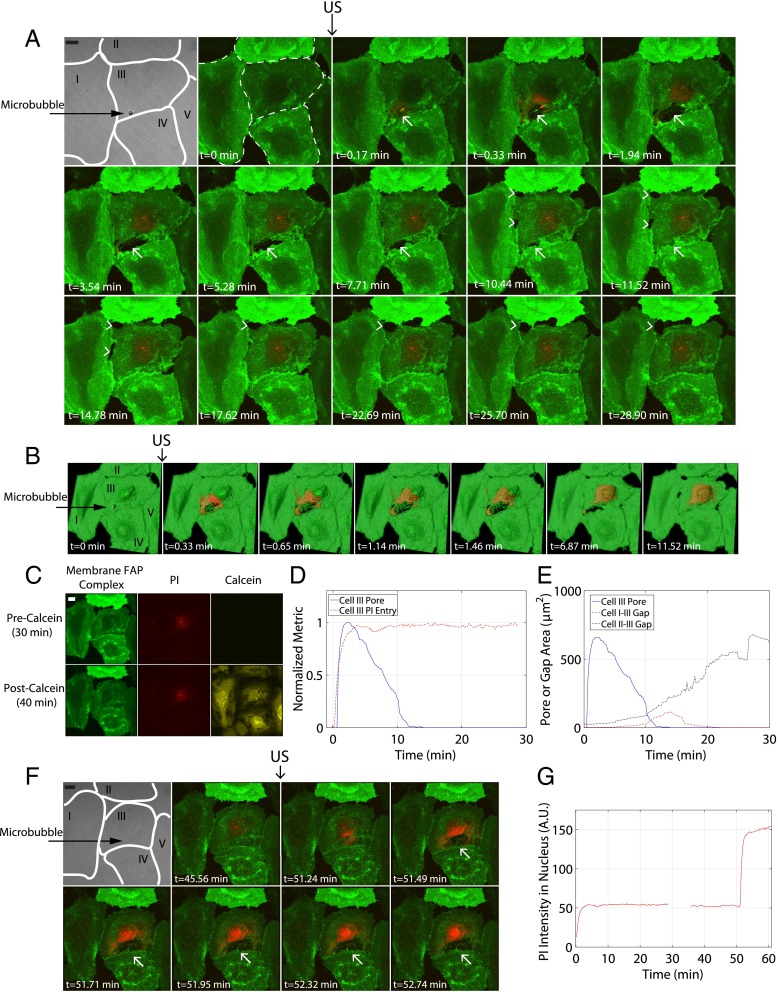
With this hypothesis in mind, the biophysical connection between microbubble-generated shear stress and resulting macromolecule uptake lies in the dynamics of the cellular membrane itself. As revealed with 3D real-time resonant scanning confocal microscopy (Movie S3), the cell membrane perforates at the point of bubble–cell contact over a relatively wide surface area immediately after ultrasound delivery, coregistering with an influx of PI (Fig. 4A). Both apical and basal cell membranes are breached and completely reseal in-plane (∼12 min). Surface rendering analysis (Movie S4) highlights the initial generation of multiple, circular pores that coalesce to form a larger perforation (Fig. 4B), a process through which the cell has survived (Fig. 4C). Additionally, dynamic membrane gaps between adjacent confluent cells also form minutes after ultrasound delivery and remain open for tens of minutes (Fig. 4 A, B, and E), an apparent indirect result of microbubble sonoporation. This provides a mechanistic explanation for enhanced extraluminal macromolecule delivery past the endothelial layer, for example the prolonged vascular permeability involved in ultrasound-microbubble–induced blood–brain–barrier disruption applications (16), and offers a potentially “tunable” opportunity for more protracted extravascular payload delivery, even after the cessation of ultrasound. A second sonoporation event on the same cell (Fig. 4F) confirms that, whereas the original membrane pore was shown to reseal in-plane (∼12 min), the unsaturated, intracellular transfer of PI ceases at an earlier time point (<2–2.5 min), suggesting a resealing along the lateral surface area between apical and basal membrane layers (Fig. 4D and Figs. S5 and S6). Confocal imaging of control cells (ultrasound delivery with no microbubble present) shows no membrane disruption (cells I, II, IV, and V in Fig. 4 A, B, and F).
Fig. 4.
A single sonoporation event results in pore generation that reseals along its lateral area, as well as generates intercellular gaps between adjacent confluent HUVECs that persist over longer timescales. (A) Maximum intensity projections from a 30-min recording of an individual 6.2-µm-diameter microbubble adjacent to a confluent HUVEC monolayer, insonicated with a single pulse (8 µs in duration). The first two frames depict five confluent cells (numbered I through V) pre-US delivery, with the cell borders outlined in white and the microbubble location indicated by a black arrow. Cell membranes have been fluorescently labeled (green) with a FAP complex (SI Methods). Membrane perforation (white arrow) is immediately generated at the point of bubble–cell contact (cell III), concurrent with the entry of PI (red) at the site of the pore. Note the trailing edge of PI as it diffuses away from the pore and accumulates at the nucleus, indicating no further entry despite the apparent persistence of the pore itself (e.g., at 1.94 min). Gaps (arrowheads) between cell III (the directly sonoporated cell) and cells I and II (nonsonoporated cells) form minutes after US transmission and are dynamic throughout the 30-min recording. (B) Surface rendering of the same sonoporation event, highlighting the appearance of multiple, circular pores (at 0.33–1.46 min) followed by coalescence into a larger pore area (at 6.87min) and the trailing edge of PI entry. (C) Cell viability assay [calcein-AM (yellow) added 30 min after US], confirming that the cells shown in A and B remain viable at 40-min post-US. (Upper) Cells before and (Lower) after staining with calcein, respectively. (D) Quantification of PI in cell III over time (red line), highlighting the cessation of PI uptake despite the persistence of a large pore (blue line). (E) Comparison between the time course for the directly sonoporated pore and the indirectly generated gaps between cells I–III and II–III. The generation of gaps between adjacent cells occurs minutes after US transmission and can remain open for at least tens of minutes, suggesting a mechanism for extraluminal drug delivery and prolonged, enhanced vascular permeability. (F) The initiation of a second sonoporation event on cell III with an individual microbubble, resulting in the generation of a new membrane pore (white arrow) and further PI uptake (G), confirming that PI–nucleic acid interactions had not been previously saturated. This confirms that a single-pulse sonoporation event (A–E) can result in a resealable membrane pore from which the cell can survive. Although the membrane pore eventually reseals in-plane (∼12 min), the cessation of PI uptake occurs significantly earlier (<2 min), suggesting that out-of-plane membrane sealing between apical and basal sides of the cell (i.e., lateral surface area of pore) is responsible for the termination of extracellular marker/drug entry (D). (Scale bar, 20 µm.) See Movies S3 and S4.
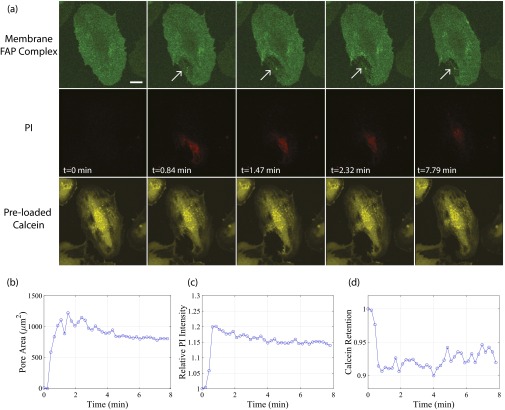
Fig. S5.
Membrane pores can reseal along their lateral surface area. (A) Selected frames of a maximum intensity projection of a real-time 3D confocal microscopy recording of sonoporation, highlighting the cell membrane (green, first row), PI (red, second row), and preloaded calcein-AM (yellow, third row) channels. Sonoporation induces a large pore (arrow) in the cell membrane which results in the immediate uptake of PI. Preloaded volume dye calcein-AM indicates that intracellular content loss is minimal after the immediate sonoporation event. (B) Membrane perforation persists at the 8-min time point, despite (C) an arrest in PI uptake and (D) the cessation of intracellular calcein loss at ∼1 min post-US delivery. US: A single, 8-cycle Tukey-windowed pulse at 1 MHz and 200 kPa delivered to a 4-µm-diameter bubble. (Scale bar, 20 µm.)
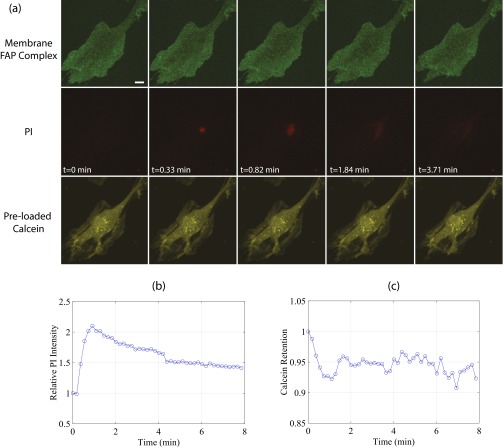
Fig. S6.
US-stimulated microbubbles can generate submicrometer pores. (A) Selected maximum intensity projections from a real-time 3D confocal microscopy recording of sonoporation, highlighting the cell membrane (green, first row), PI (red, second row), and preloaded calcein-AM (yellow, third row) channels. Despite no detectable membrane pore and minimal calcein loss, a marked increase in local PI concentration is observed at the site of bubble–cell contact. (B) Quantification of PI and (C) intracellular calcein loss. US: A single, 8-cycle Tukey-windowed pulse at 1 MHz and 300 kPa delivered to a 3-µm-diameter bubble. (Scale bar, 20 µm.)
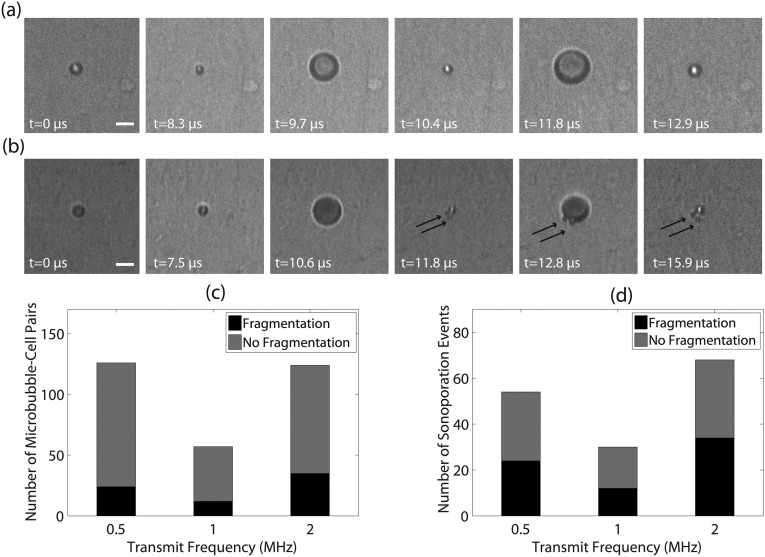
The critical pressure impulse above which sonoporation occurred, for example at 1 MHz, can be estimated as Pa ⋅ s. This is consistent with recent studies investigating cell membrane perforation induced by ultrasound shock waves (approximately megapascal range) applied over nanosecond timescales, which determined critical pressure impulses on the order of 10−3–10−1 Pa ⋅ s when bubbles are present (17, 18). In addition to the short timescales, the shear stress is limited to a small area of contact with the adjacent cell. Estimating the spatial scale of the contact surface to be the same order of magnitude as the bubble size ( 1 µm), the maximum tension in the cell membrane can be approximated by N/m. This estimate is consistent with previous studies that have investigated lipid bilayer membrane rupture threshold values of N/m (19–21). It has also been suggested that fluid microjets, a consequence of asymmetric bubble collapse, can rupture cell membranes (22). The data collected in the present study did not reveal the presence of jetting, potentially because of the viewing orientation with respect to the bubble–cell interface (23); however, microbubble fragmentation (i.e., inertial cavitation) was indeed observed (Fig. S7).
Fig. S7.
Sonoporation can be achieved through intact microbubble oscillations or through microbubble fragmentation. (A) Stable, large-amplitude microbubble vibration and (B) violent cavitation phenomena, for example microbubble fragmentation (in this example producing n = 2 daughter bubbles as demarcated by the black arrows) can both induce cellular sonoporation. These microbubbles were interrogated at 0.5 MHz and recorded with a frame rate of ∼5.07 MHz. Transmit pressures were 200 kPa and 150 kPa, respectively. (Scale bar, 5 µm.) (C) Intact microbubble oscillations were more frequently observed, and contributed to ∼50% of all sonoporation events independent of transmit frequency (D).
Acoustically activated microbubbles behave as actuators, focusing ultrasound energy from the millimeter- (e.g., mm) to the micrometer spatial scale, and in so doing induce local shear-stress magnitudes sufficient to produce localized plasma membrane pores and to generate prolonged intercellular gaps. Sonoporation can therefore be achieved with a variety of bubble sizes and forcing acoustic pressures. Assessing the biophysics of endothelial mechanotransducers subjected to short (microseconds), large-amplitude (kilopascal) shear stresses may prove useful in illuminating downstream biological mechanisms and consequences of sonoporation, including cytoskeleton shear force transduction and shear-stress–mediated vasoregulation factors [e.g., nitric oxide production (24), reactive oxygen species]. From a translational standpoint, the development of sonication regimes in which microbubbles can be forced into a “controlled” oscillation characteristic (e.g., to generate threshold shear-stress magnitudes) requires further experimental and theoretical investigation, with particular focus on how intrinsic encapsulation heterogeneity may alter the response of an ostensibly identical microbubble to the same ultrasonic stimulus (25).
Materials and Methods
For a detailed description of the materials and methods, including information on the simultaneous microscopy system, microbubble preparation, cell culture, stress calculations, and real-time spectral confocal microscopy experiments, please refer to Supporting Information.
SI Methods
Simultaneous Imaging System.
US-stimulated microbubble dynamics were recorded with the UPMC-Cam (26), an ultrafast-frame microscopy imaging system capable of recording up to 25 Mfps for 128 frames (i.e., submicrosecond resolution) by using a flash lamp as a bright-field light source. To correlate these findings with sonoporation activity, a second CCD camera was used for epifluorescence imaging. To obtain simultaneous recordings, the Cy3 excitation filter and associated dichroic mirror (e.g., 562 nm) were left permanently in position between the fluorescence light source and the objective lens. Furthermore, to allow a sufficient number of photons from the flash lamp to reach the UPMC-Cam detectors for the ultrafast-frame bright-field recordings, the emission filter for a given fluorophore (e.g., 593/40 nm) was removed from the filter cube and placed downstream of the 50/50 mirror, only filtering light to the individual CCD camera. Bright-field microsecond timescale microscopy observations may therefore be directly, simultaneously correlated to the epifluorescence microscopy of cellular dynamics over seconds to minutes.
US Transmission and Coalignment.
A custom-made water tank was constructed to house any of three single-element transducers used in this study (f = 0.5 MHz, f# = 1.65, model A301S-SU-F1.65-PTF; f = 1 MHz, f# = 1.67, model A302S-SU-F1.63-PTF; f = 2.25 MHz, f# = 2, model V306-SU-PTF, Olympus NDT) at an angle of 45° from below along with a port to house the liquid light guide used to deliver the flash-lamp illumination. In addition, a third entry port was created to house a copper heating coil connected to a heated water circulating reservoir (07999-000, Gaymar T/Pump), used to maintain the water temperature at 37 °C. Optical–acoustical coalignment was performed with a pulse–echo approach, by way of an US pulser–receiver (5073PR, Olympus NTD) and a false objective lens (26). Individual microbubbles, adjacent to a calcein-loaded HUVEC monolayer and in the presence of PI, were insonicated with a single, Tukey-windowed US pulse at a frequency of either 0.5, 1, or 2 MHz, with pulse durations ranging from 4 to 16 µs, generated from an arbitrary function generator (AFG3252, Tektronix) and amplified by a gated rf power amplifier (model 250A250 AM8, Amplifier Research). The transmit pulses were sent at a peak negative pressure from 0.1 to 0.4 MPa, 0.2 to 0.8 MPa, and 0.2 to 0.6 MPa for 0.5 MHz, 1 MHz, and 2 MHz, respectively, as measured in a separate water tank with a hydrophone (HGL-0200, Onda Corp).
Microbubble Preparation.
Distearoyl-sn-glycero-3-phosphocholine, 1,2-distearoyl-sn-glycero-3-ethylphosphocholine, and polyoxyethylene(40) glycerol stearate (2: 1: 1, wt/wt/w) were dissolved in chloroform. After chloroform evaporation, the solution was vacuum-dried. The dried lipid film was rehydrated in saline with a final lipid concentration of 10 mg/mL for 4 h at room temperature, and sonicated with a 20-kHz probe (Heat Systems Ultrasonics) in the presence of perfluorobutane gas (FluoroMed, L.P.). This synthesis technique yields a microbubble concentration of ∼2 × 10⁹ bubbles per milliliter and a size distribution with a peak diameter of 2.1 μm, as measured by a Coulter Counter (Multisizer 3, Beckman Coulter). Microbubble vials were stored a 4 °C and were allowed to reach room temperature before agent withdrawal (∼0.1 mL with an 18-G needle, and a second 18-G venting needle).
Cell Culture.
Primary HUVECs (C2519A, Lonza) were cultured in EGM-2 medium (C3162, Lonza) and incubated at 37 °C with 5% (vol/vol) CO2. HUVECs were chosen for this study due to the intravascular nature of microbubbles. Upon reaching approximate confluence in a Falcon flask (#353112, Fisher Scientific), the HUVECs were trypsinized (17-161E, Lonza) and replated into an Opticell chamber (Thermo Scientific). An Opticell chamber consists of two 50-cm2 gas-permeable, polystyrene membranes ∼75 µm in thickness and separated by 2 mm. The following day, the medium within the Opticell was replaced with a fresh 10 mL, and the cells were cultured for another 2 d to conduct experiments on HUVEC monolayers characterized by an approximate confluence of 80–90%. All experiments were performed on cells with passage numbers P ≤ 10.
Fluorescent Markers.
PI (P1304MP, Molecular Probes) was used as a model drug to detect sonoporation events. PI is a nonfluorescent, cell-impermeant intercalating agent that exhibits a dramatic increase in fluorescence upon binding to RNA/DNA complexes (535/617 nm). In addition, for a subset of experiments calcein-AM (C3099, Molecular Probes, molecular weight 994 g/mol), a nonfluorescent acetoxymethyl (AM) ester derivative of calcein (i.e., a fluorescein complex), was diluted into the culture medium. Upon transport within the cell, intracellular esterases cleave the acetomethoxyl group where the complex becomes cell membrane impermeable and fluorescent (excitation/emission of 488/520 nm). Intracellular calcein retention was therefore used as a secondary indicator of cell membrane permeability, and as a marker for a loss of intracellular content.
Data Analysis.
To extract the dynamic behavior of individual microbubbles from the ultrahigh-speed bright-field recordings, offline analysis was performed in MATLAB (The Mathworks) with custom-designed edge detection software (27). The epifluorescence microscopy recordings were analyzed offline by use of ImageJ (https://imagej.nih.gov/ij/). Regions of interest were manually drawn to encompass (i) the entire cell nucleus (where applicable) and (ii) the cell cytoplasm near the site of PI entry. In this manner, PI mean intensity–time curves were obtained and features including maximum PI intensity and rate of PI uptake were assessed for both regions. While the area of the regions of interest in the cell cytoplasm was kept constant from cell to cell (rectangular in shape, 18 µm2), the region of interest surrounding the entire cell nucleus was necessarily different, as each cell need not possess an identically sized nucleus (ranging from 118 to 213 µm2).
Cell Membrane Visualization Experiments.
Two days before experiments, HUVECs cultured in a Falcon flask were seeded on glass-bottom dishes (MatTek Corporation, #P50G-0–30-F), and plasma membrane visualization was performed via an FAP complex. Specifically, the HUVECs were transduced 24 h before experiments with a nonfluorescent, single-chain antibody targeted to a cell membrane protein. Immediately before experiments, 5 µl microbubble solution (1:200 in culture medium) was placed on top of the cells. The culture dish was inverted for approximately 1 min to allow the bubbles to come into contact with the cell layer through buoyancy. A nonfluorescent, cell-impermeable fluorogen was then added to the medium. Upon binding to the FAP, the fluorescence yield of the fluorogen is increased ∼20,000-fold with a Cy5 excitation-emission spectrum (28). In this manner, cell membrane visualization can be robustly achieved with minimal dye internalization and without requiring a wash step. Finally, PI was added into the medium solution (120 µM) to provide qualitatively comparable information to that of the ultrahigh-speed microscopy experiments. Imaging was performed on a Nikon A1R Spectral confocal microscope with a 60× oil-immersion lens (N.A. = 1.49). Complete z stacks were acquired by way of a resonant scanner, with a slice thickness of 1 µm. US delivery via a flat, single-element transducer (f = 1 MHz, 13-mm diameter, Olympus, #A303S-SU) was achieved by way of an in-house–fabricated water-filled coupling cone, positioned at ∼45° from the optical axis. Offline image analysis was performed with both NIS Elements (Nikon) and Imaris (Bitplane Inc.) software. Pore size estimates were performed with MATLAB by using an edge detection algorithm (i.e., Sobel filter).
Microbubble-Induced Stress Estimates.
Microbubble-induced normal and shear stresses exerted upon its neighboring cell were estimated from the ultrahigh-speed recordings of microbubble oscillation dynamics. The normal stress was estimated from the linearized Euler’s equation (equation 2.61 in ref. 29):
| [S1] |
where is the fluid density (kilogram/cubic meter), is the frequency (hertz), is the resting radius (meters), and is the relative radial expansion. The shear stress due to microbubble oscillation , often referred to as “ac shear stress” (30), was calculated according to Newton’s law of viscosity assuming a “no-slip” boundary condition (i.e., fluid velocity is zero at the cell wall), and the relevant length scale given by the boundary layer thickness (31), where is the fluid oscillation frequency. Newton’s law of viscosity is calculated from the spatial gradient in fluid velocity and the maximum shear stress was estimated in the current study by
| [S2] |
Estimated Scattered Acoustic Emissions.
The acoustic emission P(r,t) at a given location r from an oscillating microbubble was estimated from the recorded radial dynamics R(t) via Euler’s equation (29, 32):
| [S3] |
where the dots denote differentiation with time. Estimated acoustic emissions at the fundamental (at the transmit frequency) and second harmonic (at twice the transmit frequency) were calculated from digital band-pass filtering of Eq. S3.
Statistics.
All statistical analyses were performed with MATLAB. Linear correlations conducted on the epifluorescence microscopy data were performed with Pearson’s correlation coefficient. Threshold analysis was conducted by way of linear discriminant analysis. Fitting of the 2D shear-stress thresholds was conducted by minimizing the sum of the square of the differences between the measured and calculated values (i.e., residual sum of squares), with the error taken as the values that yield twice the minimum cost. Overall goodness-of-fit was reported as an R2 value, calculated as , where is the total sum of squares between the observed shear-stress values and the mean of these values .
Supplementary Material
Acknowledgments
The authors thank Dr. Bin Qin for microbubble preparation and Dr. Alfred Yu for helpful discussions. The authors also thank the Center for Biologic Imaging for assistance with the confocal microscopy studies, specifically Jenny Zeng for the fluorogen-activating protein (FAP) adenoviral transduction, and both Callen Wallace and Morgan Jessup for technical assistance. This work was partly funded by the National Institutes of Health (Grants R01EB016516-01A1 and 1S10OD019973-01), the Fonds de Recherche Natures et Technologies postdoctoral grant from Quebec, Canada, and the Center for Ultrasound Molecular Imaging and Therapeutics, University of Pittsburgh.
Footnotes
The authors declare no conflict of interest.
This article is a PNAS Direct Submission.
This article contains supporting information online at www.pnas.org/lookup/suppl/doi:10.1073/pnas.1606915113/-/DCSupplemental.
References
- 1.Otake K, Ennist DL, Harrod K, Trapnell BC. Nonspecific inflammation inhibits adenovirus-mediated pulmonary gene transfer and expression independent of specific acquired immune responses. Hum Gene Ther. 1998;9(15):2207–2222. doi: 10.1089/hum.1998.9.15-2207. [DOI] [PubMed] [Google Scholar]
- 2.Verma IM, Somia N. Gene therapy -- promises, problems and prospects. Nature. 1997;389(6648):239–242. doi: 10.1038/38410. [DOI] [PubMed] [Google Scholar]
- 3.Al-Dosari MS, Gao X. Nonviral gene delivery: Principle, limitations, and recent progress. AAPS J. 2009;11(4):671–681. doi: 10.1208/s12248-009-9143-y. [DOI] [PMC free article] [PubMed] [Google Scholar]
- 4.Mehier-Humbert S, Guy RH. Physical methods for gene transfer: Improving the kinetics of gene delivery into cells. Adv Drug Deliv Rev. 2005;57(5):733–753. doi: 10.1016/j.addr.2004.12.007. [DOI] [PubMed] [Google Scholar]
- 5.Varkouhi AK, Scholte M, Storm G, Haisma HJ. Endosomal escape pathways for delivery of biologicals. J Control Release. 2011;151(3):220–228. doi: 10.1016/j.jconrel.2010.11.004. [DOI] [PubMed] [Google Scholar]
- 6.van Wamel A, et al. Vibrating microbubbles poking individual cells: Drug transfer into cells via sonoporation. J Control Release. 2006;112(2):149–155. doi: 10.1016/j.jconrel.2006.02.007. [DOI] [PubMed] [Google Scholar]
- 7.Leow RS, Wan JMF, Yu ACH. Membrane blebbing as a recovery manoeuvre in site-specific sonoporation mediated by targeted microbubbles. J R Soc Interface. 2015;12(105):20150029. doi: 10.1098/rsif.2015.0029. [DOI] [PMC free article] [PubMed] [Google Scholar]
- 8.Park J, Fan Z, Deng CX. Effects of shear stress cultivation on cell membrane disruption and intracellular calcium concentration in sonoporation of endothelial cells. J Biomech. 2011;44(1):164–169. doi: 10.1016/j.jbiomech.2010.09.003. [DOI] [PMC free article] [PubMed] [Google Scholar]
- 9.Kudo N, Okada K, Yamamoto K. Sonoporation by single-shot pulsed ultrasound with microbubbles adjacent to cells. Biophys J. 2009;96(12):4866–4876. doi: 10.1016/j.bpj.2009.02.072. [DOI] [PMC free article] [PubMed] [Google Scholar]
- 10.Fan Z, Liu H, Mayer M, Deng CX. Spatiotemporally controlled single cell sonoporation. Proc Natl Acad Sci USA. 2012;109(41):16486–16491. doi: 10.1073/pnas.1208198109. [DOI] [PMC free article] [PubMed] [Google Scholar]
- 11.Shohet RV, et al. Echocardiographic destruction of albumin microbubbles directs gene delivery to the myocardium. Circulation. 2000;101(22):2554–2556. doi: 10.1161/01.cir.101.22.2554. [DOI] [PubMed] [Google Scholar]
- 12.Leong-Poi H, et al. Therapeutic arteriogenesis by ultrasound-mediated VEGF165 plasmid gene delivery to chronically ischemic skeletal muscle. Circ Res. 2007;101(3):295–303. doi: 10.1161/CIRCRESAHA.107.148676. [DOI] [PubMed] [Google Scholar]
- 13.Carson AR, et al. Ultrasound-targeted microbubble destruction to deliver siRNA cancer therapy. Cancer Res. 2012;72(23):6191–6199. doi: 10.1158/0008-5472.CAN-11-4079. [DOI] [PMC free article] [PubMed] [Google Scholar]
- 14.Polak J. Cyclic deformation, crack initiation, and low-cycle fatigue. In: Milne I, Ritchie RO, Karihaloo B, editors. Comprehensive Structural Integrity: Fracture of Materials from Nano to Macro. Elsevier; Amsterdam: 2003. pp. 33–35. [Google Scholar]
- 15.Fabry B, et al. Scaling the microrheology of living cells. Phys Rev Lett. 2001;87(14):148102. doi: 10.1103/PhysRevLett.87.148102. [DOI] [PubMed] [Google Scholar]
- 16.Hynynen K, McDannold N, Sheikov NA, Jolesz FA, Vykhodtseva N. Local and reversible blood-brain barrier disruption by noninvasive focused ultrasound at frequencies suitable for trans-skull sonications. Neuroimage. 2005;24(1):12–20. doi: 10.1016/j.neuroimage.2004.06.046. [DOI] [PubMed] [Google Scholar]
- 17.Kodama T, et al. Cavitation bubbles mediated molecular delivery during sonoporation. J Biomech Sci Eng. 2009;4(1):124–130. [Google Scholar]
- 18.Adhikari U, Goliaei A, Berkowitz ML. Mechanism of membrane poration by shock wave induced nanobubble collapse: A molecular dynamics study. J Phys Chem B. 2015;119(20):6225–6234. doi: 10.1021/acs.jpcb.5b02218. [DOI] [PubMed] [Google Scholar]
- 19.Needham D, Hochmuth RM. Electro-mechanical permeabilization of lipid vesicles. Role of membrane tension and compressibility. Biophys J. 1989;55(5):1001–1009. doi: 10.1016/S0006-3495(89)82898-X. [DOI] [PMC free article] [PubMed] [Google Scholar]
- 20.Boal D. Growth and Division. Mechanics of the Cell. Cambridge Univ Press; New York: 2002. pp. 454–492. [Google Scholar]
- 21.Marmottant P, Hilgenfeldt S. Controlled vesicle deformation and lysis by single oscillating bubbles. Nature. 2003;423(6936):153–156. doi: 10.1038/nature01613. [DOI] [PubMed] [Google Scholar]
- 22.Prentice P, Cuschieri A, Dholakia K, Prausnitz M, Campbell P. Membrane disruption by optically controlled microbubble cavitation. Nat Phys. 2005;1(2):107–110. [Google Scholar]
- 23.Vos HJ, Dollet B, Versluis M, de Jong N. Nonspherical shape oscillations of coated microbubbles in contact with a wall. Ultrasound Med Biol. 2011;37(6):935–948. doi: 10.1016/j.ultrasmedbio.2011.02.013. [DOI] [PubMed] [Google Scholar]
- 24.Davies PF. Flow-mediated endothelial mechanotransduction. Physiol Rev. 1995;75(3):519–560. doi: 10.1152/physrev.1995.75.3.519. [DOI] [PMC free article] [PubMed] [Google Scholar]
- 25.Overvelde M, et al. Nonlinear shell behavior of phospholipid-coated microbubbles. Ultrasound Med Biol. 2010;36(12):2080–2092. doi: 10.1016/j.ultrasmedbio.2010.08.015. [DOI] [PubMed] [Google Scholar]
- 26.Chen X, Wang J, Versluis M, de Jong N, Villanueva FS. Ultra-fast bright field and fluorescence imaging of the dynamics of micrometer-sized objects. Rev Sci Instrum. 2013;84(6):063701. doi: 10.1063/1.4809168. [DOI] [PMC free article] [PubMed] [Google Scholar]
- 27.Helfield BL, Cherin E, Foster FS, Goertz DE. Investigating the subharmonic response of individual phospholipid encapsulated microbubbles at high frequencies: A comparative study of five agents. Ultrasound Med Biol. 2012;38(5):846–863. doi: 10.1016/j.ultrasmedbio.2012.01.011. [DOI] [PubMed] [Google Scholar]
- 28.Szent-Gyorgyi C, et al. Fluorogen-activating single-chain antibodies for imaging cell surface proteins. Nat Biotechnol. 2008;26(2):235–240. doi: 10.1038/nbt1368. [DOI] [PubMed] [Google Scholar]
- 29.Leighton TG. Cavitation Inception and Fluid Dynamics. The Acoustic Bubble. Academic; London: 1994. pp. 67–128. [Google Scholar]
- 30.Rooney JA. Shear as a mechanism for sonically induced biological effects. J Acoust Soc Am. 1972;52(6):1718–1724. doi: 10.1121/1.1913306. [DOI] [PubMed] [Google Scholar]
- 31.Blackstock DT. Propagation in Dissipative Fluids: Absorption and Dispersion. Fundamentals of Physical Acoustics. John Wiley and Sons; New York: 2000. pp. 298–334. [Google Scholar]
- 32.Sijl J, et al. Acoustic characterization of single ultrasound contrast agent microbubbles. J Acoust Soc Am. 2008;124(6):4091–4097. doi: 10.1121/1.2997437. [DOI] [PubMed] [Google Scholar]
Associated Data
This section collects any data citations, data availability statements, or supplementary materials included in this article.


