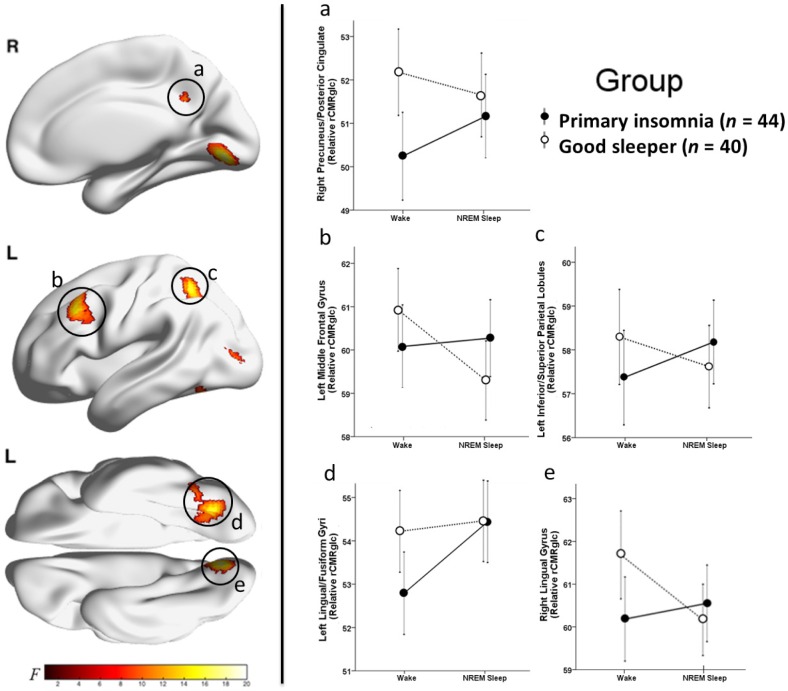
Figure 1.
Group-by-state interactions in relative regional cerebral metabolic rate for glucose. We assessed relative regional cerebral metabolic rate for glucose (rCMRglc) in a sample of 44 patients with primary insomnia (PI) and 40 good sleeper controls (GS) during wake and nonrapid eye movement (NREM) sleep. Clusters showing significant group (PI vs. GS) by state (wake vs. NREM sleep) interactions for relative rCMRglc are indicated by red-yellow colors in the above brain images. The color bar represents F values in the identified clusters. Clusters with significant interactions were identified in regions of the (a) right precuneus/posterior cingulate cortex, (b) left middle frontal gyrus, (c) left inferior/superior parietal lobules, (d) left lingual/fusiform/occipital gyri, and (e) right lingual gyrus, P3DC_corrected < 0.05 for all (Table 3). We extracted the voxelwise data from the circled clusters and plotted these data to the right. In these line graphs, the closed circles connected with a solid line represent extracted average relative rCMRglc from the respective significant cluster (a–e) for PI and the open circles connected by a dotted line represent GS. Error bars represent the 95% confidence interval computed voxelwise within each cluster. L = left; R = right.

