Abstract
Study Objectives:
Existing mathematical models of neurobehavioral performance cannot predict the beneficial effects of caffeine across the spectrum of sleep loss conditions, limiting their practical utility. Here, we closed this research gap by integrating a model of caffeine effects with the recently validated unified model of performance (UMP) into a single, unified modeling framework. We then assessed the accuracy of this new UMP in predicting performance across multiple studies.
Methods:
We hypothesized that the pharmacodynamics of caffeine vary similarly during both wakefulness and sleep, and that caffeine has a multiplicative effect on performance. Accordingly, to represent the effects of caffeine in the UMP, we multiplied a dose-dependent caffeine factor (which accounts for the pharmacokinetics and pharmacodynamics of caffeine) to the performance estimated in the absence of caffeine. We assessed the UMP predictions in 14 distinct laboratory- and field-study conditions, including 7 different sleep-loss schedules (from 5 h of sleep per night to continuous sleep loss for 85 h) and 6 different caffeine doses (from placebo to repeated 200 mg doses to a single dose of 600 mg).
Results:
The UMP accurately predicted group-average psychomotor vigilance task performance data across the different sleep loss and caffeine conditions (6% < error < 27%), yielding greater accuracy for mild and moderate sleep loss conditions than for more severe cases. Overall, accounting for the effects of caffeine resulted in improved predictions (after caffeine consumption) by up to 70%.
Conclusions:
The UMP provides the first comprehensive tool for accurate selection of combinations of sleep schedules and caffeine countermeasure strategies to optimize neurobehavioral performance.
Citation:
Ramakrishnan S, Wesensten NJ, Kamimori GH, Moon JE, Balkin TJ, Reifman J. A unified model of performance for predicting the effects of sleep and caffeine. SLEEP 2016;39(10):1827–1841.
Keywords: biomathematical model, caffeine model, chronic sleep restriction, PVT, total sleep deprivation
Significance.
Caffeine is the most widely consumed stimulant in the world. Hence, to be useful, mathematical models that predict the effects of sleep loss on human neurobehavioral performance must account for the performance-enhancing effects of caffeine. For the first time, we showed that a mathematical model can accurately predict the effects of single and multiple doses of caffeine on group-average performance across the continuum of sleep loss—from limited nightly sleep to continuous sleep loss—for multiple nights. This model forms the basis for the development of comprehensive sleep-management tools and for the generation of testable hypothesis of realistic sleep-loss schedules involving the consumption of caffeine products.
INTRODUCTION
Mathematical models that accurately predict the effects of sleep/wake schedules on human neurobehavioral performance are valuable tools for effective management of operational alertness and fatigue. However, to be of practical use, they must also be able to predict the alertness- and performance-enhancing effects of caffeine, the most widely used stimulant compound. Caffeine is available in a wide range of concentrations in myriad foods and beverages, including coffee, tea, soft drinks, and energy drinks, providing a spectrum of performance-improving effects. Nevertheless, the most thoroughly validated predictive models of performance do not account for the effects of caffeine,1,2 and the few that do have limitations. For example, the models proposed by Benitez et al.3 and by Ramakrishnan et al.4,5 can only account for the effects of caffeine under total sleep deprivation (TSD). The model proposed by Puckeridge et al.6 (the only model published to date that theoretically accounts for the effects of caffeine on performance under any sleep/wake schedule) has other practical limitations: their model was validated only on subjective sleepiness scores from a single study, involving a single large dose of caffeine (600 mg) administered after 49 h of TSD. Accordingly, it is not clear how well this model predicts objective measures of neurobehavioral performance under more typical operational conditions—characterized by milder sleep loss and repeated caffeine dosing at levels ranging from ∼100 mg to ∼200 mg.
We recently developed the unified model of performance (UMP), a more parsimonious (“caffeine-free”) model, and showed that the UMP provides accurate predictions of objective measures of human performance across numerous studies spanning the continuum of sleep loss—from chronic sleep restriction (CSR) to TSD—at a group-average level.2,7 Separately, we developed a model that considers the neurobehavioral effects of caffeine, and validated it using three TSD studies.4,5
Here, we combined the original UMP with our caffeine model into a single, unified modeling framework (henceforth termed UMP), and validated its predictions across a wide range of sleep/wake schedules and caffeine doses. These included (1) different sleep durations, (2) single and repeated caffeine doses consumed at different times of the day, and (3) both laboratory and field studies. Once validated, we used the UMP to perform simulations and determine the timing and dosage of caffeine required to achieve equivalent performance benefits to those observed in sleep extension, e.g., 10 h time in bed (TIB) per night prior to sleep loss.
METHODS
Datasets
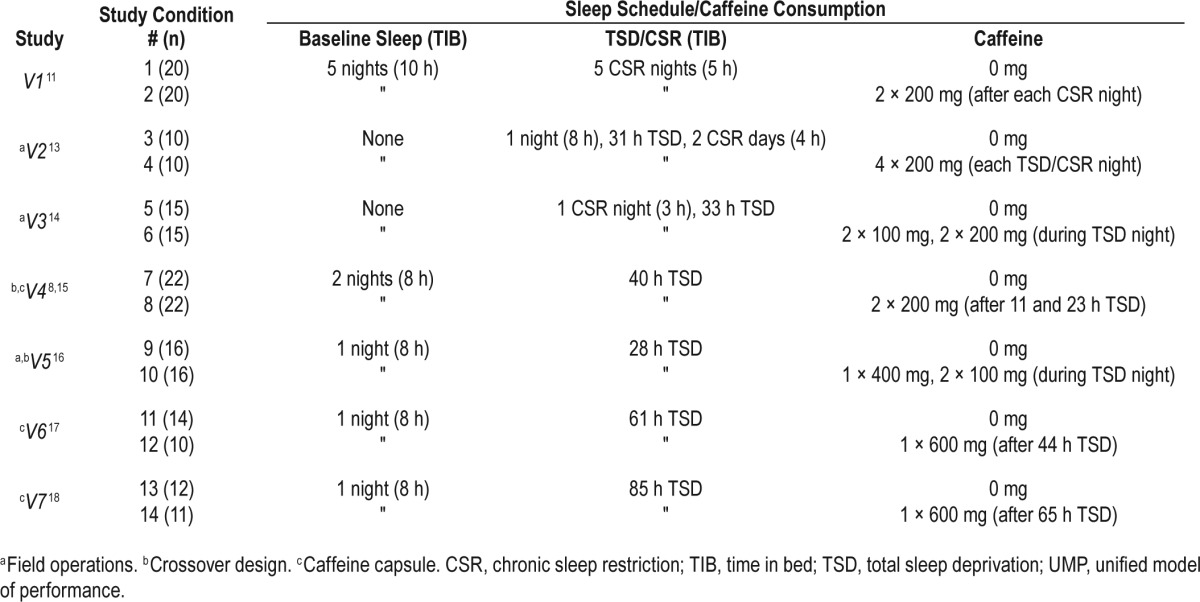
We obtained psychomotor vigilance task (PVT) lapse data (number of response times [RT] > 500 msec) and mean RT data (in the range: 100 msec < RT < 3,000 msec) from nine different sleep studies conducted in laboratory or field environments, encompassing a whole host of sleep schedules and caffeine-consumption conditions. We then used data from two of these studies (studies T1 and T2) to estimate the parameters of the UMP, and the remaining seven studies (studies V1–V7, including 14 different sleep and caffeine conditions) to validate the model predictions. These nine studies are briefly described in the following paragraphs, and studies V1–V7 are summarized in Table 1. Raw data were available for all studies except study V4, for which group-average data were captured from a published figure.8
Table 1.
Sleep and caffeine conditions of the seven studies used to validate the UMP.
Study T1
Following 3 baseline nights of 8 h TIB, 57 healthy adults (ages 24–62 y, mean 38 y) underwent a CSR phase of 7 consecutive nights of 3, 5, 7, or 9 h TIB followed by 3 consecutive nights of 8 h TIB (recovery phase) in a controlled laboratory study.9 A 10-min PVT was administered four times per day (09:30, 12:30, 15:30, and 21:30). Subjects in the 3- and 5-h TIB study conditions performed additional PVT sessions (at 00:15 for both study conditions and again at 02:15 for the 3-h TIB study condition) during their additional time awake.
Study T2
Following a baseline night of 8 h TIB, 48 healthy young adults (ages 18–35 y, mean 25 y) were kept awake for 29 consecutive hours in a controlled laboratory environment.10 The subjects were randomly assigned to one of four dose groups (placebo, 50, 100, or 200 mg, n = 12 subjects/group) and were administered the corresponding dose of Stay Alert (Amurol Confectioners, Yorkville, IL) caffeinated chewing gum at the beginning of each of three 2-h test blocks after 20, 22, and 24 h of sleep loss (corresponding to 03:00, 05:00, and 07:00, respectively, on day 2). All subjects completed 10-min PVTs starting at 08:00 on day 1 and ending at 12:00 on day 2, for a total of 29 PVT sessions, including nine sessions before caffeine administration, six sessions during each of the three subsequent 2-h test blocks, and two additional tests after the third 2-h test block.
Study V1
Forty healthy young adults (ages 18–39 y, mean 25.4 y) underwent 5 consecutive nights of 5 h TIB (CSR phase) in a controlled laboratory study.11 Sleep restriction was preceded by 5 consecutive nights of 10 h TIB (baseline phase) and followed by 3 consecutive nights of 8 h TIB (recovery phase). The subjects were randomly assigned to receive placebo or 200 mg of caffeine chewing gum (n = 20 each) twice daily at 08:00 and 12:00 during the CSR phase. During all phases, subjects completed 10-min PVTs every hour throughout their time awake.
Study V2
Twenty male Special Forces personnel (ages 19–32, mean 28.6 y) participated in a field study of sustained operations, involving cognitive tasks, obstacle courses, training exercises, live-fire marksmanship tasks, and field vigilance tasks.12 Following an overnight 8-h sleep period, the subjects underwent 31 h of TSD followed by two days of CSR with 4 h of daytime sleep from 13:30 to 17:30 and a 2-h sleep period from 09:30 to 11:30 on the last day.13 The subjects were randomly assigned to receive four 200-mg doses of caffeine chewing gum (n = 10) or placebo (n = 10) during each of the TSD and CSR nights (at 21:45, 01:00, 03:45, and 07:00). A 5-min PVT was administered during the entire wake period, including 10 PVT sessions per day during the TSD and CSR schedules.
Study V3
Thirty healthy male soldiers (mean age 23.6 y, standard deviation [SD] 4.5 y) underwent a sustained 55-h field exercise that involved restricted sleep (02:00 to 05:00) during the first night followed by 33 h of TSD.14 The field exercise involved 5-km runs, marksmanship tasks, urban operation vigilance tasks, and PVTs. The soldiers were randomly divided into two groups; one group was administered placebo (n = 15) and the other group was administered 100, 200, 100, and 200 mg of caffeine chewing gum (n = 15) during the TSD night at 21:45, 23:45, 01:45, and 03:45, respectively. Soldiers performed 5-min PVTs during the evening and nighttime hours. (Age range of the participating soldiers was not available in the original publication.14)
Study V4
Twenty-two healthy young subjects (ages 20–30 y, mean 24.7 y) underwent 40 h of TSD on two occasions (separated by 1 w) in a crossover-design laboratory study. Subjects received a capsule with either placebo after 11 and 23 h of wakefulness (at 19:00 and 07:00, respectively) or 200 mg of caffeine on each of the two occasions.8,15 The TSD phase was preceded by 2 nights of 8 h TIB (baseline) and followed by 1 night of 10.5 h TIB (recovery). During the TSD phase, subjects completed 14 sessions of a 10-min PVT at 3-h intervals. Only transformed lapses () were reported for this study.8
Study V5
Following a baseline night of 8 h TIB, 16 healthy Canadian Forces personnel (mean 26.7 y, SD 7.8 y) underwent 28 h of TSD on two occasions (separated by at least 5 d) in a crossover-design laboratory study intended to simulate military field operations.16 On one occasion, subjects received placebo, whereas on the other occasion, they received 400, 100, and 100 mg of caffeine chewing gum during the TSD night at 21:30, 03:00, and 05:00, respectively. Subjects performed 11 5-min PVTs throughout the 28-h TSD phase. (Age range of the participating subjects was not available in the original publication.16)
Study V6
Twenty-four healthy adults (ages 18–36, mean 23.5 y) were randomly assigned to receive a capsule with either placebo (n = 14) or 600 mg of caffeine (n = 10) after 44 h of wakefulness during a 61-h TSD laboratory study.17 The TSD phase was preceded by one night of 8 h TIB (baseline) and followed by one night of 12 h TIB (recovery). All subjects performed a 5-min PVT every 2 h throughout their time awake.
Study V7
Following a baseline night of 8 h TIB, 23 healthy adults (ages 19–39, mean 25.1 y) were randomly assigned to receive a capsule with placebo (n = 12) or 600 mg of caffeine (n = 11) after 65 h of wakefulness during a 85-h TSD laboratory study.18 A 12-h TIB recovery sleep period commenced at 85 h of sleep deprivation. All subjects completed a 10-min PVT every 2 h during the entire wake period.
In studies V2 and V3, information about the baseline sleep duration was not available. In all studies except V3, subjects were habitually low to moderate caffeine users, with an average self-reported daily caffeine consumption of < 400 mg. Most of the subjects in study V3 were habitually high caffeine users. Nevertheless, prior analyses have shown that the differences in PVT performance between the habitually low and habitually high caffeine users are not statistically significant.5,19
All studies were approved by the appropriate local ethics committee for research on human subjects, and were performed in accordance with the ethical standards of the 1964 Declaration of Helsinki. Written informed consent was obtained from all subjects prior to their participation.
Extension of the UMP to Account for Caffeine Effects
To account for sleep/wake cycles and caffeine effects in the UMP, we hypothesized that the pharmacokinetic (PK) and pharmacodynamic (PD) effects of caffeine are unaffected due to switching of states between wakefulness and sleep. That is, we assumed that caffeine is eliminated from the body at the same rate during both wakefulness and sleep, and that its effects on performance dissipate in a similar manner. This is in contrast to our prior caffeine model, where such an assumption was not required because the effects of caffeine were only modeled during wakefulness.4,5 In addition, here we further hypothesized that caffeine has a multiplicative effect on performance throughout the sleep/wake cycle. In other words, we assumed that, after caffeine intake at time t0, the UMP-predicted PVT performance impairment Pc(t), for caffeine dose c at time t, can be formulated as:
where P0(t) represents the UMP-predicted performance impairment at time t (regardless of sleep/wake state) in the absence of caffeine (henceforth referred to as caffeine-free predicted performance) and gPD(t,c) represents the caffeine-effect factor at time t, for caffeine dose c, with 0 ≤ gPD(t,c) ≤ 1, where 1 corresponds to PD effects in the absence of caffeine (i.e., the most impaired performance) and 0 corresponds to the maximal PD effect on cognitive performance (i.e., complete restoration with no impairment). In this context, performance impairment levels decrease (i.e., performance improves) after caffeine in-take and, eventually, as caffeine is metabolized and cleared, performance returns to the levels that would be observed if caffeine had not been administered.
Here, we used the original UMP to obtain P0(t) for the durations of wake and sleep.2,7 To obtain the caffeine-effect factor g PD(t,c), we used our previously developed PD model of caffeine, which relates the PK of caffeine to the PD effects via the Hill equation.5 Table 2 summarizes the biomathematical equations governing the extended UMP. Equations 2–5 summarize the original (caffeine-free) UMP and Equation 6 summarizes the caffeine-effect factor gPD. In summary, because of the multiplicative nature of the formulation in Equation 1, the absolute effect of caffeine on performance (i.e., the magnitude of change in performance due to caffeine) is a function of not only the caffeine dose c and the time since caffeine consumption, but also the time of day t.
Table 2.
Governing equations of the unified model of performance.
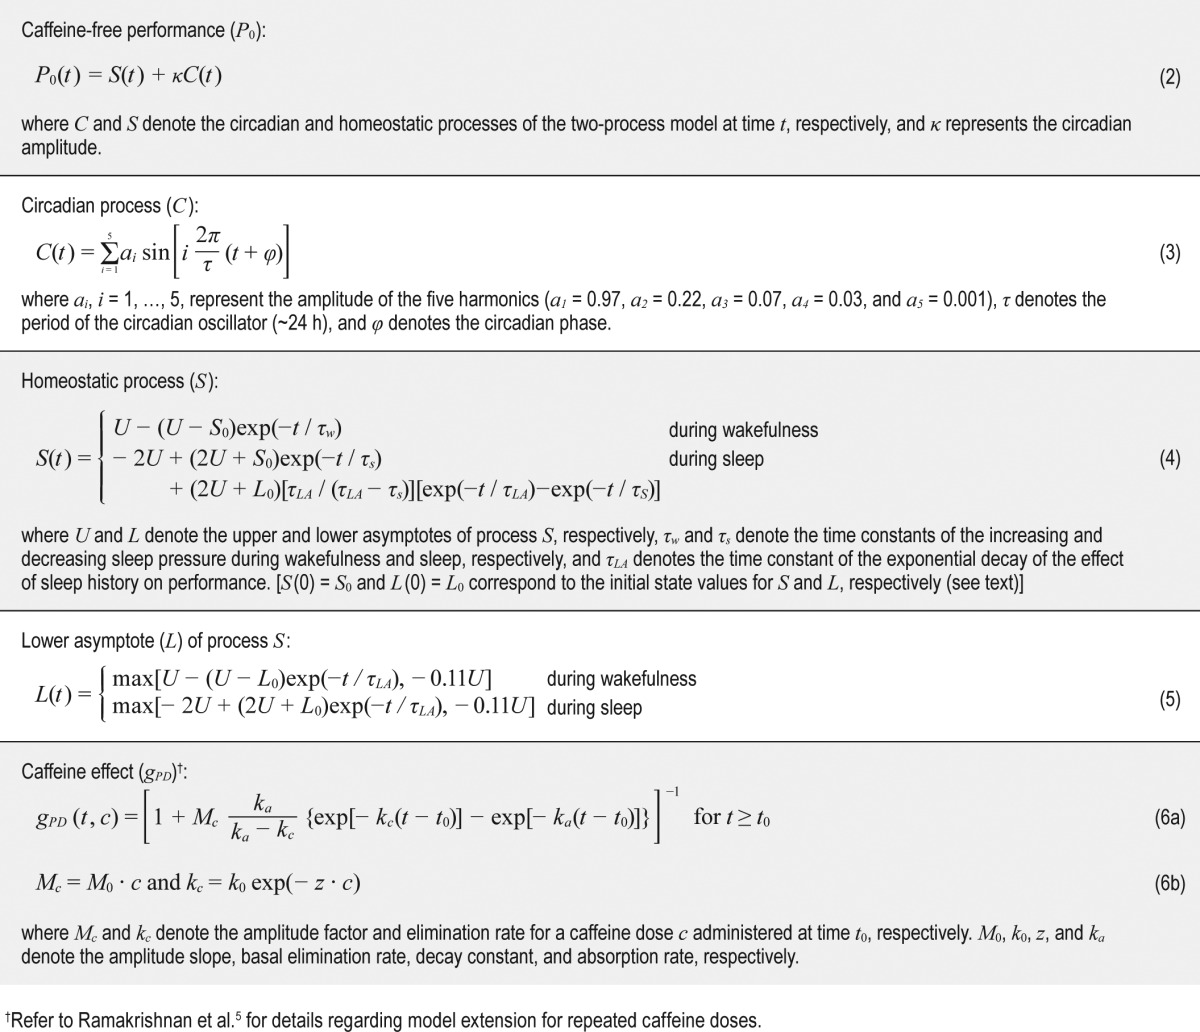
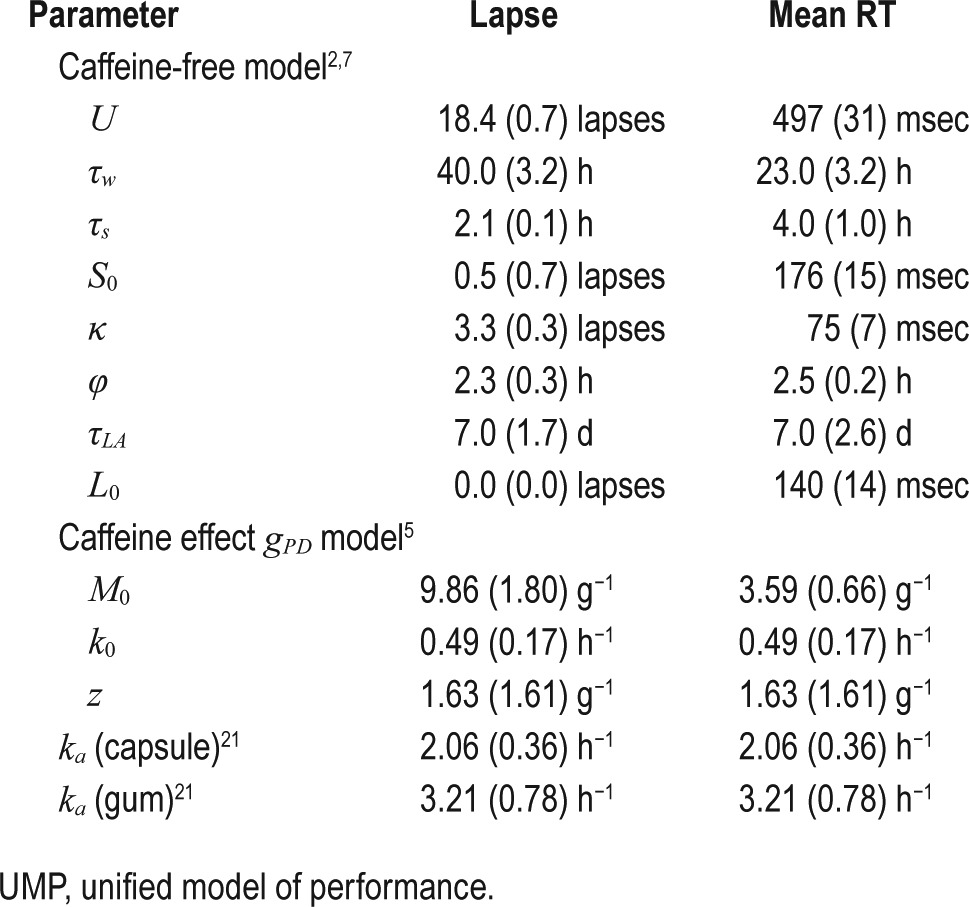
The original UMP consists of eight parameters (henceforth referred to as the caffeine-free model parameters): (1) U, the upper asymptote of the homeostatic process S; (2) τw, the time constant of increasing homeostatic pressure during wake time; (3) τs, the time constant of decreasing homeostatic pressure during sleep; (4) S0, the initial state value for process S; (5) κ, the amplitude of the circadian process C; (6) φ, the circadian phase; (7) τLA, the time constant accounting for the exponential rise and fall of sleep debt (via modulation of the lower asymptote L) as a function of sleep/wake history; and (8) L0, the initial state value of L. The first six parameters originate from the Borbely two-process model,20 whereas the last two parameters account for the effects of sleep debt.2,7
The caffeine-effect factor gPD(t,c) consists of four parameters: (1) M0, the amplitude slope that governs the magnitude of the effect of caffeine dose c; (2) k0, the basal elimination rate that governs the duration of caffeine effect over time t; (3) z, the decay constant that governs the effect of dose c on the duration of caffeine effects; and (4) ka, the absorption rate of caffeine.5 To investigate the temporal change of the caffeine-effect factor g PD(t,c) in Equation 6a, and its sensitivity to changes to the four g PD model parameters (M0, k0, z, and ka), we computed gPD(t,c) for study V3 (study condition 6 in Table 1) while varying the model parameters ± 20% from their nominal values discussed in the following paragraph.
Estimation of the UMP Parameters
First, for lapse statistic, we used the parameters described by Ramakrishnan et al.2 For mean RT statistic, we obtained the eight caffeine-free model parameters by fitting the original UMP to the mean RT data from study T1.9 Next, we obtained the gPD parameters using PVT data from study T2 by following the procedure described by Ramakrishnan et al.5 Here, we fixed ka to 2.06 h−1 and 3.21 h−1 for caffeine administered as capsule and chewing gum, respectively, to reflect the formulation-dependent rate of absorption.21 We repeated this step twice to separately obtain the gPD model parameters for lapse and mean RT statistics.
Data Normalization
We obtained the UMP parameters from studies T1 and T2, which used 10-min PVTs. However, four of the validation studies (V2, V3, V5, and V6) assessed performance using 5-min PVTs. Because both PVT lapses and mean RT statistics are affected by time on task (showing greater impairment for longer PVTs, with the effect exacerbating with increasing sleep debt), we normalized the PVT data in these four studies to obtain equivalent 10-min PVT data via an affine transformation, f(x) = μx + b.22 To obtain the affine transformation parameters (μ, b), we used data from the first 44 h of TSD from study V6 (5-min PVT) and study V7 (10-min PVT). Specifically (and separately for lapses and mean RT), we obtained the transformation parameters by minimizing the discrepancy between the 10-min PVT data in study V7 and the transformed 5-min PVT data in study V6.
UMP Predictions
To predict group-average performance Pc(t) (i.e., lapses and mean RT) in Equation 1, for each of the 14 validation conditions in Table 1, we input only the corresponding sleep schedule and, if consumed, caffeine intake times and dosages into the UMP. A review of the inclusion/exclusion criteria for studies V1–V7 revealed that the study subjects were similar to those in studies T1 and T2 in terms of sleep habits, health, age, etc. Accordingly, we assumed that the entrained circadian phase φ of each group of subjects was identical across all studies. Because information about baseline sleep duration was not available in studies V2 and V3, we assumed that subjects had negligible sleep debt at the start of these field studies.13,14
In the datasets utilized in this work, we observed that PVT performance on the first day of TSD/CSR differed across studies, despite subjects having undergone similar sleep schedules during the baseline phase. This could be due to several factors, such as differences in the actual time asleep for a given TIB, between-study differences in cognitive workload (e.g., frequency of PVTs, type of PVT instantiation, number and frequency of other performance tests), and differential effects of seasonal variations in moods on subjects' performances. To account for these differences, and to effectively normalize performance data across studies, we added a constant value δ to the UMP-predicted output Pc(t) for each study condition, where δ was computed as the difference between the average measured PVT performance and the average predicted performance Pc(t) on the first day of TSD/CSR in studies V1, V2, V3, V6, and V7 and before caffeine consumption in studies V4 and V5.2
Prediction Intervals
For each of the UMP predictions Pc(t), we also computed the corresponding prediction intervals (PIs) as follows:
where α represents the significance level, zα/2 represents the percentage point of a standard normal distribution with a α/2 proportion above it, σ2p denotes the variability in the UMP output due to the standard errors of the parameters, and σ2m denotes the estimate of the noise-level variance in the PVT data, which was estimated from the error in fitting the UMP to the study T1 data.23 We assumed that the PVT noise characteristics were similar across all studies. To compute the 95% PIs, we set α to 0.05.
Goodness of Fit
To assess the goodness of fit of the predictions in studies V1– V7, for each of the 14 conditions in Table 1, we calculated the root mean squared errors (RMSEs) of the UMP predictions P 0(t) and Pc(t) against the corresponding group-average PVT performance data without and with caffeine, respectively, for both lapses and mean RT statistics. The UMP reduces to the original (caffeine-free) UMP under caffeine-free/placebo conditions. In other words, P0(t) is equivalent to Pc(t) for c = 0 mg. For study conditions without caffeine (odd-numbered in Table 1), we computed the RMSEs of P0(t) throughout wakefulness, and for study conditions with caffeine (even-numbered in Table 1), we computed the RMSEs of Pc(t) during wakefulness after the first caffeine dose. In addition, to quantify the benefit of accounting for caffeine effects in the UMP over the original (caffeine-free) UMP, for each of the even-numbered study conditions in Table 1, we compared the RMSEs of the two models, where the RMSE was computed over the time period following the first caffeine dose. To more extensively quantify the quality of the model predictions across the initial and later stages of the studies, for study conditions without caffeine, we computed two additional RMSEs: (1) RMSE1, for the time period used to compute δ, i.e., for the first day of TSD/CSR in studies V1, V2, V3, V6, and V7 and before caffeine consumption in studies V4 and V5 and (2) RMSEr, for the remaining days of TSD/CSR.
RESULTS
Estimated UMP Parameters
Table 3 lists the estimates of the eight caffeine-free and the four g PD model parameters (and their corresponding standard errors) of the UMP that were used to predict PVT lapses and mean RT in studies V1–V7. Figure S1 in the supplemental material shows results of the sensitivity analysis of the caffeine-effect factor, showing the temporal changes of gPD(t,c) for a ± 20% variation in the gPD model parameters. We observed that gPD(t,c) was not very sensitive to changes in the model parameters.
Table 3.
UMP parameters (standard errors) for both lapse and mean response time (RT) statistics.
Data Normalization Parameters
By minimizing the discrepancy between the 10-min PVT data in study V7 and the transformed 5-min PVT data in study V6, we obtained the following affine transformation parameters: μ = 2.99 and b = 2.89 lapses for lapse statistic and μ = 1.62 and b = –60.18 msec for mean RT statistic.
Validation of the UMP Predictions on Studies V1–V7
We used the UMP parameters listed in Table 3 to predict both lapse and mean RT group-average performance in the 14 different sleep and caffeine conditions of studies V1–V7 in Table 1, and validated them by comparing against the measured PVT data. In the subsequent figures, we show, for each validation study: (1) PVT data from both placebo and caffeine conditions, (2) caffeine-free model predictions P0, and (3) UMP predictions Pc, along with their corresponding 95% PI ranges after the first caffeine dose. Table 4 lists the RMSEs of UMP (Pc) and caffeine-free model (P0) predictions under each study condition for both lapses and mean RT.
Table 4.
Root mean squared errors of UMP (Pc) and caffeine-free model (P0) predictions across all study conditions for both lapses and mean response time (RT) statistics.
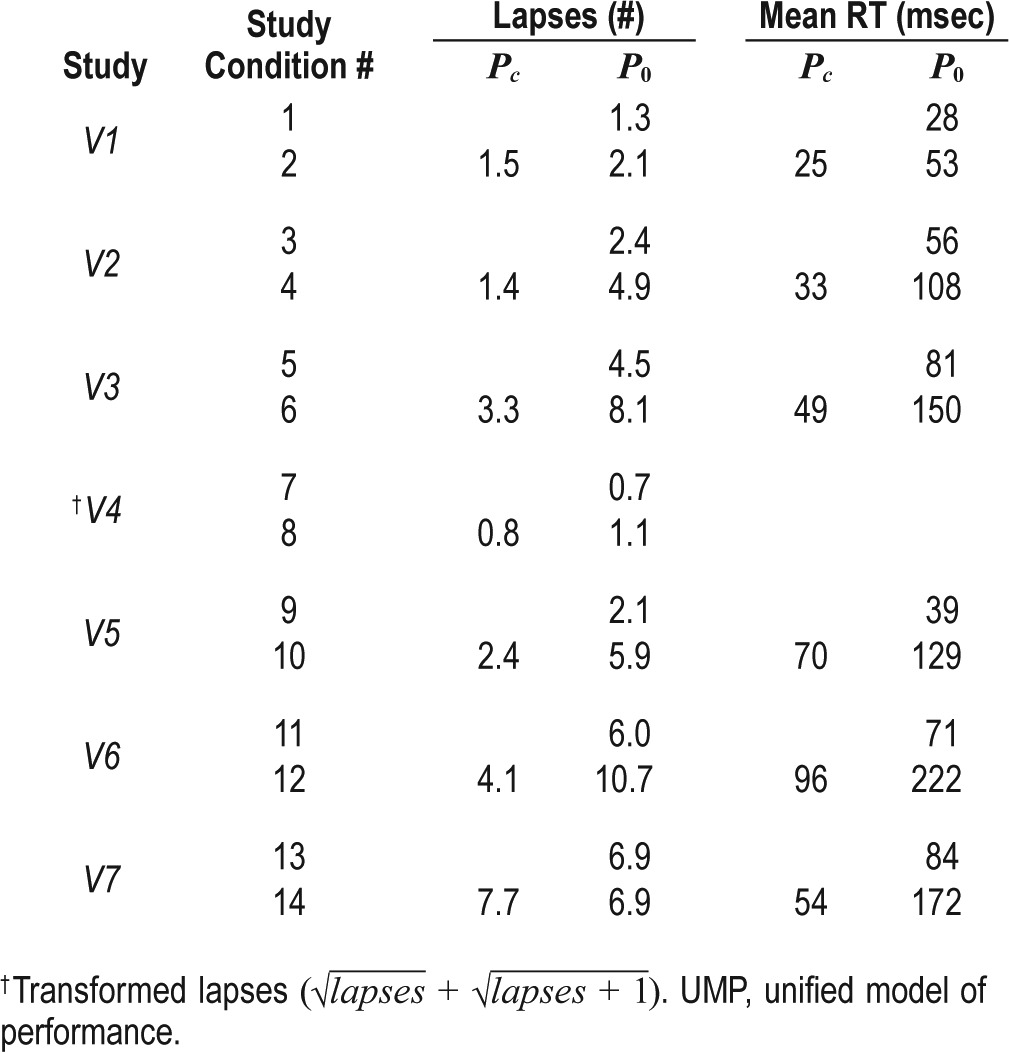
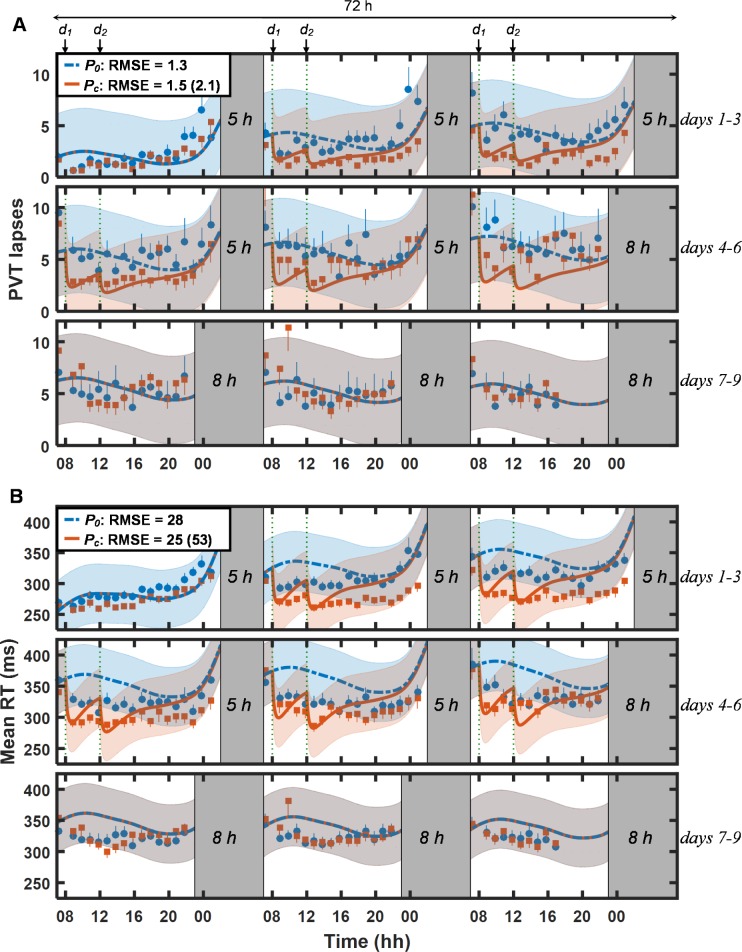
Figure 1 shows PVT data (lapses [Figure 1A] and mean RT [Figure 1B]) and UMP predictions for study V1 (study conditions 1 and 2 in Table 1). For lapses, the UMP accurately predicted the effects of placebo (P0, dashed blue lines) and caffeine (Pc, solid red lines) across CSR and recovery, yielding overall RMSEs of 1.3 lapses for the placebo condition and 1.5 lapses for the caffeine condition. (The only exception was the prediction of caffeine effects on day 6: the UMP predicted fewer lapses than were observed.) For mean RT, the UMP predictions were accurate for the caffeine condition (RMSE = 25 msec), but less accurate for the placebo condition (RMSE = 28 msec), especially on days 2–6, when the model overpredicted impairment. For both lapses and mean RT, the UMP predicted caffeine effects more accurately immediately after caffeine consumption than later, a trend that was most salient on days 5 and 6. Importantly, accounting for the effects of caffeine in the UMP significantly improved model predictions after caffeine consumption. Relative to the caffeine-free model (P0), the UMP predictions (Pc) yielded RMSEs that were 29% smaller for lapses (1.5 vs. 2.1 lapses) and 53% smaller for mean RT (25 vs. 53 msec). With a few exceptions, the 95% PIs of the Pc predictions encompassed the measured PVT data. Compared to the other validation studies, the PI range for study V1 was particularly wide and included the placebo data because the average difference between the placebo and caffeine PVT data was relatively small (2.2 lapses and 28 msec for mean RT) and almost equivalent to the estimated noise in the measured data (2.1 lapses and 24 msec for mean RT).
Figure 1.
Group-averaged and standard errors of psychomotor vigilance task (PVT) lapse data (A) and mean response time (RT) data (B), along with unified model of performance (UMP) predictions on baseline (day 1), chronic sleep restriction (CSR; days 2–6), and recovery (days 7–9) phases in study V1.11 The solid blue circles and thick blue dash-dotted lines correspond to the measured data and caffeine-free UMP predictions (P0), respectively, for the placebo condition (study condition 1; Table 1). The solid red squares and thick red lines correspond to the measured data and UMP predictions (Pc), respectively, for the caffeine condition (study condition 2; Table 1). The gray-shaded vertical bars represent sleep episodes. Thin dotted vertical lines denote caffeine intake (d1 = 200 mg and d2 = 200 mg). The blue and red shaded regions correspond to the 95% prediction interval ranges, respectively, for P0 and Pc (after the first caffeine dose). Also shown are root mean squared errors (RMSEs) between measured data and UMP predictions. (Numbers within parentheses correspond to the RMSEs that result when the UMP does not account for the effects of caffeine.) For lapses, δ = –0.1 lapses, RMSE1 = 1.5 lapses, and RMSEr = 1.3 lapses. For mean RT, δ = 56 msec, RMSE1 = 15 msec, and RMSEr = 30 msec. (See Methods for description of δ, RMSE1, and RMSEr.)
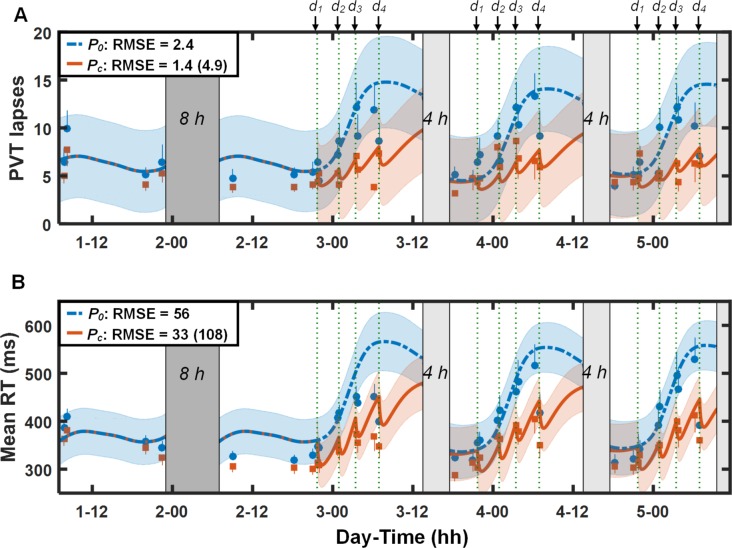
Figure 2 illustrates PVT data and predictions for study V2 (study conditions 3 and 4 in Table 1). For both lapses (Figure 2A) and mean RT (Figure 2B), except for mean RT immediately following the fourth caffeine dose on each day, the UMP accurately predicted the effects of daytime sleep and repeated doses of 200 mg of caffeine, with the 95% PI ranges encompassing almost all PVT data after caffeine intake. However, the UMP overpredicted performance impairment on the first three PVT sessions on day 2: the improved PVT performance in these sessions may be due to alerting effects derived from obstacle course and training exercises that preceded these PVT sessions.12,13 By accounting for caffeine effects, the UMP (Pc) yielded a RMSE of 1.4 lapses (33 msec for mean RT) in contrast to 4.9 lapses (108 msec for mean RT) for the caffeine-free model predictions (P0) after the first caffeine dose. (Table S1 in the supplemental material provides a quantitative assessment of the UMP accuracy in predicting individual data from this study.)
Figure 2.
Group-averaged and standard errors of psychomotor vigilance task (PVT) lapse data (A) and mean response time (RT) data (B), along with unified model of performance (UMP) predictions for study conditions 3 and 4 (Table 1) in study V2.13 Thin dotted vertical lines denote caffeine intake (d1 = 200 mg, d2 = 200 mg, d3 = 200 mg, and d4 = 200 mg). Other descriptors are identical to those in Figure 1. For lapses, δ = 2.8 lapses, RMSE1 = 1.6 lapses, and RMSEr = 2.5 lapses. For mean RT, δ = 107 msec, RMSE1 = 25 msec, and RMSEr = 59 msec.
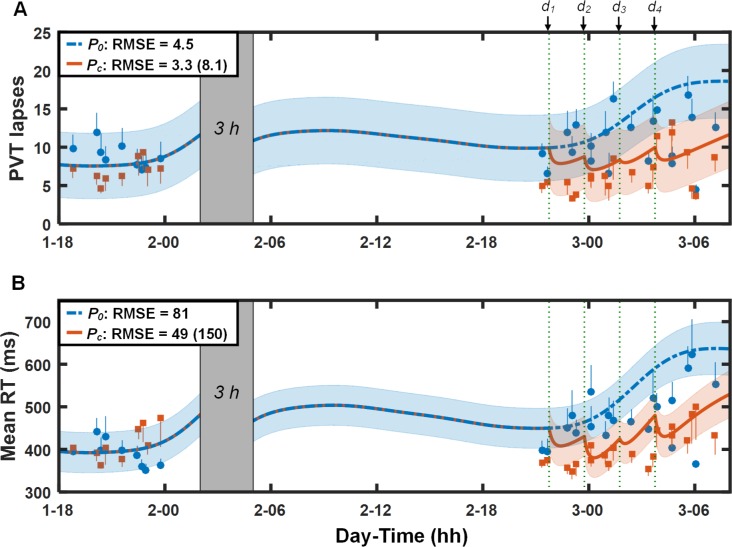
Figure 3 shows the PVT data and predictions (lapses [Figure 3A] and mean RT [Figure 3B]) for study V3 (study conditions 5 and 6 in Table 1). The UMP accurately predicted the effects of sleep loss and the 100 and 200 mg doses of caffeine administered during TSD, with the 95% PI ranges again encompassing most of the PVT data after caffeine intake. The RMSEs for the placebo and caffeine predictions were 4.5 lapses (81 msec for mean RT) and 3.3 lapses (49 msec for mean RT), respectively. By accounting for the effects of caffeine, the UMP provided a ∼60% improvement over the caffeine-free model predictions after caffeine consumption (RMSEs = 8.1 lapses and 150 msec for mean RT).
Figure 3.
Group-averaged and standard errors of psychomotor vigilance task (PVT) lapse data (A) and mean response time (RT) data (B), along with unified model of performance (UMP) predictions for study conditions 5 and 6 (Table 1) in study V3.14 Thin dotted vertical lines denote caffeine intake (d1 = 100 mg, d2 = 200 mg, d3 = 100 mg, and d4 = 200 mg). Other descriptors are identical to those in Figure 1. For lapses, δ = 4.9 lapses, RMSE1 = 1.9 lapses, and RMSEr = 5.5 lapses. For mean RT, δ = 142 msec, RMSE1 = 43 msec, and RMSEr = 98 msec.
Figure 4 illustrates PVT data and predictions for study V4 (study conditions 7 and 8 in Table 1). Because the lapse data in this study were transformed (), we accordingly transformed the UMP predictions and corresponding PIs. The UMP accurately predicted the effects of 40 h of TSD and the two 200 mg caffeine doses, yielding RMSEs of 0.7 and 0.8 transformed lapses, respectively, (equivalent to 1.9 and 3.1 nontransformed lapses) for the placebo and caffeine conditions. In the PVT data, we observed that the effect of 200 mg of caffeine was more prominent after 23 h of wakefulness than after 11 h (maximum difference between measured data without and with caffeine of 2.5 transformed lapses after 23 h vs. 0.6 transformed lapses after 11 h). This was consistent with UMP predictions, in which the beneficial effect of caffeine was 2.1 transformed lapses after 23 h of wakefulness and 0.9 transformed lapses after 11 h.
Figure 4.
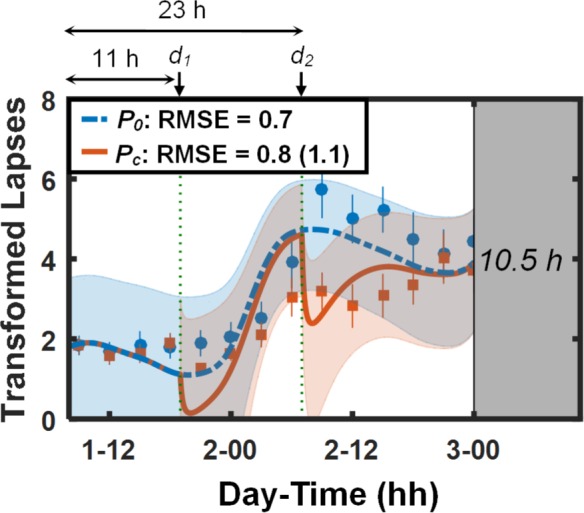
Group-averaged and standard errors of transformed psychomotor vigilance task (PVT) lapse () data, along with unified model of performance (UMP) predictions for study conditions 7 and 8 (Table 1) in study V4.8,15 Thin dotted vertical lines denote caffeine intake (d1 = 200 mg and d2 = 200 mg). Other descriptors are identical to those in Figure 1. δ = −2.3 lapses, RMSE1 = 0.2 lapses, and RMSEr = 0.7 lapses.
Figure 5 shows PVT data and predictions (lapses [Figure 5A] and mean RT [Figure 5B]) for study V5 (study conditions 9 and 10 in Table 1). Except for the last two PVT measurements after the last caffeine dose, the UMP accurately predicted the effects of the 28-h TSD and the 400 and 100 mg caffeine doses, yielding RMSEs of 2.1 lapses (39 msec for mean RT) for the placebo condition and 2.4 lapses (70 msec for mean RT) for the caffeine condition. (The subjects in this study performed an exercise task involving a run to exhaustion on a treadmill immediately prior to the penultimate PVT session. Alerting effects of this exercise may explain the relatively improved PVT performance on the last two PVT sessions despite the prior night of sleep deprivation.) By accounting for the effects of caffeine, the UMP yielded a 59% prediction improvement in lapses (2.4 vs. 5.9 lapses) and a 46% prediction improvement in mean RT (70 vs. 129 msec) compared to the caffeine-free model.
Figure 5.
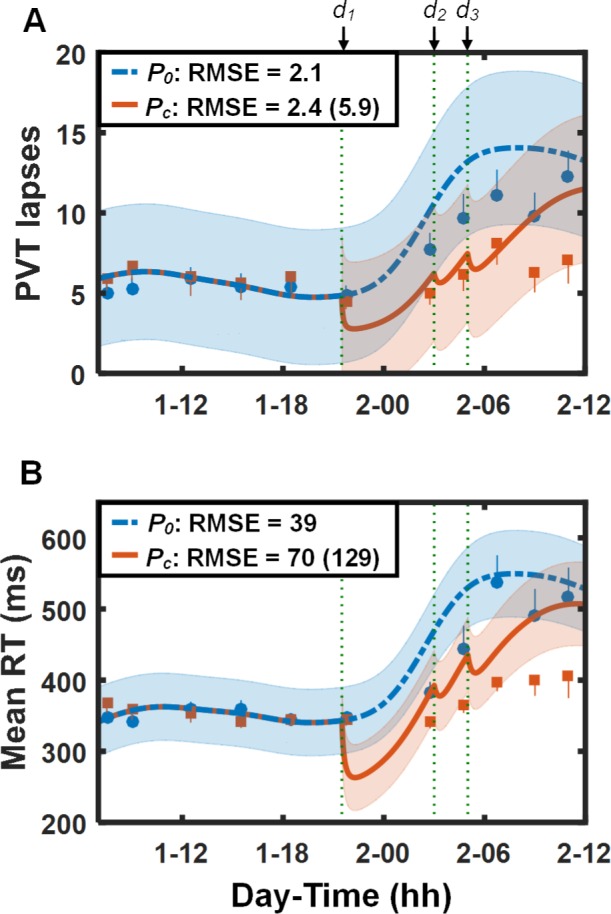
Group-averaged and standard errors of psychomotor vigilance task (PVT) lapse data (A) and mean response time (RT) data (B), along with unified model of performance (UMP) predictions for study conditions 9 and 10 (Table 1) in study V5.16 Thin dotted vertical lines denote caffeine intake (d1 = 400 mg, d2 = 100 mg, and d3 = 100 mg). Other descriptors are identical to those in Figure 1. For lapses, δ = 2.1 lapses, RMSE1 = 0.7 lapses, and RMSEr = 2.7 lapses. For mean RT, δ = 90 msec, RMSE1 = 7 msec, and RMSEr = 52 msec.
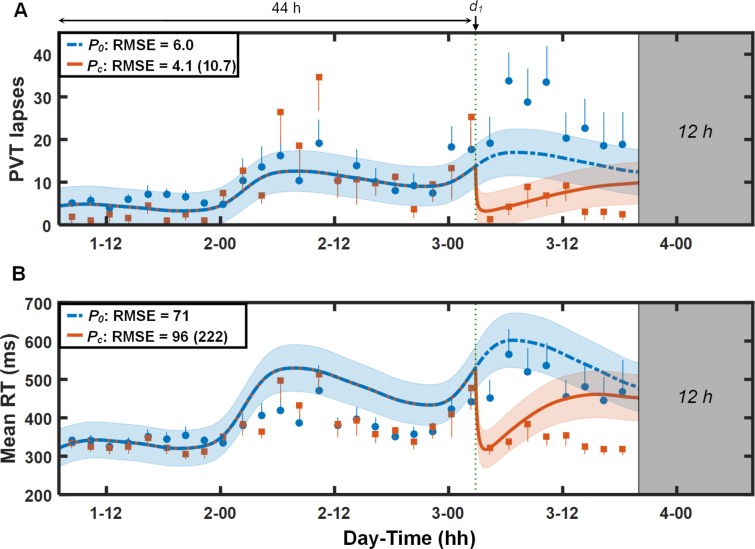
Figure 6 shows the results for study V6 (study conditions 11 and 12 in Table 1). For lapses (Figure 6A), the UMP predictions were accurate for both the first 44 h of TSD (before caffeine consumption) and following administration of 600 mg of caffeine. However, the caffeine-free model underpredicted impairment resulting from sleep loss on day 3 (i.e., fewer predicted than observed lapses). For mean RT (Figure 6B), the UMP overpredicted impairment on days 2 and 3, but accurately predicted the effects of the 600 mg of caffeine for the first 6 h after caffeine consumption. Nevertheless, for both lapses and mean RT, accounting for the effects of caffeine in the UMP resulted in > 57% prediction improvements over the caffeine-free model.
Figure 6.
Group-averaged and standard errors of psychomotor vigilance task (PVT) lapse data (A) and mean response time (RT) data (B), along with unified model of performance (UMP) predictions for study conditions 11 and 12 (Table 1) in study V6.17 Thin dotted vertical line denotes caffeine intake (d1 = 600 mg). Other descriptors are identical to those in Figure 1. For lapses, δ = 0.6 lapses, RMSE1 = 2.2 lapses, and RMSEr = 7.1 lapses. For mean RT, δ = 70 msec, RMSE1 = 18 msec, and RMSEr = 84 msec.
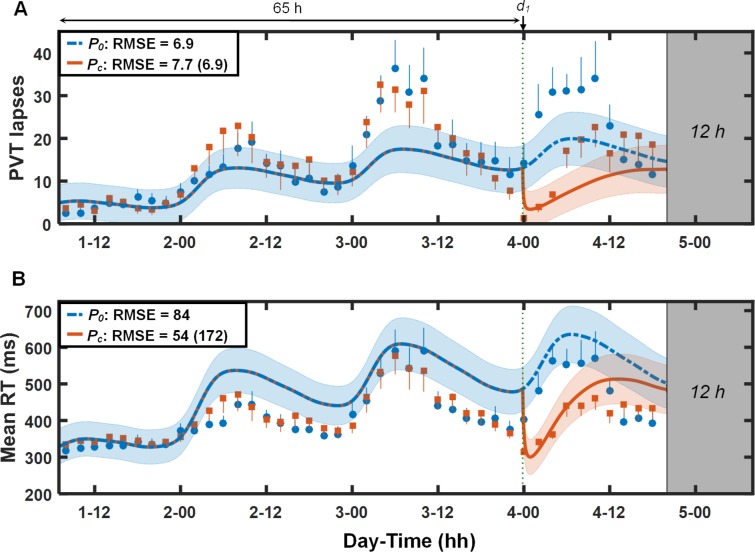
Figure 7 shows the results for study V7 (study conditions 13 and 14 in Table 1). Although, qualitatively, the UMP accurately tracked performance trends during the first 65 h of TSD, quantitatively, it underpredicted lapses for the first 12 h on day 3 and overpredicted mean RT for the second halves of days 2 and 3. However, for both PVT statistics, the UMP accurately predicted the immediate effects of 600 mg of caffeine, with the 95% PI ranges encompassing almost all of the PVT data after caffeine intake for mean RT. Here, the UMP showed benefits of accounting for caffeine effects for mean RT (68% improvement), but not so for lapses.
Figure 7.
Group-averaged and standard errors of psychomotor vigilance task (PVT) lapse data (A) and mean response time (RT) data (B), along with unified model of performance (UMP) predictions for study conditions 13 and 14 (Table 1) in study V7.18 Thin dotted vertical line denotes caffeine intake (d1 = 600 mg). Other descriptors are identical to those in Figure 1. For lapses, δ = 1.1 lapses, RMSE1 = 1.9 lapses, and RMSEr = 7.7 lapses. For mean RT, δ = 77 msec, RMSE1 = 15 msec, and RMSEr = 94 msec.
UMP Simulations
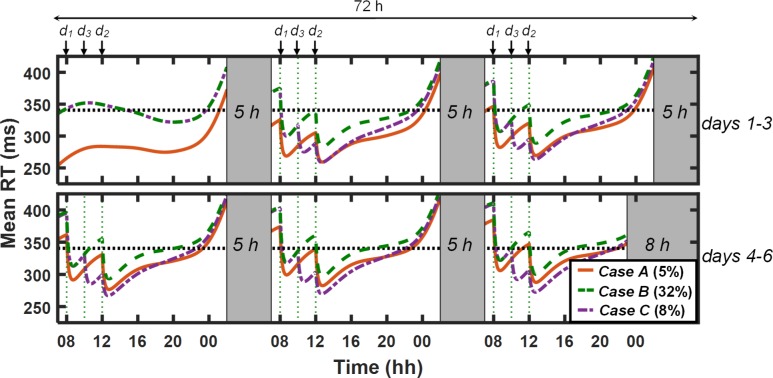
After validating the UMP predictions, we used the model to investigate (via simulations) the effects of prior sleep history and caffeine in study V1 (study condition 2 in Table 1). In particular, we assessed the benefit of sleep extension (10 h TIB/night) for 5 nights during baseline (case A) over habitual sleep (7 h TIB/night) for 5 nights (case B) on performance during 5 nights of sleep restriction (5 h TIB/night) with 200 mg of caffeine administered at 08:00 and 12:00 on days 2–6. Subsequently, we simulated a third scenario wherein we modified case B by administering an additional dose of 200 mg of caffeine at 10:00 on days 2–6 (case C) to determine whether this would better counteract the effects of relatively reduced sleep during the 5 baseline nights that differentiated case B from case A. For these investigations, we computed the percentage of time performance exceeded 20% of a maximum basal level, which we defined as the maximum value of the mean RT statistic (i.e., “worst” performance) between 07:00 and 23:00 on day 1 in study V1.
Figure 8 shows the UMP-predicted mean RT performance for the three cases. For case A (original study condition 2 in Table 1), the UMP predicted that, by and large, performance would be maintained within the maximum basal level (horizontal dotted line; 340 msec) across days 2–6 during wakefulness: performance exceeded the maximum basal level for only 5% of the time. For case B, however, performance was sufficiently impaired (relative to case A), exceeding the maximum basal level for 32% of the time, most notably from 07:00 to 08:00 and from 10:00 to 12:00 on days 4–6. With the administration of an additional 200 mg caffeine dose at 10:00 (d3 in Figure 8) in case C, the UMP predicted that performance would be improved almost to the levels observed in case A, with performance exceeding the maximum basal level for only 8% of the time. These results support the established finding that 3 h of additional sleep per night during baseline significantly improves performance during subsequent CSR. Interestingly, these simulations also suggest that 200 mg of caffeine in each of the 5 days during CSR can elicit equivalent performance benefits as those observed due to 3 h of additional sleep per night during the 5 nights immediately preceding sleep loss—a prediction that warrants further investigation because, as a practical matter, sleep extension is more logistically challenging than caffeine administration in most operational environments.
Figure 8.
Unified model of performance (UMP) simulations for baseline (day 1) and chronic sleep restriction (CSR; days 2–6) phases for study condition 2 (Table 1) in study V1.11 The red solid, green dashed, and purple dash-dotted lines represent the simulations of case A (10-h sleep/night on baseline nights), case B (7-h sleep/night on baseline nights), and case C (7-h sleep/night on baseline nights and additional 200 mg of caffeine on days 2–6), respectively. (UMP predictions for cases B and C are superimposed on day 1.) The dotted black horizontal line corresponds to maximum basal level (20% beyond the maximum impairment on day 1 under case A). Gray-shaded vertical bars represent sleep episodes. Thin dotted vertical lines denote caffeine intake (d1 = 200 mg, d2 = 200 mg, and d3 = 200 mg). Percentage values within parentheses indicate the fraction of time for which UMP predictions exceed maximum basal level. RT, response time.
DISCUSSION
To be most useful in both military and civilian operations, mathematical models for predicting the effects of sleep loss on human neurobehavioral performance must account for the alertness- and performance-enhancing effects of caffeine. Here, we attempted to accomplish this by integrating a validated, caffeine-free model (i.e., the original UMP, which has been shown to provide accurate predictions of group-average performance across numerous studies spanning the continuum of sleep loss2) with a model of caffeine effects, which had been partially validated using data from acute sleep deprivation studies.4,5 Together, this single, unified mathematical modeling framework, the UMP, can generate PVT performance predictions as a function of combination of sleep/wake schedules and caffeine doses.
To investigate the accuracy of the UMP predictions, we used it to forecast group-average performance in 14 distinct combinations of sleep-loss and caffeine-dose conditions (Table 1), using both PVT lapse data and mean RT data. In addition, we showed how the UMP can be used to perform simulations and generate testable hypotheses on the effects of specific sleep/ wake schedules and caffeine administration regiments on PVT performance.
Overall, across all studies, the UMP accurately predicted PVT performance trends for both placebo and caffeine conditions. Quantitatively, in absolute terms, the UMP prediction accuracy was higher (i.e., smaller RMSEs) for studies that did not include severe TSD (studies V1, V2, and V5, with < 33 h of TSD). For these studies, the RMSEs were similar between placebo and caffeine conditions, ranging from 1.3 to 2.4 lapses (28 to 56 msec mean RT) for placebo conditions and from 1.4 to 2.4 lapses (25 to 70 msec mean RT) following caffeine consumption (see Table 4). For studies involving ≥ 33 h of TSD (studies V3, V4, V6, and V7), the UMP occasionally underpredicted lapses and overpredicted mean RT in studies V6 and V7, leading to absolute RMSEs ranging from 1.9 to 6.9 lapses (71 to 84 msec mean RT) for placebo conditions and from 3.1 to 7.7 lapses (49 to 96 msec mean RT) following caffeine consumption. However, by accounting for the effects of caffeine, the UMP, across all studies, substantially improved prediction accuracy in both PVT lapses (by 29% to 71%) and PVT mean RT (by 46% to 69%) relative to the original, caffeine-free version of the UMP. Importantly, the measured PVT data after caffeine consumption generally fell within the UMP-predicted 95% PI values in all studies.
Because performance impairment increases with longer TSD, leading to a larger dynamic range of PVT performance, we also computed the relative error for each study, defined as the RMSE of a study divided by the maximum impairment level within that study. Using these relative terms, the UMP prediction accuracy was very similar across all studies for both placebo and caffeine conditions. For example, for studies involving mild to moderate TSD (< 33 h of continuous wakefulness), the relative error for lapses ranged from 11% to 20% (6% to 13% for mean RT), and for studies involving severe TSD (≥ 33 h of continuous wakefulness), the relative error for lapses ranged from 12% to 27% (8% to 17% for mean RT).
By and large, the UMP produced comparably accurate performance predictions for both PVT statistics across the studied conditions. This suggests that the structure of the model (i.e., the underlying mathematical equations of the UMP) is sufficiently robust to capture the temporal profiles of both lapses and mean RT—with or without caffeine—despite the previously observed nonlinear relationship and differences between these two PVT statistics.24 However, we did observe similar discrepancies in one study condition: in the early morning hours after extended sleep loss without caffeine consumption, e.g., day 3 in study V6 (Figure 6) and days 3 and 4 in study V7 (Figure 7), when the UMP underpredicted lapses and over-predicted mean RT. We believe that this discrepancy is perhaps due to the amplification of the differences between these two PVT statistics during early morning hours with increasing sleep loss, as shown before in the study by Rajaraman et al.24 It is possible that the model does not currently possess the necessary degrees of freedom to simultaneously account for differential rates of change in performance in these two statistics under this one condition.
We also observed that the UMP occasionally overpredicted circadian trends in mean RT data, both within and across days, especially under TSD conditions in studies V6 (day 2, Figure 6B) and V7 (days 2–3, Figure 7B). In the UMP, the upper asymptote of the homeostatic process U is held constant. In contrast, the lower asymptote L increases or decreases with increasing or decreasing sleep debt, respectively. However, it may be possible that similarly representing U as a monotonic function of sleep debt could simultaneously account for the increased impairments during higher sleep debts and decreased impairments during lower sleep debts, thereby better capturing the circadian trends under both lower and higher sleep debt levels within and across days.2 Alternately, the circadian amplitude could be modulated by the extant sleep debt to account for these observed discrepancies.25 Nevertheless, given that the UMP produced reasonably accurate predictions (relative RMSE < 20%) for the majority of the more operationally relevant conditions of mild and moderate sleep loss, both with and without caffeine, it is not clear whether this finding warrants development of structurally different models for the two PVT statistics.
We also observed noticeable differences in the duration of caffeine effects in PVT data (which were not predicted by the UMP) for studies V6 and V7, in which a single 600 mg of caffeine was administered after 44 h of TSD (study V6, Figure 6) and after 65 h of TSD (study V7, Figure 7), respectively. Although caffeine was administered at approximately the same time of day in both studies, with indistinguishable observed effects and extremely accurate predictions immediately after caffeine consumption (during the subsequent ∼4 h), the duration of effects was significantly longer in study V6 than in study V7. This suggests that the duration of the beneficial effects of caffeine diminishes with increasing sleep debt. Interestingly, we observed a similar trend in the study V1 data (Figure 1), in which the two 200-mg caffeine doses improved performance for a longer duration on days 2–4 (> 37% improvement over placebo lapse data on each day) than on days 5 and 6 (< 16% improvement over placebo lapse data on each day). In the UMP, the duration of caffeine effect on performance is a function of the caffeine dose, but not the extant sleep debt level. However, before we modify the model to account for putative influence of sleep debt level on duration of caffeine effects, we ought to confirm this potentially new insight in additional studies in which varying doses of caffeine are administered at different levels of sleep debt.
After validating the UMP, we used the model to perform simulations and quantitatively compare and contrast the performance-enhancing effects of sleep extension prior to sleep loss versus those achieved through caffeine consumption. In particular, we compared the relative benefits derived from 5 consecutive nights of sleep extension (i.e., 10-h TIB versus 7-h TIB) over a subsequent period of CSR (5 consecutive nights with 5-h TIB as in study V1 [Table 1, study condition 2]), and assessed whether additional daily doses of caffeine during CSR could achieve equivalent performance benefits. UMP simulations suggested that a 10-h sleep extension helped maintain performance during CSR within 20% of the maximum basal performance for 95% of the time versus 68% of the time for 7-h TIB prior to sleep loss (Figure 8). Interestingly, an additional 200-mg daily dose of caffeine at 10:00 during CSR offered almost equivalent benefits (92%) as those observed with a 10-h sleep extension. In contrast, a 100-mg daily dose of caffeine at 10:00 maintained performance for only 85% of the time, whereas a 200-mg dose at 14:00 maintained performance for 84% of the time. These simulations demonstrate how the UMP can be used to investigate trade-offs between sleep and caffeine, and generate hypotheses that can be experimentally tested.
The UMP was developed using PVT data. Consequently, the extent to which its predictions generalize to other aspects of neurobehavioral performance is not known. For example, an individual's relative performance level on the PVT does not necessarily reflect that individual's performance level on other neurocognitive tasks (e.g., mathematical processing, running memory, and visual analog scale of fatigue).26,27 Also, the effects of caffeine on higher-order complex cognitive capacities (e.g., planning, decision making, and memory) appear to be mixed, suggesting different degrees of performance restoration depending on the particular task in question and caffeine dose amount.18,28,29
Another potential limitation is that the UMP does not account for chronic caffeine use or withdrawal effects. In other words, it is possible that habitually high caffeine users may require a larger caffeine dose to experience the same benefits as compared to habitually low caffeine users, and may show significant performance impairments due to withdrawal. However, results from experimental studies on the influence of habitual caffeine consumption and withdrawal effects on neurobehavioral performance have been inconclusive, appearing to be task dependent.30,31 For example, Hewlett and Smith31 found that the dependence of caffeine effects on habitual caffeine users vary with task complexity. That is, the caffeine effect is unrelated to habitual use for simple tasks, such as the simple reaction time task, but it is related to habitual use for more complex tasks, such as the choice reaction time task. Interestingly, none of the tasks appeared to be affected by withdrawal in either group of caffeine users. Therefore, although chronic caffeine use could limit the generalizability of the UMP to more complex tasks, it is unlikely to affect predictions of PVT performance, because the PVT is a simple reaction time task.
The UMP assumes that caffeine is eliminated from the body at the same rate during both wakefulness and sleep, and that its effects on performance dissipate in a similar manner, regardless of sleep/wake state. We could not fully assess certain aspects of this assumption and, for example, determine the extent to which the UMP accurately predicts postsleep performance for scenarios in which caffeine is consumed immediately prior to sleep. In all studies considered (except for study V2), caffeine was consumed at least 14 h prior to sleep, by which time most of the caffeine had presumably been eliminated from the body. (Elimination half-life of caffeine typically ranges from 4.7–6.4 h for doses of 150–600 mg.32) In study V2, 4-h sleep periods were scheduled 6.5 h after the last of four 200 mg doses of caffeine on days 3 and 4; however, the first postsleep PVT test was not administered until 11.5 h after the last caffeine consumption. Finally, it should be noted that our studies involved a homogenous population of young, healthy adults, and the extent to which the current findings can be extrapolated to a heterogeneous, older population is yet to be determined.
In summary, this work provides the first mathematical model to predict human reaction-time performance across a wide range of sleep schedules and caffeine doses, under both laboratory and field conditions. Although not perfect, this unique capability can form the basis of a tool to help design sleep schedules and caffeine countermeasure strategies to optimize performance. Therefore, and as a next step, we seek to instantiate the UMP into two applications: (1) a smartphone app to provide individual-specific performance predictions based on that individual's sleep/wake schedule, caffeine consumption, and PVT data; and (2) a Web-based tool to provide group-average performance predictions for mission- or work-schedule planning.
DISCLOSURE STATEMENT
This was not an industry-supported study. This work was sponsored by the Military Operational Medicine Research Area Directorate of the U.S. Army Medical Research and Materiel Command, Ft. Detrick, MD, and by the US Department of Defense Medical Research and Development Program (Grant No. DMRDP_13200). The authors have indicated no financial conflicts of interest. The opinions and assertions contained herein are the private views of the authors and are not to be construed as official or as reflecting the views of the US Army or of the US Department of Defense. This paper has been approved for public release with unlimited distribution.
ACKNOWLEDGMENTS
The authors thank all of the volunteers who participated in the studies and all the researchers and technicians responsible for conducting the studies.
ABBREVIATIONS
- CSR
chronic sleep restriction
- PD
pharmacokinetics
- PI
prediction interval
- PK
pharmacodynamics
- PVT
psychomotor vigilance task
- RMSE
root mean squared error
- RT
response time
- TIB
time in bed
- TSD
total sleep deprivation
- UMP
unified model of performance
- US
United States
REFERENCES
- 1.McCauley P, Kalachev LV, Mollicone DJ, Banks S, Dinges DF, Van Dongen HP. Dynamic circadian modulation in a biomathematical model for the effects of sleep and sleep loss on waking neurobehavioral performance. Sleep. 2013;36:1987–97. doi: 10.5665/sleep.3246. [DOI] [PMC free article] [PubMed] [Google Scholar]
- 2.Ramakrishnan S, Wesensten NJ, Balkin TJ, Reifman J. A unified model of performance: validation of its predictions across different sleep/wake schedules. Sleep. 2016;39:249–62. doi: 10.5665/sleep.5358. [DOI] [PMC free article] [PubMed] [Google Scholar]
- 3.Benitez PL, Kamimori GH, Balkin TJ, Greene A, Johnson ML. Modeling fatigue over sleep deprivation, circadian rhythm, and caffeine with a minimal performance inhibitor model. Methods Enzymol. 2009;454:405–21. doi: 10.1016/S0076-6879(08)03816-0. [DOI] [PMC free article] [PubMed] [Google Scholar]
- 4.Ramakrishnan S, Rajaraman S, Laxminarayan S, et al. A biomathematical model of the restoring effects of caffeine on cognitive performance during sleep deprivation. J Theor Biol. 2013;319:23–33. doi: 10.1016/j.jtbi.2012.11.015. [DOI] [PubMed] [Google Scholar]
- 5.Ramakrishnan S, Laxminarayan S, Wesensten NJ, Kamimori GH, Balkin TJ, Reifman J. Dose-dependent model of caffeine effects on human vigilance during total sleep deprivation. J Theor Biol. 2014;358:11–24. doi: 10.1016/j.jtbi.2014.05.017. [DOI] [PubMed] [Google Scholar]
- 6.Puckeridge M, Fulcher BD, Phillips AJ, Robinson PA. Incorporation of caffeine into a quantitative model of fatigue and sleep. J Theor Biol. 2011;273:44–54. doi: 10.1016/j.jtbi.2010.12.018. [DOI] [PubMed] [Google Scholar]
- 7.Rajdev P, Thorsley D, Rajaraman S, et al. A unified mathematical model to quantify performance impairment for both chronic sleep restriction and total sleep deprivation. J Theor Biol. 2013;331:66–77. doi: 10.1016/j.jtbi.2013.04.013. [DOI] [PubMed] [Google Scholar]
- 8.Landolt HP, Retey JV, Adam M. Reduced neurobehavioral impairment from sleep deprivation in older adults: contribution of adenosinergic mechanisms. Front Neurol. 2012;3:62. doi: 10.3389/fneur.2012.00062. [DOI] [PMC free article] [PubMed] [Google Scholar]
- 9.Belenky G, Wesensten NJ, Thorne DR, et al. Patterns of performance degradation and restoration during sleep restriction and subsequent recovery: a sleep dose-response study. J Sleep Res. 2003;12:1–12. doi: 10.1046/j.1365-2869.2003.00337.x. [DOI] [PubMed] [Google Scholar]
- 10.Kamimori GH, Johnson D, Thorne D, Belenky G. Multiple caffeine doses maintain vigilance during early morning operations. Aviat Space Environ Med. 2005;76:1046–50. [PubMed] [Google Scholar]
- 11.So CJ, Quartana PJ, Ratcliffe RH, et al. Caffeine efficacy across a simulated 5-day work week with sleep restriction. Sleep. 2016;39:A92. (Abstract Suppl) [Google Scholar]
- 12.McLellan TM, Kamimori GH, Voss DM, Tate C, Smith SJ. Caffeine effects on physical and cognitive performance during sustained operations. Aviat Space Environ Med. 2007;78:871–7. [PubMed] [Google Scholar]
- 13.Kamimori GH, McLellan TM, Tate CM, Voss DM, Niro P, Lieberman HR. Caffeine improves reaction time, vigilance and logical reasoning during extended periods with restricted opportunities for sleep. Psychopharmacology. 2015;232:2031–42. doi: 10.1007/s00213-014-3834-5. [DOI] [PMC free article] [PubMed] [Google Scholar]
- 14.McLellan TM, Kamimori GH, Bell DG, Smith IF, Johnson D, Belenky G. Caffeine maintains vigilance and marksmanship in simulated urban operations with sleep deprivation. Aviat Space Environ Med. 2005;76:39–45. [PubMed] [Google Scholar]
- 15.Retey JV, Adam M, Gottselig JM, et al. Adenosinergic mechanisms contribute to individual differences in sleep deprivation-induced changes in neurobehavioral function and brain rhythmic activity. J Neurosci. 2006;26:10472–9. doi: 10.1523/JNEUROSCI.1538-06.2006. [DOI] [PMC free article] [PubMed] [Google Scholar]
- 16.McLellan TM, Bell DG, Kamimori GH. Caffeine improves physical performance during 24 h of active wakefulness. Aviat Space Environ Med. 2004;75:666–72. [PubMed] [Google Scholar]
- 17.Killgore WD, Rupp TL, Grugle NL, Reichardt RM, Lipizzi EL, Balkin TJ. Effects of dextroamphetamine, caffeine and modafinil on psychomotor vigilance test performance after 44 h of continuous wakefulness. J Sleep Res. 2008;17:309–21. doi: 10.1111/j.1365-2869.2008.00654.x. [DOI] [PubMed] [Google Scholar]
- 18.Wesensten NJ, Killgore WDS, Balkin TJ. Performance and alertness effects of caffeine, dextroamphetamine, and modafinil during sleep deprivation. J Sleep Res. 2005;14:255–66. doi: 10.1111/j.1365-2869.2005.00468.x. [DOI] [PubMed] [Google Scholar]
- 19.Dark HE, Kamimori GH, LaValle CR, Eonta SE. Effects of high habitual caffeine use on performance during one night of sleep deprivation: do high users need larger doses to maintain vigilance? J Caffeine Res. 2015;5:155–66. [Google Scholar]
- 20.Borbely AA. A two process model of sleep regulation. Hum Neurobiol. 1982;1:195–204. [PubMed] [Google Scholar]
- 21.Kamimori GH, Karyekar CS, Otterstetter R, et al. The rate of absorption and relative bioavailability of caffeine administered in chewing gum versus capsules to normal healthy volunteers. Int J Pharm. 2002;234:159–67. doi: 10.1016/s0378-5173(01)00958-9. [DOI] [PubMed] [Google Scholar]
- 22.Hastie TJ, Tibshirani RJ, Friedman J. New York: Springer; 2001. The elements of statistical learning: data mining, inference, and prediction; pp. 44–5. [Google Scholar]
- 23.Oleng NO, Gribok A, Reifman J. Error bounds for data-driven models of dynamical systems. Comput Biol Med. 2007;37:670–9. doi: 10.1016/j.compbiomed.2006.06.005. [DOI] [PubMed] [Google Scholar]
- 24.Rajaraman S, Ramakrishnan S, Thorsley D, Wesensten NJ, Balkin TJ, Reifman J. A new metric for quantifying performance impairment on the psychomotor vigilance test. J Sleep Res. 2012;21:659–74. doi: 10.1111/j.1365-2869.2012.01008.x. [DOI] [PubMed] [Google Scholar]
- 25.Jewett ME, Kronauer RE. Interactive mathematical models of subjective alertness and cognitive throughput in humans. J Biol Rhythms. 1999;14:588–97. doi: 10.1177/074873099129000920. [DOI] [PubMed] [Google Scholar]
- 26.Rupp TL, Wesensten NJ, Balkin TJ. Trait-like vulnerability to total and partial sleep loss. Sleep. 2012;35:1163–72. doi: 10.5665/sleep.2010. [DOI] [PMC free article] [PubMed] [Google Scholar]
- 27.Van Dongen HP, Baynard MD, Maislin G, Dinges DF. Systematic interindividual differences in neurobehavioral impairment from sleep loss: evidence of trait-like differential vulnerability. Sleep. 2004;27:423–33. [PubMed] [Google Scholar]
- 28.Killgore WD, Kahn-Greene ET, Grugle NL, Killgore DB, Balkin TJ. Sustaining executive functions during sleep deprivation: a comparison of caffeine, dextroamphetamine, and modafinil. Sleep. 2009;32:205–16. doi: 10.1093/sleep/32.2.205. [DOI] [PMC free article] [PubMed] [Google Scholar]
- 29.Klaassen EB, de Groot RH, Evers EA, et al. The effect of caffeine on working memory load-related brain activation in middle-aged males. Neuropharmacology. 2013;64:160–7. doi: 10.1016/j.neuropharm.2012.06.026. [DOI] [PubMed] [Google Scholar]
- 30.Einother SJ, Giesbrecht T. Caffeine as an attention enhancer: reviewing existing assumptions. Psychopharmacology. 2013;225:251–74. doi: 10.1007/s00213-012-2917-4. [DOI] [PubMed] [Google Scholar]
- 31.Hewlett P, Smith A. Acute effects of caffeine in volunteers with different patterns of regular consumption. Hum Psychopharmacol. 2006;21:167–80. doi: 10.1002/hup.752. [DOI] [PubMed] [Google Scholar]
- 32.Penetar D, McCann U, Thorne D, et al. Caffeine reversal of sleep deprivation effects on alertness and mood. Psychopharmacology. 1993;112:359–65. doi: 10.1007/BF02244933. [DOI] [PubMed] [Google Scholar]
Associated Data
This section collects any data citations, data availability statements, or supplementary materials included in this article.


