

Abstract
Study Objectives:
Intermittent hypoxia (IH) mimicking obstructive sleep apnea (OSA) significantly modifies gut microbiota in mice. However, whether these IH-induced gut microbiome changes are reversible after restoring normal oxygenation (the equivalent of effective OSA therapy) is unknown. The aim of this study was to investigate gut microbiota composition and circulating endotoxemia after a post-IH normoxic period in a mouse model of OSA.
Methods:
Ten mice were subjected to IH (40 sec 21% O2-20 sec 5% O2) for 6 h/day for 6 w and 10 mice breathing normoxic air (NM) were used as controls. After exposures, both groups were subjected to 6 w in normoxia. Microbiome composition of fecal samples was determined by 16S ribosomal RNA (rRNA) pyrosequencing. Bioinformatic analysis was performed by Quantitative Insights into Microbial Ecology. Plasma lipopolysaccharide (LPS) levels were measured by endotoxin assay.
Results:
After normoxic recovery, the Chao and Shannon indices of each group suggested similar bacterial richness and diversity. 16S rRNA pyrosequencing analysis showed that IH-exposed mice had a significant decrease in the abundance of Bacteroidetes and a significant increase of Firmicutes and Deferribacteres compared to the NM group. After normoxic recovery, circulating LPS concentrations were higher in the IH group (P < 0.009). Moreover, the IH group showed a negative and significant correlation between the abundance of Lactobacillus and Ruminococcus and significant positive correlations between the abundance of Mucispirillum and Desulfovibrio and plasma LPS levels, respectively.
Conclusions:
Even after prolonged normoxic recovery after IH exposures, gut microbiota and circulating endotoxemia remain negatively altered, suggesting that potential benefits of OSA treatment for reversing OSA-induced changes in gut microbiota may either require a longer period or alternative interventions.
Citation:
Moreno-Indias I, Torres M, Sanchez-Alcoholado L, Cardona F, Almendros I, Gozal D, Montserrat JM, Queipo-Ortuño MI, Farré R. Normoxic recovery mimicking treatment of sleep apnea does not reverse intermittent hypoxia-induced bacterial dysbiosis and low-grade endotoxemia in mice. SLEEP 2016;39(10):1891–1897.
Keywords: endotoxemia, gut microbiota, intermittent hypoxia, obstructive sleep apnea, sleep apnea therapy
Significance.
It was recently shown that intermittent hypoxia, a feature of obstructive sleep apnea (OSA), negatively alters gut microbiota in mice. This study shows that a 6-w normoxic recovery period mimicking continuous positive airway pressure therapy (a considerably long period taking into account the mouse life span) is not enough to reverse the changes in intestinal microbioma and systemic endotoxemia induced by intermittent hypoxia. Translating these results to humans, it is suggested that the effects of OSA therapy (e.g., continuous positive airway pressure) in normalizing gut microbiota could be considerably delayed in these patients. This animal model study provides a proof of concept with potential clinical effect given the important role that gut microbiota could play in modulating the well-known metabolic consequences of OSA.
INTRODUCTION
Obstructive sleep apnea (OSA) is a highly prevalent disease1 characterized by repeated episodes of collapse of the upper airway during sleep that result in intermittent hypoxia (IH), increased sympathetic activation and intrathoracic pressure swings, and sleep fragmentation. OSA has been independently associated with significant mortality and morbidity, including neurocognitive dysfunction, systemic hypertension and multiple other cardiovascular consequences, and metabolic disorders such as obesity, diabetes, and metabolic syndrome.2–4 It is now firmly established that IH, a key feature of OSA, plays an important role in its harmful consequences, most likely via enhanced oxidative stress and inflammation.5 Indeed, OSA may cause systemic elevations in the levels of multiple inflammatory mediators,6 leading to an increased and sustained proinflammatory state.6,7
Gut microbiota, which in addition to its physiological functions serve as reservoir for bacterial lipopolysaccharides (LPS), could be altered by different perturbations and boost inflammation and metabolic diseases.8,9 In a recent study, we uncovered the effect of recurrent oxygen desaturations mimicking OSA on the gut microbiota using a mouse model exposed to IH.10 Indeed, we found that IH mimicking OSA resulted in hypoxia/reoxygenation cycles within the bowel and that IH-exposed mice showed an increase in diversity in the bacterial communities of their fecal microbiota, along with changes in the abundance of obligate anaerobic gram-negative bacteria. Specifically, IH-exposed mice showed a higher abundance of Firmicutes and a smaller abundance of Bacteroidetes and Proteobacteria phyla than normoxic controls.10 Intermittent reduction in oxygen under IH inside the gut would confer a selective advantage to obligatory anaerobic bacteria, allowing them to be more competitive and overgrow. It is well established that endogenous LPS, the death product of gram-negative bacteria, is physiologically translocated from the gut to intestinal capillaries by enterocytes through a Toll-like receptor 4-dependent mechanism.11 Interestingly, it has been shown that nonobese children with OSA have increased LPS binding protein plasma concentration (a response marker against LPS) as compared with controls.12 However, it is still unclear whether perturbations in gut epithelium oxygenation lead to increases in circulating endotoxin levels consequent to alterations in the microbiome. Improved understanding on alterations and recovery of gut microbiota and subsequent levels of systemic endotoxemia in OSA would potentially unravel their contribution to the metabolic morbidity commonly found in patients with this sleep breathing disorder.
Whereas a considerable amount of research in animal models has been devoted to understand the noxious effects of IH mimicking OSA in different tissues and organs, there are almost no data available on whether these deleterious effects reverse after efficient treatment, i.e., restoration of normoxia, is accomplished. The lack of information in this regard is of interest for clinical translation because normoxic recovery after IH recapitulates the effects of OSA treatment, e.g., continuous positive airway pressure (CPAP), which aims to normalize nocturnal breathing. To our knowledge, the only studies available that assessed the potential recovery process focused on the aortic wall remodeling induced by 6-w IH exposures in mice, which was virtually reversed after 6 w of normoxic recovery.13
Based on aforementioned considerations, we hypothesized that alterations in gut microbiota induced by IH in mice tend to normalize after a recovery period of normoxia and that IH exposure increases translocation of LPS into the plasma. Because the ideal duration of recovery was difficult to anticipate as data in the literature show that dysbiosis recovery can occur at different time scales or even remain virtually permanent depending on the type of challenge inducing it,14–16 we specifically subjected mice to a 6-w normoxic recovery period following a previous 6-w period of IH challenge, and investigated the changes in gut dysbiosis and circulating endotoxemia.
METHODS
Animal Model
The study was approved by the Ethical Committee for Animal Research of the University of Barcelona (Barcelona, Spain), and was carried out on 20 pathogen-free C57BL/6 8-w-old male mice (Charles River Laboratories, Saint Germain sur L'arbresle, France) fed with sterilized standard food and tap water ad libitum and kept in a temperature- and light-controlled room in the animal facilities. Mice were randomly assigned to IH or normoxia (NM) treatments. IH was achieved by placing the animals in a box flushed with gas with cyclic changes in oxygen content (40 sec 21% O2 and 20 sec 5% O2), therefore mimicking a rate of 60 hypoxic events/h, typical of severe OSA, 6 h/day for 6 w.10 In the NM group, the animals were subjected to the same experimental protocol with the only difference that they breathed room air instead of intermittently hypoxic air. After the 6-w period of IH or NM exposure, both groups started the normoxic recovery phase for 6 w, in which the animals remained housed while breathing room air. Accordingly, this recovery phase simulates a period of effective and optimal OSA treatment (for instance by application of nasal CPAP). After the 6-w period of normoxic recovery, fecal samples were obtained directly from stool expulsion stimulated by manual handling, and immediately frozen at −80°C. Blood samples were collected through the abdominal aorta before euthanasia, and plasma obtained and frozen until LPS assays.
DNA Extraction, Pyrosequencing, and Data Analysis
DNA was extracted from fecal samples using the QIAamp DNA Stool Mini Kit (Qiagen, Hilden, Germany) following the manufacturer's protocol. The DNA concentration was determined by absorbance at 260 nm, and the purity was estimated by determining the A260:A280 ratio with a Nanodrop spectrophotometer (Nanodrop Technologies). Amplification of genomic DNA was performed using barcoded primers that targeted the V2 to V3 regions of the bacterial 16S rRNA gene. Amplification, sequencing, and basic analysis were performed by using a GS Junior 454 platform according to the manufacturer's protocols using a Titanium chemistry apparatus (Roche Applied Science, Indianapolis, IN, USA).10 The 454 pyrosequencing datasets were analyzed by Quantitative Insights into Microbial Ecology (QIIME) 1.8.0 software (http://qiime.org). Sequences for each sample were sorted by a unique barcode and low quality reads (average quality score < 25 or ambiguous base calls) were removed. Operational taxonomic units (OTUs) were picked by clustering sequences at a similarity of > 97% and the most abundant sequences in each cluster were submitted to the UCLUST-consensus taxonomy assignment (http://drive5.com/usearch/manual/uclust_algo.html) to obtain the taxonomy assignment and the relative abundance of each OTU using the Greengenes 16S rRNA gene database (http://greengenes.lbl.gov/cgi-bin/nph-index.cgi). α- and β-diversity were evaluated through QIIME as previously described.17 Unweighted UniFrac distance matrix was used to perform analysis of similarity (ANOSIM) statistical tests through the compare_categories.py script of QIIME.
Plasma LPS Assessment by Limulus Amebocyte Lysate Assay
Plasma concentrations of LPS were measured by an endotoxin assay, which is based on a limulus amebocyte extract with a chromogenic limulus amebocyte lysate (LAL) assay (QCL-1000; Lonza Group Ltd). Samples were diluted in pyrogen-free water and heated to 70°C for 10 min to inactivate endotoxin-neutralizing agents that could inhibit the activity of endotoxin during the assay. Pyrosperse reagent (Lonza Group Ltd), which is a metallomodified polyanionic dispersant, was added at a ratio of 1:200 (vol:vol) to test samples before LAL testing to minimize interference in the reaction. All samples were tested in duplicate, and results were accepted when the intra-assay coefficient of variation was 10%. The endotoxin content was expressed as endotoxin units per milliliter (EU/mL). Exhaustive care was taken to avoid environmental endotoxin contamination, and all materials used for both sample preparation and testing were pyrogen free.
Statistical Analysis
The relative abundance of each OTU (taxa) was compared by a Wilcoxon test with a continuity correction using Explicet software package specifically addressed to analyze micro-biome data.17 The analysis of the populations within the sample and between samples was performed by the α- and β-diversities achieved by QIIME, respectively. Two types of α-diversities were determined: richness, which refers to how many different types of organisms are present in the sample; and evenness, which refers to how uniform a sample is. Both types of α-diversities were estimated using a nonparametric t-test with a default number of Monte Carlo permutations of 999. β-diversity, which refers to between sample diversity, was estimated by the ANOSIM statistical method with 99 permutations and summarized in a principal coordinate analysis plot. ANOSIM test compares the mean of the ranked dissimilarities within groups. The Spearman correlation coefficient was calculated to estimate the linear correlations between variables. A lineal regression analysis was performed to identify individual bacteria as independent predictors for plasma LPS levels in both study groups after recovery stage. A value of P < 0.05 was designated as achieving statistical significance.
RESULTS
Characterization of Fecal Microbiota
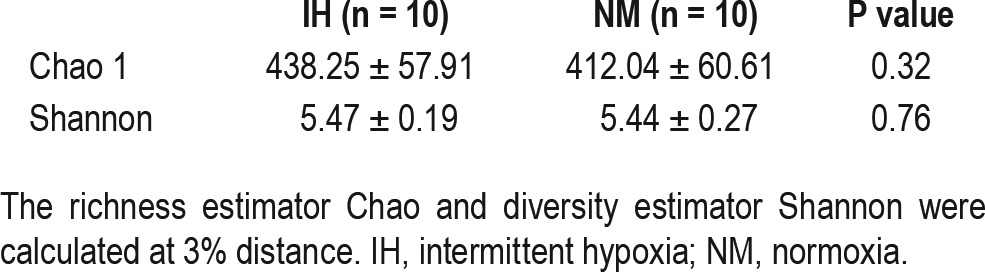
A total of 181,508 valid reads were obtained from the 20 fecal samples through 454 pyrosequencing analysis. The microbiota of all fecal samples after QIIME were composed of 1,772 OTUs with a relative abundance higher than 1% in at least four samples (97% similarity cutoff). Of note, prior to assessing α and β-diversity measures, samples were rarefied to 3,653 seq, which corresponded to the lowest number of quality reads obtained from any individual sample in the data set. After recovery phase, the Shannon (diversity) and Chao 1 (community richness) indices of 454 sequencing results were calculated to estimate the α-diversity. No significant differences between the two study groups were found, although IH-exposed mice showed slight increases in gut microbiota diversity compared with the NM group (Table 1). Moreover, rarefaction curves of observed OTUs calculated at 3% distance entered in the plateau phase at approximately 100 reads, indicating that novel bacteria would not be recovered with additional sequencing efforts.
Table 1.
Estimated richness (Chao 1) and diversity (Shannon) indices between microbial communities from stool of intermittent hypoxia and normoxia groups after 6-w normoxic after recovery period.
A dimensional principal coordinates analysis plot of un-weighted UniFrac distance was used to assess the similarity of microbial communities between groups and to visualize complex relationships. According to Figure 1, mice from the IH group showed different patterns of clustering when compared to the NM group after the recovery phase (P = 0.01), indicating that after recovery there were still clear differences in the microbial composition between IH and NM groups (Figure 1).
Figure 1.
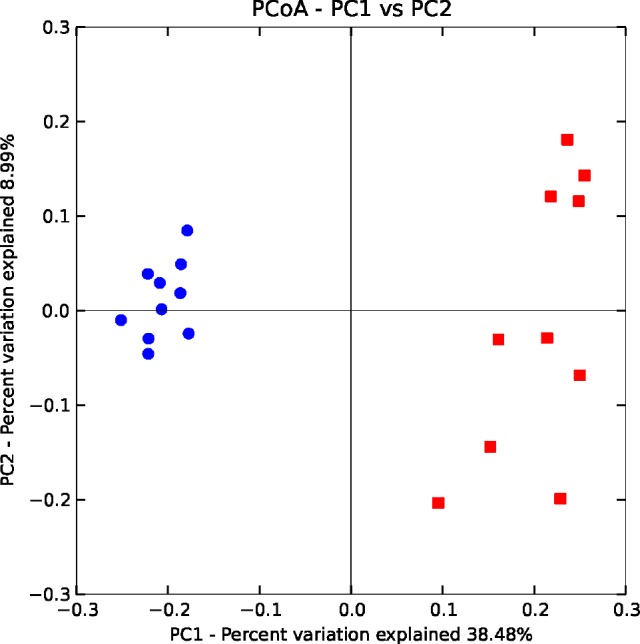
Clustering of fecal bacterial communities after normoxic recovery by principal coordinate analysis (PCoA) using unweighted UniFrac distances. The position of the bacterial communities for each genus along the two first principal coordinate axes (PC1 versus PC2) are illustrated, along with the percentage of variation explained by each axis. Axis 1 (PCoA1): 38.48% of variation explained; Axis 2 (PCoA2): 8.99% of variation explained. Intermittent hypoxia (IH) samples (n = 10) are represented by blue dots and normoxic control (NM) samples (n = 10) are represented by red squares.
To compare gut bacteria communities between IH and NM mice after recovery, the relative abundance of each phylum-level bacteria taxon was investigated in the fecal samples collected. IH and NM groups were related with 10 bacterial phyla (Figure 2). However, the relative abundance of the dominant phyla differed between the two study groups. Bacteroidetes was significantly higher in NM (69.5%) than in IH (55.76%), P = 0.025), whereas Firmicutes (41.0% IH vs. 28.3% NM, P < 0.001) and Deferribacteres (1.9% IH vs. 0.7% NM, P < 0.001) were significantly lower in the NM group. The remainder of the other phyla had a relative abundance lower than 1% (Figure 2).
Figure 2.
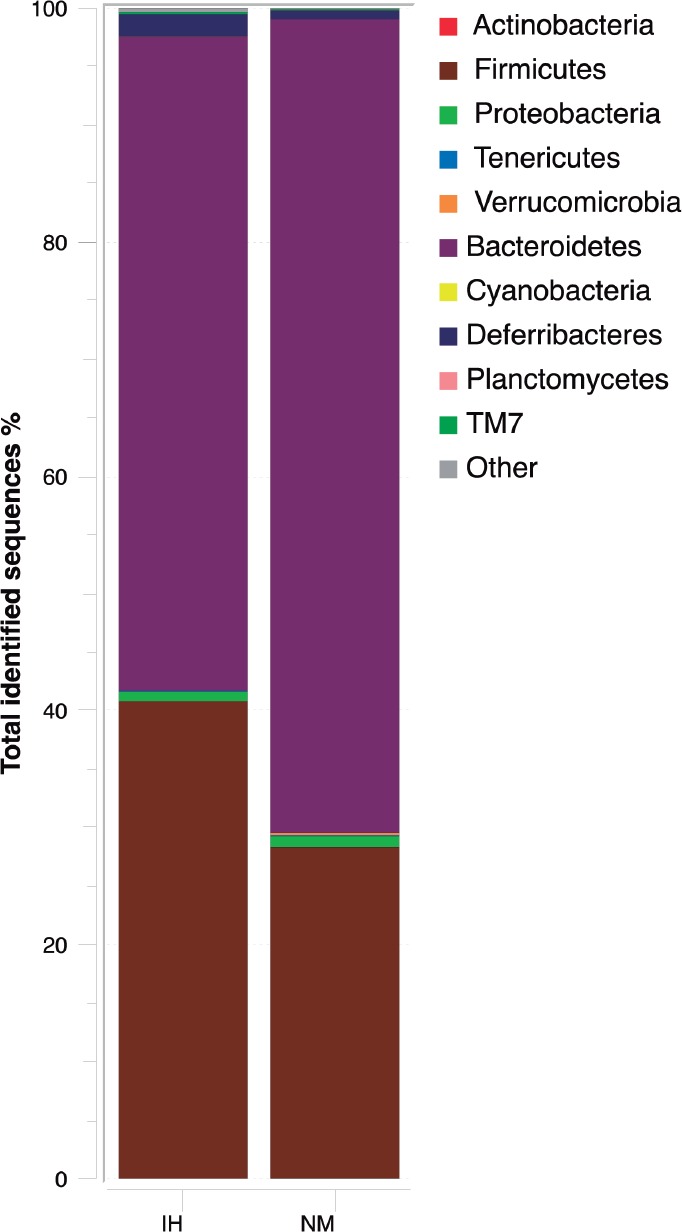
Phylum-level distribution of bacteria in fecal samples of intermittent hypoxia (IH) and normoxic controls (NM) after normoxic recovery obtained by pyrosequencing analysis of the V2-V3 region of the 16S ribosomal RNA gene. Changes in the relative abundance (%) of major phylum-level taxa after normoxic recovery in both study groups are represented. Data are shown as percentage of the total identified sequences per group.
The gut bacterial communities were largely populated by 26 bacterial phylogenetic families, but only 14 represented more than 1% for any reference OTU in any given sample. Among these 14 family groups, Ruminococcaceae (73% IH vs. 37% NM, P < 0.001), Desulfovibrionaceae (38.4% IH vs. 0.7% NM, P = 0.05), Helicobacteraceae (20% IH vs. 1% NM, P < 0.001), Rikenellaceae (13% IH vs. 9% NM, P = 0.021), Odoribacteraceae (5% IH vs. 2% NM, P < 0.001), Enterobacteriaceae (4.7% IH vs. 1% NM, P < 0.001), Erysipelotrichaceae (2% IH vs. 0.6% NM, P = 0.017) and Clostridiaceae (1% IH vs. 0.5% NM, P < 0.001) were significantly higher in IH compared to NM. Only the relative abundance of the families S24-7 (66% IH vs. 78% NM, P = 0.002) and Lactobacillaceae (1% IH vs. 4% NM, P = 0.017) were significantly lower in IH (Figure 3).
Figure 3.

Microbial community structure at the family level using pyrosequencing data in the feces of intermittent hypoxia (IH) and normoxic controls (NM) after normoxic recovery. Changes in the relative abundance (%) of major families after normoxic recovery in both study groups are shown. Data are shown as percentage of the total identified sequences per group.
Moreover, 10 genera were differentially abundant. The IH group was enriched with sequences attributed to the genera Clostridium (61.1% IH vs. 52.3% NM, P = 0.05), Desulfovibrio (35.5% IH vs. 11.6% NM, P = 0.038), Sutterella (25.4% IH vs. 20.8% NM, P = 0.038), Allobaculum (15.1% IH vs. 10.1% NM, P < 0.001), Rikenella (13% IH vs. 9% NM, P = 0.021), Odoribacter (5% IH vs. 2% NM, P < 0.001) and Mucispirillum (3% IH vs. 0.5% NM, P = 0.023). NM data sets were enriched with sequences of RF32 (5.4% IH vs. 46.9% NM, P < 0.001), Lactobacillus (0.7% IH vs. 37.8% NM, P = 0.01), Ruminococcus (22.4% IH vs. 28.3% NM, P = 0.04), Oscillospira (11.7% IH vs. 24.4% NM, P = 0.001), Bacteroides (1% IH vs. 3% NM, P < 0.001) and Prevotella (1.1% IH vs. 2.7% NM, P = 0.001) (Figure 4).
Figure 4.

Changes in the relative abundance of predominant genera in the microbiota obtained by pyrosequencing analysis from feces of intermittent hypoxia (IH) and normoxic control (NM) mice after normoxic recovery. Data are shown as percentage of the total identified sequences per group.
Correlation between Gut Microbiota Composition and Plasma LPS
Figure 5 shows the LPS concentrations after the normoxic recovey period together with the LPS plasma values measured immediately after 6 w of IH (unpublished data from our previous study10; obtained by the same Limilus amebocyte lysate assay described in this report). Plasma LPS at the end of the IH period tended (P = 0.243) to be greater than in NM. Moreover, after the normoxic recovery period, LPS plasma concentrations were twofold higher in the mice that were previously subjected to IH exposures and recovery when compared with controls (P = 0.009) (Figure 5).
Figure 5.
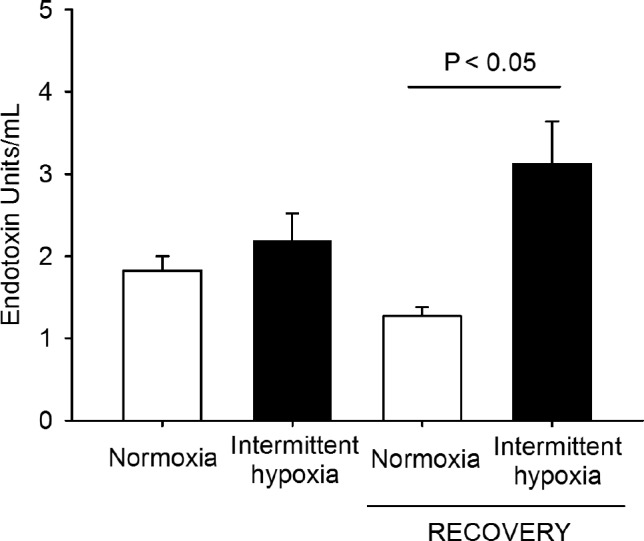
Changes in circulating endotoxin (lipopolysaccharide) levels in intermittent hypoxia and normoxic controls after a 6-w period of intermittent hipoxia exposure and after a subsequent 6-w period of normoxic recovery.
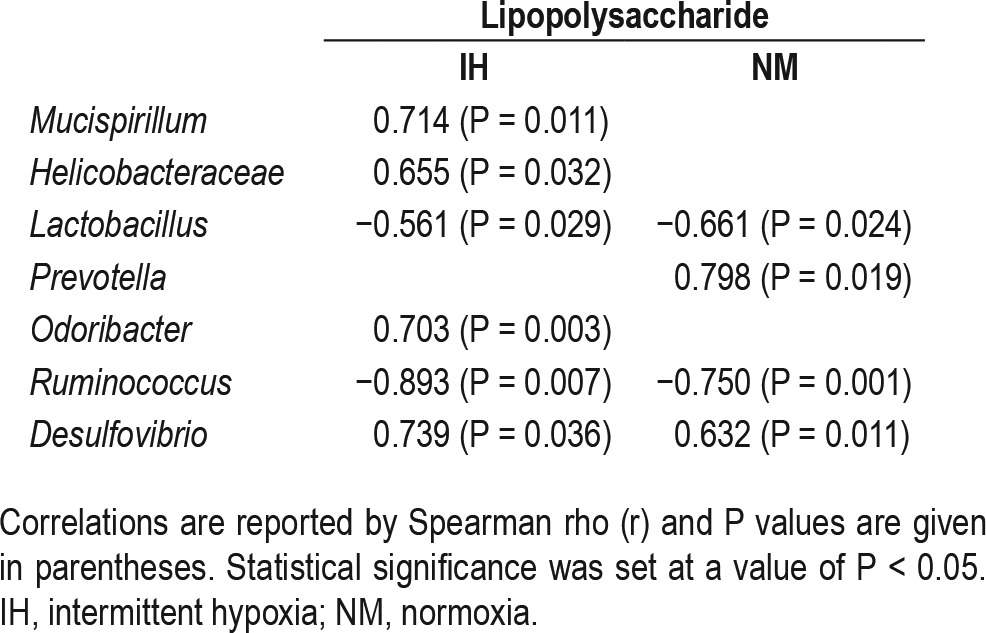
In addition, a significant univariate correlation between changes in the amount of specific bacteria at different taxa levels and plasma LPS concentrations was found (Table 2). Subsequent linear regression analysis including all the bacterial groups analyzed showed that in the IH group the decreases in Lactobacillus and Ruminococcus (P = 0.002, β = −0.682, r2 = 0.90, and P = 0.014, β = −0.930, r2 = 0.94 respectively), and the increases in Desulfovibrio (P = 0.029, β = 0.777, r2 = 0.98) and Mucispirillum (P = 0.05, β = 0.872, r2 = 0.96) were associated with the increases in plasma LPS levels. In the NM group only the increases in Lactobacillus and Ruminococcus (P = 0.002, β = −1.403, r2 = 0.99 and P = 0.014, β = −0.703, r2 = 0.97, respectively) were associated with the lower plasma LPS levels.
Table 2.
Correlations between gut microbiota composition and plasma lipopolysaccharide levels in the intermittent hypoxia and normoxia groups after 6-w normoxic after recovery period.
DISCUSSION
In this study we show that a relatively long period of normoxic recovery after IH was insufficient to reverse the increase in the abundance of obligate anaerobic gram-negative bacteria induced by this OSA-mimicking hypoxic challenge. Indeed, whereas a previous study showed that 6 w of IH elicited major changes at family and genus levels in the intestinal micro-biota,10 normoxic recovery for the same 6-w period resulted in shuffling of abundances at phylum, family, and genus levels rather than replacement of community members. In addition, circulating endotoxemia, as measured by LPS concentrations in plasma, was considerably higher in the mice preexposed to IH than in controls.
The increase found after normoxic recovery in the abundance of obligate anaerobic gram-negative bacteria in the IH group compared to control may promote changes in intestinal permeability or alternatively induce microbial translocation that would be responsible for the significant high levels of plasma LPS found in IH mice. Indeed, changes in the gut microbiota could increase the production of endotoxin leading to high plasma LPS levels.18,19 In children, OSA has been associated with increased circulating endotoxin levels that appear to promote innate immunity responses leading to low-grade systemic inflammation, ultimately resulting in metabolic dys-function.12 Accordingly, the intestinal epithelium acts as a continuous barrier to avoid LPS translocation, but some endogenous or exogenous factors such as hypoxia/reoxygenation exposure may decrease epithelial tight junctions integrity and alter this function.20
Current findings indicate that after normoxic recovery, the IH group had no significant increases in the diversity of the dominating bacterial community, but that they clustered separately when compared to the NM mice, as clearly illustrated by OTU-based principal coordinate analysis plots. Moreover, the pyrosequencing analysis of the 16S rRNA gene sequences of the relative abundance of predominant phyla, families, and genera taxa revealed large significant differences between both groups. Compared with NM mice, we found a significant decrease in the abundance of Bacteroidetes and a significant increase in the abundances of Firmicutes and Deferribacteres in the IH group after normoxic recovery. These results suggest that the dominant microbiota remain different in the IH mice even after a long period of simulated OSA treatment.
We also observed that the genera Lactobacillus and Ruminococcus, which were similarly abundant in both study groups after the IH treatment,10 were significantly more abundant in NM animals than in IH animals after normoxic recovery. Moreover, the significant decreases reported here in the abundance of Lactobacillus and Ruminococcus (anaerobic gram-positive bacteria) in the IH group after the normoxic recovery period were negatively correlated with higher levels of plasma LPS. Furthermore, the regression analysis showed that the decreases in the number of Lactobacillus and Ruminococcus could be associated with higher plasma LPS levels in the IH group after the recovery stage. A previous study in patients with inflammatory bowel disease showed that lactobacilli and their cell wall components have anti-inflammatory properties.21 Similarly, Lactobacillus has members with probiotic characteristics that exhibit the capacity to generate the beneficial organic acid lactate, which is converted into butyrate by butyrate-producing bacteria in the gut.22 Likewise, the significant decrease in butyrate-producing intestinal bacteria such as Ruminococcus, as found in the IH group, also seems to play an important role in plasma LPS levels. Previous studies have shown that this genus: (1) is able to degrade complex polysaccharides to SCFA such as butyrate that can be used for energy by the host,23 (2) can induce mucin synthesis,24 (3) decrease bacterial transport across the epithelium,25 (4) improve gut integrity by increasing tight junction assembly,26 and (5) decrease the release of LPS into the bloodstream alleviating the intestinal inflammatory response in the host.27 Therefore, the lower abundance of these genus in the IH group after normoxic recovery could suggest a decrease in the production of SCFAs (lactate and butyrate), reducing tight junction assembly, and generating increased gut permeability and thus increased plasma LPS, leading to endotoxemia, which may play an important role in systemic inflammation.
However, the significant enrichment in Mucispirillum and Desulfovibrio found in IH mice was positively associated with the increase in the plasma LPS level. Mucispirillum inhabits the mucus layer in the colon, and is known to have a potential capacity to degrade mucin by actively destroying the microenvironment of that part of the gut, which could potentially lead to a significant alteration in intestinal permeability.28,29 Similarly, Desulfovibrio is able to produce high levels of hydrogen sulfide during active inflammation,30 which may further fuel inflammation. A high amount of the genus Desulfovibrio has been associated with a penetrable mucus phenotype in animals with a high inflammatory tone, suggesting that sulfate-reducing bacteria are linked to an inflammatory state of the gut.31 In this study we have identified an association between IH and a possible decrease in mucus thickness, which supports an additional mechanism of increased gut permeability such as metabolic endotoxemia, a characteristic finding in metabolic disorders such as obesity and associated morbidities.
This study explores a relatively new field—alterations of gut microbiota in sleep apnea—by means of an animal model of intermittent hypoxia. Our work provides a proof of concept but has some limitations. In addition to the limitations that are intrinsic in animal models, a specific question that would require further research concerns exposure duration. Indeed, we chose 6-w periods for both mimicking the initial chronic IH challenge and the subsequent normoxic period simulating effective treatment. Although 6 w is a rather long period at the mouse life span scale, using other duration periods, particularly for normoxia recovery, could allow us to observe potential recovery in gut microbiota.
In summary, the post-IH normoxic recovery period of 6 w used in this study did not restore to normoxic levels the IH-induced gut microbiota dysbiosis that we previously described.10 After normoxic recovery, the IH group exhibited a shift in microbiota composition including a decrease in lactateand butyrate-producing bacteria and an increase in mucindegrader bacteria that may impair intestinal barrier function, might enhance the observed translocation of bacterial LPS, and therefore may contribute to inflammatory processes. Thus, IH may influence the composition of the microbial community in the intestine in either an irreversible manner or a very long exposure to normoxia is necessary for reversal. If the latter is correct, then prolonged and effective OSA treatment would be necessary in patients to restore gut flora imbalance and plasma LPS.
DISCLOSURE STATEMENT
This was not an industry supported study. The investigation was performed in the facilities of the School of Medicine (Barcelona University) and Instituto de Investigación Biomédica (IBIMA) and supported by a “Sara Borrell” postdoctoral contract (CD12/00530), “Miguel Servet Type I” program (CP13/00065) and “Miguel Servet Type II” program (CP13/00023) from the Instituto de Salud Carlos III, Madrid, Spain, and co-founded by Fondo Europeo de Desarrollo Regional-FEDER and the Spanish Ministry of Economy and Competitiveness (Instituto Salud Carlos III, FIS.PI14-00004). The authors have indicated no financial conflicts of interest.
ACKNOWLEDGMENTS
The authors thank Mrs. Maeba Polo and Mr. Miguel A. Rodríguez for their excellent technical assistance.
REFERENCES
- 1.Peppard PE, Young T, Barnet JH, Palta M, Hagen EW, Hla KM. Increased prevalence of sleep-disordered breathing in adults. Am J Epidemiol. 2013;177:1006–14. doi: 10.1093/aje/kws342. [DOI] [PMC free article] [PubMed] [Google Scholar]
- 2.Dewan NA, Nieto FJ, Somers VK. Intermittent hypoxemia and OSA: implications for comorbidities. Chest. 2015;147:266–74. doi: 10.1378/chest.14-0500. [DOI] [PMC free article] [PubMed] [Google Scholar]
- 3.Punjabi NM, Shahar E, Redline S, Gottlieb DJ, Givelber R, Resnick HE Sleep Heart Health Study Investigators. Sleep-disordered breathing, glucose intolerance, and insulin resistance: the Sleep Heart Health Study. Am J Epidemiol. 2004;160:521–30. doi: 10.1093/aje/kwh261. [DOI] [PubMed] [Google Scholar]
- 4.Vgontzas AN, Bixler EO, Chrousos GP. Sleep apnea is a manifestation of the metabolic syndrome. Sleep Med Rev. 2005;3:211–24. doi: 10.1016/j.smrv.2005.01.006. [DOI] [PubMed] [Google Scholar]
- 5.Lavie L. Oxidative stress--a unifying paradigm in obstructive sleep apnea and comorbidities. Prog Cardiovasc Dis. 2009;51:303–12. doi: 10.1016/j.pcad.2008.08.003. [DOI] [PubMed] [Google Scholar]
- 6.Shamsuzzaman AS, Winnicki M, Lanfranchi P, et al. Elevated C-reactive protein in patients with obstructive sleep apnea. Circulation. 2002;105:2462–4. doi: 10.1161/01.cir.0000018948.95175.03. [DOI] [PubMed] [Google Scholar]
- 7.Vgontzas AN, Papanicolaou DA, Bixler EO, et al. Sleep apnea and daytime sleepiness and fatigue: relation to visceral obesity, insulin resistance, and hypercytokinemia. J Clin Endocrinol Metab. 2000:1151–8. doi: 10.1210/jcem.85.3.6484. [DOI] [PubMed] [Google Scholar]
- 8.Tremaroli V, Bäckhed F. Functional interactions between the gut microbiota and host metabolism. Nature. 2012;489:242–9. doi: 10.1038/nature11552. [DOI] [PubMed] [Google Scholar]
- 9.Burcelin R. Regulation of metabolism: a cross talk between gut microbiota and its human host. Physiology (Bethesda) 2012;27:300–7. doi: 10.1152/physiol.00023.2012. [DOI] [PubMed] [Google Scholar]
- 10.Moreno-Indias I, Torres M, Montserrat JM, et al. Intermittent hypoxia alters gut microbiota diversity in a mouse model of sleep apnoea. Eur Respir J. 2015;45:1055–65. doi: 10.1183/09031936.00184314. [DOI] [PubMed] [Google Scholar]
- 11.Neal MD, Leaphart C, Levy R, et al. Enterocyte TLR4 mediates phagocytosis and translocation of bacteria across the intestinal barrier. J Immunol. 2006;176:3070–9. doi: 10.4049/jimmunol.176.5.3070. [DOI] [PubMed] [Google Scholar]
- 12.Kheirandish-Gozal L, Peris E, Wang Y, et al. Lipopolysaccharide-binding protein plasma levels in children: effects of obstructive sleep apnea and obesity. J Clin Endocrinol Metab. 2014;99:656–63. doi: 10.1210/jc.2013-3327. [DOI] [PMC free article] [PubMed] [Google Scholar]
- 13.Castro-Grattoni AL, Alvarez R, Torres M, et al. Intermittent hypoxia-induced cardiovascular remodeling is reversed by normoxia in a mouse model of sleep apnea. Chest. 2016;149:1400–8. doi: 10.1016/j.chest.2015.11.010. [DOI] [PubMed] [Google Scholar]
- 14.Dethlefsen L, Huse S, Sogin ML, Relman DA. The pervasive effects of an antibiotic on the human gut microbiota, as revealed by deep 16S rRNA sequencing. PLoS Biol. 2008;6:e280. doi: 10.1371/journal.pbio.0060280. [DOI] [PMC free article] [PubMed] [Google Scholar]
- 15.Martin Blaser. Antibiotic overuse: stop the killing of beneficial bacteria. Nature. 2011;476:393–4. doi: 10.1038/476393a. [DOI] [PubMed] [Google Scholar]
- 16.Sonnenburg ED, Smits SA, Tikhonov M, Higginbottom SK, Wingreen NS, Sonnenburg JL. Diet-induced extinctions in the gut microbiota compound over generations. Nature. 2016;529:212–5. doi: 10.1038/nature16504. [DOI] [PMC free article] [PubMed] [Google Scholar]
- 17.De Filippis F, La Storia A, Villani F, Ercolini D. Exploring the sources of bacterial spoilers in beefsteaks by culture-independent high-throughput sequencing. PLoS One. 2013;8:e70222. doi: 10.1371/journal.pone.0070222. [DOI] [PMC free article] [PubMed] [Google Scholar]
- 18.Cani PD, Neyrinck AM, Fava F, et al. Selective increases of bifidobacteria in gut microflora improve high-fat-diet-induced diabetes in mice through a mechanism associated with endotoxaemia. Diabetologia. 2007;50:2374–83. doi: 10.1007/s00125-007-0791-0. [DOI] [PubMed] [Google Scholar]
- 19.Cani PD, Amar J, Iglesias MA, et al. Metabolic endotoxemia initiates obesity and insulin resistance. Diabetes. 2007;56:1761–72. doi: 10.2337/db06-1491. [DOI] [PubMed] [Google Scholar]
- 20.Xu DZ, Lu Q, Kubicka R, et al. The effect of hypoxia/reoxygenation on the cellular function of intestinal epithelial cells. J Trauma. 1999;46:280–5. doi: 10.1097/00005373-199902000-00014. [DOI] [PubMed] [Google Scholar]
- 21.Macho Fernandez E, Pot B, Grangette C. Beneficial effect of probiotics in IBD: are peptidoglycan and NOD2 the molecular key effectors? Gut Microbes. 2011;2:280–6. doi: 10.4161/gmic.2.5.18255. [DOI] [PubMed] [Google Scholar]
- 22.Duncan SH, Louis P, Flint HJ. Lactate-utilizing bacteria, isolated from human feces, that produce butyrate as a major fermentation product. Appl Environ Microbiol. 2004;70:5810–7. doi: 10.1128/AEM.70.10.5810-5817.2004. [DOI] [PMC free article] [PubMed] [Google Scholar]
- 23.Biddle A, Stewart L, Blanchard J, Leschine S. Untangling the genetic basis of fibrolytic specialization by Lachnospiraceae and Ruminococcaceae in diverse gut communities. Diversity. 2013;5:627–40. [Google Scholar]
- 24.Burger-van Paassen N, Vincent A, Puiman PJ, et al. The regulation of intestinal mucin MUC2 expression by short-chain fatty acids: implications for epithelial protection. Biochem J. 2009;420:211–9. doi: 10.1042/BJ20082222. [DOI] [PubMed] [Google Scholar]
- 25.Lewis K, Lutgendorff F, Phan V, Soderholm JD, Sherman PM, McKay DM. Enhanced translocation of bacteria across metabolically stressed epithelia is reduced by butyrate. Inflamm Bowel Dis. 2010;16:1138–48. doi: 10.1002/ibd.21177. [DOI] [PubMed] [Google Scholar]
- 26.Peng LY, Li Z, Green RS, Holzman IR, Lin J. Butyrate enhances the intestinal barrier by facilitating tight junction assembly via activation of AMP-activated protein kinase in Caco-2 cell monolayers. J Nutr. 2009;139:1619–25. doi: 10.3945/jn.109.104638. [DOI] [PMC free article] [PubMed] [Google Scholar]
- 27.Moreno-Indias I, Cardona F, Tinahones FJ, Queipo-Ortuño MI. Impact of the gut microbiota on the development of obesity and type 2 diabetes mellitus. Front Microbiol. 2014;5:190. doi: 10.3389/fmicb.2014.00190. [DOI] [PMC free article] [PubMed] [Google Scholar]
- 28.Robertson BR, O'Rourke JL, Neilan BA, et al. Mucispirillum schaedleri gen. nov., sp. nov., a spiral-shaped bacterium colonizing the mucus layer of the gastrointestinal tract of laboratory rodents. Int J Syst Evol Microbiol. 2005;55:1199–204. doi: 10.1099/ijs.0.63472-0. [DOI] [PubMed] [Google Scholar]
- 29.Berry D, Schwab C, Milinovich G, et al. Phylotype-level 16S rRNA analysis reveals new bacterial indicators of health state in acute murine colitis. ISME J. 2012;6:2091–106. doi: 10.1038/ismej.2012.39. [DOI] [PMC free article] [PubMed] [Google Scholar]
- 30.Carbonero F, Benefiel AC, Gaskins HR. Contributions of the microbial hydrogen economy to colonic homeostasis. Nat Rev Gastroenterol Hepatol. 2012;9:504–18. doi: 10.1038/nrgastro.2012.85. [DOI] [PubMed] [Google Scholar]
- 31.Jakobsson HE, Rodríguez-Piñeiro AM, Schütte A, et al. The composition of the gut microbiota shapes the colon mucus barrier. EMBO Rep. 2015;16:164–77. doi: 10.15252/embr.201439263. [DOI] [PMC free article] [PubMed] [Google Scholar]