Abstract
A unique normalized radial pressure profile characterizes the bed of a gas‐solid vortex reactor over a range of particle densities and sizes, solid capacities, and gas flow rates: 950–1240 kg/m3, 1–2 mm, 2 kg to maximum solids capacity, and 0.4–0.8 Nm3/s (corresponding to gas injection velocities of 55–110 m/s), respectively. The combined momentum conservation equations of both gas and solid phases predict this pressure profile when accounting for the corresponding measured particle velocities. The pressure profiles for a given type of particles and a given solids loading but for different gas injection velocities merge into a single curve when normalizing the pressures with the pressure value downstream of the bed. The normalized—with respect to the overall pressure drop—pressure profiles for different gas injection velocities in particle‐free flow merge in a unique profile. © 2015 The Authors AIChE Journal published by Wiley Periodicals, Inc. on behalf of American Institute of Chemical Engineers AIChE J, 61: 4114–4125, 2015
Keywords: gas‐solid vortex reactor, multiphase flow, pressure profile, pressure drop, fluidization
Introduction
This experimental study addresses a gas‐solid vortex reactor (GSVR) because of its advantages as compared to other reactor types. Conventional fluidized bed (FB) reactors are widely used in chemical industry, especially for processes involving gas and solid (e.g., catalyst) particles. The reacting and/or carrying fluid flow, supplied from the bottom of the reactor, fluidizes the particles against gravity. Fluidization improves heat and mass transfer between gas and particles.
Although FBs have been the topic of extensive research for more than 60 years, some drawbacks, such as limited fluid velocity, bypassing at higher flow rates, particle entrainment, and increased reactor size have not been resolved completely.1 These limitations can be overcome by applying a centrifugal force, which can be significantly larger than the gravity force, thus allowing for larger gas and particle velocities than those in conventional FBs. This makes technologies involving the centrifugal force of great interest for process intensification (PI).2, 3, 4, 5, 6, 7 The fluidization quality is improved and the contact between gas and particles is better; hence gas bypassing is minimized. Feed rates can be increased resulting in a higher throughput.5 Heat and mass transfer are improved due to increased gas‐solid slip velocity in the radial direction given that particle radial velocities oscillate near zero while gas radial velocities can be high.2
One way to create the centrifugal force is to set the whole cylindrical reactor in rotation around its axis of symmetry using a rotor engine. The particle bed acquires an azimuthal velocity, which is assumed to be equal to that of the rotor and can thus be controlled arbitrarily. The gas enters radially through the porous surface of the reactor sidewall, thus bringing the bed of solid particles in a fluidized state. This rotating fluidized bed (RFB) reactor has also been studied in detail.8, 9, 10, 11, 12, 13, 14, 15, 16, 17, 18
It is important that the centrifugal force, determined by the solids azimuthal velocity, and the drag force exerted on the solids bed, determined by the gas‐solid radial slip velocity, can be controlled independently in RFBs. The first efforts to theoretically and experimentally describe the RFB mode of operation was performed by Takahashi et al.19 and Fan et al.9 Based on their experimental results on minimal fluidization conditions and on pressure drop over the bed, a model for the incipient fluidization was proposed. Both experimental results and model showed that the pressure drop over the bed increases with increasing superficial velocity of the gas for a given rotation speed. At a critical fluidization velocity, the pressure drop across the bed reaches its maximum and then decreases when the superficial gas velocity further increases above that critical value. Chen8 proposed a fundamental theory based on a local momentum balance, resulting in the concept of layer‐by‐layer fluidization. Contrary to Takahashi et al.19 and Fan et al.,9 Chen8 and several other researchers,10, 20, 21 using the model proposed by Chen,8 showed that beyond the critical fluidization velocity, the pressure drop over the bed remains constant when further increasing the gas flow.
Despite their advantages and the possibility for PI, RFBs are not very attractive for use on industrial scale, because a rotating vessel suffers from severe limitations caused by vibrational and other mechanical issues.1 Therefore, their applications are up to now limited to small‐scale setups.22, 23
Contrary to RFBs, in vortex reactors (VRs), the centrifugal force is established in a static reactor device by introducing the gas via tangential inlet slots, positioned at the cylindrical circumferential wall of the reactor. Momentum transfer from the gas to the particles sets them in rotation. The gas leaves the reactor through a central outlet, creating a vortex‐sink‐like behavior. Note that all advantages of RFBs over gravitational beds remain valid in VRs. Additionally, there is no rotor and hence no mechanically moving parts.24, 25, 26, 27, 28
Although VRs eliminate the mechanical wear as compared to the rotating vessels of RFBs, this comes in the cost of friction between the static walls and the rotating particles and gas. Next to that, higher gas flow rates are necessary, as gas is the driving force for the bed rotation. Nevertheless, considering the increased heat‐ and mass‐transfer rates, higher gas flow rates imply higher throughput as well. Another disadvantage of VRs is the fact that azimuthal and radial velocities cannot be controlled independently. As a result, a change in gas flow will affect both the centrifugal force and the drag force. This disadvantage is compensated for by the fact that VRs provide a complete and stable fluidization over a wide range of gas flow rates. As the flow rate increases, both the centrifugal and the drag force increase proportionally to the square of the flow rate that provides proper particle fluidization. In RFBs, the angular velocity, being set by the rotor, does not depend on the distance from the rotation axis. In contrast to RFBs, the angular velocity significantly grows as radial position decreases and depends on the gas flow rate in VRs. Accordingly the radial distributions of the centrifugal force are very different in RFBs and VRs. This feature provides the stable FB in a wide range of the gas flow rate in VRs. These advantages have made VRs efficient for multiple applications in chemical,29, 30, 31 heat transfer,24, 32 and drying technologies.4, 33, 34 The GSVR was studied computationally by several researchers indicating several possibilities for PI.2, 6, 35, 36 However, scaling of VRs remains challenging37 mostly due to the limited comprehension of the swirling flow characteristics and thus their commercialization is still very restricted.
Although the VR concept is well known and utilized, fundamental experimental studies of VRs are limited. Using different vortex chambers, Kochetov et al.33 investigated the effects of the aspect ratio of reactor and exhaust diameter on the VR behavior. Volchkov et al.34 explored aerodynamics, heat and mass transfer using 2–5 mm diameter wheat grains. De Wilde and de Broqueville25, 38 and De Wilde et al.3 experimentally studied the difference in fluidization between 1G‐Geldart B and 1G‐Geldart D particles. Eliaers et al.39 showed that, contrary to the gravitational field, fluidization of 1G‐Geldart C particles in a centrifugal field is possible. Ekatpure et al.28 have studied the influence of the tangential slot thickness and the particle diameter on the bed fluidization in a GSVR. Kovacevic et al.40 have investigated the influence of particle diameter, particle density, and gas injection velocity on the maximum solids capacity of a GSVR and the bed behavior. Most recently, Kovacevic et al.41 reported detailed particle image velocimetry (PIV) measurements of the radial solids velocity profiles. Detailed experimental data on the pressure variation over the bed height in a GSVR have not been reported in literature.
The present work partially fills this gap and looks for a common relation governing the radial pressure profile in a GSVR for different particle diameters, particle densities, and gas injection velocities. Measurements are made in a nonreactive, cold flow setup. Tests with two particle materials having different densities and at least three different diameters, at five different gas injection velocities are performed. A range of solid capacities (up to the maximal possible value) is explored. A model is proposed, based on previously measured particle velocity profiles,41 which allows predicting the pressure drop and the pressure profile over the bed.
Experimental Setup and Procedures
Most of the details of the experimental GSVR setup and of the procedure used to gather the data for the present study are in detail described in Kovacevic et al.40, 41 The GSVR is a cylindrical chamber positioned with a horizontal axis. The main parts of the set‐up can be seen in Figure 1a while a more detailed view of the GSVR and the solids bed can be found in Figure 1b. Air is introduced via slots in the circumferential wall with a 10° angle from its tangent. Solids are introduced in the GSVR once the gas flow is established. Due to momentum transfer from gas to solids, the solids attain an azimuthal velocity that makes them rotate and form a bed, covering the whole length, L R (Figure 1b), of the GSVR, close to the circumferential wall. Additionally, in this study pressure taps are added to measure the radial pressure profiles in the GSVR. Pressure is a large‐scale characteristic of the flow and, as the net gas flow is radially converging in the disk part of the GSVR, the most prominent pressure variations will be in the radial direction as well. Hence, gauge pressure values are measured on 12 positions along the radius at the rear end‐wall plate (Figure 1b). Milliampere output pressure sensors (Unik 5000) with temperature ranges from −55 to 125°C, a frequency response of 3.5 kHz and an accuracy of ± 0.04% of full scale are used.
Figure 1.
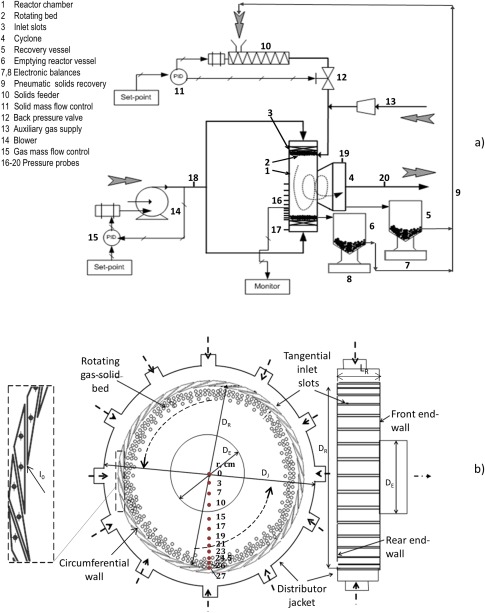
(a) Schematic diagram of the GSVR setup. (b) Detailed view of the GSVR and the location of the pressure taps at the Plexiglas end‐wall of the GSVR (Adapted from Ref. 28).
[Color figure can be viewed in the online issue, which is available at wileyonlinelibrary.com.]
Two absolute pressure sensors with a span of 80–120 kPa and 80–160 kPa are used for the pressure measurement at the center (r = 0 m) and at the circumferential wall (r = 0.27 m), respectively. Eleven differential pressure sensors with a span of −20 to 20 kPa are used for pressure drop measurements between consecutive positions located between the circumferential wall and the center. Positioning the sensors in such a way, allows recording the pressure profile along one line of constant azimuthal coordinate. The accuracy of measurements for each experiment is cross‐checked by comparing the pressure change between the two absolute sensors located at the circumferential wall and at the center and the total pressure drop measured by the differential pressure sensors. Every experiment is repeated three times. An additional cross‐check is performed by installing a differential pressure sensor (−20 to 20 kPa) between r = 0.27 m (next to the circumferential wall) and r = 0.17 m. The r = 0.17 m position is chosen because experimental observations indicate that the RFB in the bottom of the reactor is always restricted to r > 0.17 m, that is, the bed height is always less than 10 cm,40 and the highest pressure drop contribution is recorded over the bed.
A Data Acquisition Board from Microstar Laboratories, DAP840, with up to 800 k samples per second and 50 ns time resolution, is used. In the present study, measurements at a frequency of 1 kHz are performed. To limit the required computer memory and to filter out the noise, averaging is performed every 100 samples, reducing the data acquisition frequency to 10 Hz.
Gas volumetric flow rates of 0.4–0.8 Nm3/s, corresponding to gas injection velocities of 55–110 m/s, are used. It should be kept in mind that, by increasing the gas flow rate, the total momentum input is also increasing. To evaluate the influence of gas injection velocity, only the gas flow rate should be kept constant and the width of the inlet slots should be varied. This kind of study is reported by Ekatpure et al.28 In the present study, a constant slot thickness size, that is, 2 mm, is used and the influence of gas injection velocity is tested by increasing the gas flow rate. All experimental operating conditions are gathered in Table 1.
Table 1.
Operating Conditions of the GSVR
| Operating Conditions—Primary Phase (Gas) | |||||
|---|---|---|---|---|---|
| Gas injection velocity (at inlet slots) | m/s | 55, 70, 85, 100, 110 | |||
| Gas flow rate | Nm3/s | 0.4, 0.5, 0.6, 0.7, 0.8 | |||
| Gas density (25°C, 1 atm) | kg/m3 | 1.225 | |||
| Operating Conditions—Secondary Phase (Solids) | |||||
| Material | HDPE | HDPE | HDPE | PC | |
| Diameter | mm | 1 | 1.5 | 2 | 2 |
| Particle‐size distribution | mm | 0.9 ± 0.3 | 1.4 ± 0.4 | 1.8 ± 0.5 | 1.9 ± 0.6 |
| Density | kg/m3 | 950 | 950 | 950 | 1240 |
| Solids loading | kg | 2, 3, 4, maximum capacity | |||
95% confidence intervals of the particle‐size distribution are indicated.
Solids are injected in the GSVR after the gas flow is stabilized and until the desirable solids loading is reached. The maximum solids capacity for a given gas flow rate and solids kind and size is achieved when particles start to get entrained by the gas through the gas outlet. Then, the solids feeding is stopped and after steady state is reached measurements are recorded. The solids loading is measured after the experiment is finished and solids are removed from the chamber. Two different kinds of particles are used as solid phase during the experiments: high density poly‐ethylene (HDPE) and poly‐carbonate (PC). For these materials, particles with different diameters are manufactured by Gala Industries®. The particle diameter distribution is analyzed using a Malvern® Mastersizer S, from which the area‐weighted average particle diameter is calculated with a 95% confidence interval. The distributions are narrow, as shown in Table 1. The particles belong to the Geldart‐D group when operating in the gravitational field. Experiments are performed with solids capacities of 2, 3, 4 kg and at maximum solids capacity, defined as the maximum amount of solids that can be withheld in the GSVR under given operating conditions without particle entrainment by the gas flow. The maximum solids capacity depends on the gas flow rate and the particle density and size.
Results and Discussion
Pressure profile
As the gas enters the GSVR chamber from the circumferential wall almost tangentially, with a 10° angle, the azimuthal gas velocity component is significantly larger than the corresponding radial gas velocity component given that vr/vθ =tan10° = 0.176. Because the gas outlet is a cylindrical pipe, coaxial to the reactor chamber but having a smaller diameter (Figure 1b), a radially converging swirling flow is created in the disk part of the chamber. Figure 2 represents typical pressure profiles in the cold‐flow GSVR for particle‐free and particulate flows. Remark that the error bars are too small to be easily distinguished. In the near‐axis region, the pressure profile for particle‐free flow indicates the presence of backflow, which is a feature typical of flows with a strong azimuthal velocity component.42, 43, 44, 45 As a result, the pressure minimum is located away from the axis (see the solid curve in Figure 2).
Figure 2.
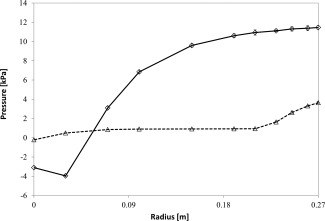
Pressure profile in the GSVR for particle‐free flow (
 ), and flow with HDPE particles (
 , ρs = 950 kg/m3, dp = 1 mm) at vg,inj = 55 m/s.
Error bars represent ± standard deviation based on three repeated experiments.
For particle‐free flow, the radial gas momentum conservation equation for incompressible fluid and with no body forces is46
| (1) |
Due to the large azimuthal‐to‐radial gas injection velocity ratio and considering axisymmetric flow and steady state, Eq. (1) can be reduced to the cyclostrophic balance (Eq. (2)), as the contributions of the other terms are negligibly small
| (2) |
Based on the particle‐free experimental pressure data, depicted in Figure 2, the gas azimuthal velocity, , profile along r is calculated from the cyclostrophic balance (Eq. (2)) and is presented in Figure 3. For these calculations, the pressure data in the range 0 m < r < 0.03 m are not used because of the backflow near the chamber axis where the cyclostrophic balance cannot be applied. As shown in Figure 3, the gas azimuthal velocity at the circumferential wall, where the gas is injected, is very close to the azimuthal component of the actual injection velocity, which is equal to 55 m/s·cos10° ≈ 54 m/s. The value calculated from the pressure measurements is slightly lower than the nominal azimuthal injection component. This difference is physically reasonable as the gas velocity slightly drops after injection due to the friction with the static circumferential and end‐walls inside the chamber.
Figure 3.
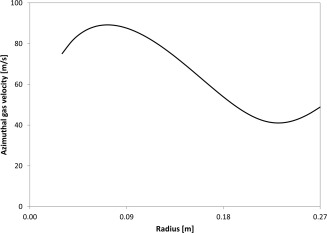
Estimate of the radial azimuthal gas velocity profile based on the experimental data for pressure and the cyclostrophic balance (Eq. 2) for particle‐free flow at v g,inj = 55 m/s.
As r decreases, more specifically in the radial positions between 0.23 m < r < 0.27 m, decreases due to the angular momentum loss, which at these radii seems to be significant. This loss is due to the local disturbance and nonuniformity of the flow caused by the gas injection in the chamber. Phenomena such as flow separation and reattachment due to the injection and expansion of the gas at high velocities are possible. As further decreases, the flow gets developed and the momentum conservation effect becomes more prominent as momentum losses diminish. Hence, increases.
When particles are introduced, the flow pattern completely changes and the velocity magnitude significantly decreases, as also observed by Anderson et al.24 and Volchkov et al.34 To make the particles rotate and to compensate the losses, caused by particle‐wall friction, the gas must transfer most of its initial angular momentum to the particles. Due to this gas‐to‐particle momentum transfer, particles accelerate until they achieve a velocity which is nearly equal to the reduced azimuthal gas velocity. This feature is confirmed by preliminary computational fluid dynamics (CFD) simulations.
PIV measurements41 show that the azimuthal particle velocity in particulate flow is almost an order of magnitude lower as compared to the gas injection velocity and to the calculated azimuthal gas velocity in particle‐free flow. As a consequence, the total pressure drop and the pressure radial distribution are very different in the particle‐free and particulate flows, as illustrated in Figure 2. In particle‐free flow, the pressure drop is due to the cyclostrophic balance (Eq. (2)), while friction and radial velocity contributions are comparatively small. In particulate flow, the maximum azimuthal gas velocity value is close to the azimuthal particle velocity, that is, nearly one‐tenth of the value in particle‐free flow. Accordingly, the centrifugal acceleration in particulate flow is about one‐hundredth of the value in particle‐free flow. For this reason, the contribution of the gas centrifugal force to the pressure drop significantly decreases as compared to that in particle‐free flow. This explains the seemingly paradoxical feature (Figure 2) that the addition of particles reduces the total pressure drop in the GSVR. Conversely, due to the two‐phase interaction a drag force emerges and most of the pressure drop occurs in the particle bed. As a result, the cyclostrophic balance (Eq. (2)) does not hold for particulate flow mostly because in the gas momentum balance the interphase drag contribution has to be accounted for as well. Particles form a RFB and gas‐solid drag has an important impact on pressure changes, as explained in more detail in the theoretical model. In addition, the azimuthal gas velocity decreases due to the momentum exchange with the solids and hence the gas centrifugal acceleration term becomes less important.
Downstream of the bed, the pressure drops very slowly until the exhaust (Figure 2). As already mentioned, the gas azimuthal velocity significantly reduces in the presence of particles, as compared to particle‐free flow. Therefore, the backflow is significantly restricted or even eliminated. Accordingly, at the axis, the pressure now reaches its minimum value, which is smaller in the particle‐free flow than in the particulate flow (Figure 2). The measurements verify that the pressure value at the axis increases for higher bed mass or lower gas injection velocity. Given that a higher bed mass or a lower gas injection velocity results in a lower gas velocity in the vortex chamber, the latter observation confirms that backflow diminishes for lower gas velocities in the GSVR.
Pressure Drop Over the Bed
For reasons of comparison, Figure 4 presents the pressure drop data over the particle bed in an RFB reactor obtained by Fan et al.9 and Nakamura and Watano.20 Several groups of researchers8, 9, 12, 19, 20, 21 studied the RFB and observed an increase of the pressure drop over the bed with increasing superficial gas velocity. At a critical superficial gas velocity, the bed becomes completely fluidized and the pressure drop over the bed attains a maximum value. However, for superficial gas velocities higher than the critical gas velocity, the results obtained by the different research groups become contradictory to each other. Fan et al.9 and Takahashi et al.19 reported a decreasing pressure drop over the bed with increasing superficial gas velocity (Figure 4a). Conversely, Chen8, Zhu et al.21 as well as Nakamura and Watano20 reported that the pressure drop over the bed remains constant with increasing superficial gas velocity (Figure 4b).
Figure 4.
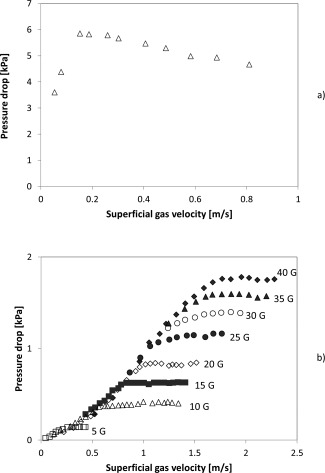
Experimentally measured bed pressure drop profiles in RFBs reported by (a) Fan et al.;9 (b) Nakamura and Watano. 20
Contrary to the RFB, a separate control over radial and azimuthal velocities is not possible in the GSVR, as discussed in Introduction. The control variable determining both the azimuthal and radial particle velocity components for a given inlet slot angle is the gas injection velocity. Therefore, when the gas injection velocity increases in the GSVR, the centrifugal and drag forces both increase, implying that lines of constant centrifugal acceleration and varying superficial gas velocity as presented in Figure 4b for RFBs cannot be produced in a GSVR.
Figure 5a presents the pressure drop as a function of the gas injection velocity for HDPE (ρ s = 950 kg/m3) particles with a diameter of 1 mm, at different solids capacities, that is, different bed masses. The solids capacity is varied from 2 kg to the maximum solids capacity of the GSVR at the given gas injection velocity. Kovacevic et al.40 showed that this maximum solids capacity depends on the gas injection velocity as well as the particle properties. The pressure drop over the bed increases with increasing gas injection velocity.
Figure 5.
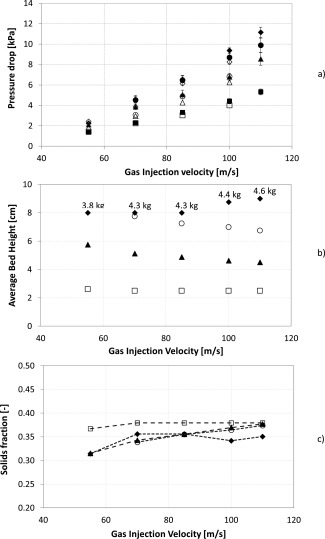
(a) Measured (full symbols) and calculated (empty symbols) pressure drop over the rotating bed, (b) measured average bed height, and (c) corresponding calculated solids fraction. HDPE (ρ s = 950 kg/m3), d p = 1 mm.
At different solids capacities: 2 kg (□); 3 kg (Δ); 4 kg (○); Max capacity (⋄). The maximum capacity is indicated with labels for each gas injection velocity in Figure 5b. Error bars represent ± standard deviation based on three repeated experiments. A gas injection velocity change indicates a change of gas flow rate, given that the slot thickness is constant in all experiments.
As previously mentioned, increasing the gas injection velocity in the GSVR implies increasing at the same time both the azimuthal gas and solid velocities and hence the centrifugal acceleration in the GSVR. It can be observed from Figure 4b that the pressure drop over the completely FB in an RFB increases with increasing both the centrifugal acceleration and superficial gas velocity at the same time. Thus, the observations for the pressure drop in an RFB and a GSVR qualitatively correspond.
An averaged void fraction, ε, is estimated based on the visually measured bed height shown in Kovacevic et al.40 and the total bed mass measured
| (3) |
The void fractions calculated using Eq. (3) show that for all operating conditions studied the average solids fraction value varies from 0.2 to 0.5. This implies that for all operating conditions the average solids fraction is significantly lower than 0.6, which corresponds to closely packed bed conditions. From the PIV images previously recorded,41 it is observed that the particles are in general not in contact with each other. Hence, the bed is considered fluidized for all operating conditions. Remark that only average solids fractions are reported implying that the local solids fractions can vary significantly from the average value. Given the dependence of drag and centrifugal force on the radial position, the bed is generally observed to have a higher solids fraction close to the circumferential wall and lower close to the edge of the bed. Figures 5b, c present the change of bed height and solids fraction with gas injection velocity. As the latter increases, it is experimentally observed that the bed becomes in general more packed, that is, the bed height decreases (Figure 5b) and the average solids fraction increases (Figure 5c) tending to a maximum limit. The gas and the bed also rotate faster and, as expected, the pressure drop increases with higher gas injection velocity. As mentioned above, the maximum solids capacity changes with gas injection velocity. The corresponding values of maximum solids capacity are indicated in Figure 5b. Figure 5a also shows that the pressure drop over the bed in the GSVR increases with increasing solids capacity. This behavior is expected, as the pressure drop is directly related to the bed height, which is increasing with increasing solids capacity. Note that at 55 m/s gas injection velocity, the maximum solids capacity is less than 4 kg, that is, 3.8 kg.
Figure 6 shows the influence of particle properties, such as solid density and particle diameter, on the pressure drop over the bed in the GSVR. To assess the influence of the particle properties, experiments at the same solids capacity, 4 kg, are compared. Analogous results are obtained for 2 kg, 3 kg, and at the maximum solids capacity.
Figure 6.
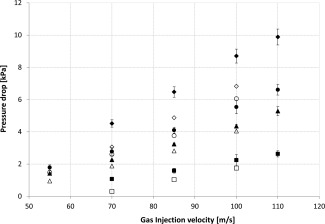
Measured (full symbols) and calculated (empty symbols) pressure drop over the bed for HDPE (ρ s = 950 kg/m3) with d p = 1 mm (⋄); 1.5 mm (○); 2 mm (Δ) and for PC (ρ s = 1240 kg/m3) with d p = 2 mm (□).
Solids capacity: 4 kg. Error bars represent the standard deviation between three repeated experiments. A gas injection velocity change indicates a change of gas flow rate, given that the slot thickness is constant in all experiments.
The influence of particle diameter is tested using HDPE (950 kg/m3) particles with three different diameters: 1, 1.5, and 2 mm. By decreasing the particle diameter, the pressure drop over the bed increases. This agrees with the Ergun Equation or the Gidaspow drag model47, 48 where the particle diameter is located in the denominator of the drag contribution to pressure drop. The physical reason is that total gas‐particle interface area, S p, increases as d p decreases at a fixed total particle volume V p
| (4) |
Accordingly, the drag increases. Furthermore, by decreasing the particle diameter, the azimuthal particle velocity increases, as shown by Kovacevic et al.,41 and consequently the solids centrifugal contribution to the pressure drop also increases (Eq. (8)). This explains the increase in the pressure drop over the bed with decreasing particle diameter.
The effect of solid density is shown by comparing the experimental results obtained using HDPE (950 kg/m3) and PC (1240 kg/m3) particles with a diameter of 2 mm. From Figure 6, it is observed that with increasing solid density the pressure drop over the bed decreases. The solid density directly affects the centrifugal contribution to the pressure drop over the bed. It would thus be expected that the pressure drop over the bed increases with increasing particle density at a fixed azimuthal velocity. However, the azimuthal particle velocity, which is squared in the centrifugal force, is experimentally observed to decrease considerably with increasing density, as shown by Kovacevic et al.41 In addition, Kovacevic et al.40 observed that the void fraction is higher when PC particles are used instead of HDPE particles. The drag contribution to the pressure drop over the bed is very sensitive to the void fraction. The higher void fraction of the PC particles bed than that of the HDPE particles bed results in less drag and therefore lower pressure drop over the bed. As the experimental results clearly show, the combination of all the effects described above results in a decreasing pressure drop with increasing solid density.
Theoretical Model
As previously discussed, the cyclostrophic balance (Eq. (2)) is used to calculate the pressure profile in the GSVR particle‐free flow. However, when particles are rotating and a bed is formed in the chamber, the interaction between the two phases has to be accounted for and the radial gas momentum balance considering zero axial gas velocity becomes49
| (5) |
Given that the gas enters at the circumferential wall and leaves through the center of the GSVR, the radial gas velocity, , can be approximated using the interstitial gas velocity. In the disk part of the GSVR where the bed is located, the interstitial gas velocity is calculated based on the mass conservation as
| (6) |
where U g, r is the superficial gas velocity. The void fraction is considered constant along r. Thus, after rearrangement Eq. (5) can be written as
| (7) |
The solid phase radial momentum balance has to be considered as well
| (8) |
where F s is the force exerted on the bed by the circumferential wall. End‐wall friction and particle‐particle interactions are not accounted for in the above formulations. It is expected that their effect will not be significant in the radial direction, as the radial solids velocity is close to zero. They might, however, become important when a flow pattern with intense bubbling in the bed is observed, as instantaneous velocity fluctuations in the radial direction are expected then. The normal solids stress gradient vanishes in a FB,8 while the solids radial velocity is considered zero, as previously mentioned, given that the particles rotate without leaving the GSVR. Substituting Eq. (7) in Eq. (8) and rearranging yields
| (9) |
The pressure drop over the bed can be calculated based on Eqs. (7) and (9) as
| (10) |
The azimuthal particle velocity values along a radius in the GSVR have been experimentally determined using PIV.41 The pressure drop between two neighboring radial positions is calculated by integrating Eq. (10). The azimuthal gas velocity is assumed to be nearly equal to the azimuthal particle velocity, , as previously discussed. The integral at the right‐hand side is approximated by applying the midpoint rule, resulting in
| (11) |
Using the pressure measured at the circumferential wall as the first point pressure value, Pr 1, and the average solids fraction calculated by Eq. (3), the pressure profile over the bed is calculated using Eq. (11). Although a homogeneously FB is considered, as discussed in Kovacevic et al.41 bubbles might appear under given operating conditions. Hence, the calculated average solids fraction might be implicitly reduced in case the bed height is affected by the bubbles. The force exerted by the circumferential wall on the bed acts only locally and becomes zero downstream of the wall. Thus, it induces a pressure drop in the immediate vicinity of the circumferential wall, the effect of which is already included in the first pressure measurement, Pr 1, at the circumferential wall. As a consequence, there is no need to include F s in Eq. (11). It is implicitly accounted for by using the first pressure value Pr 1. The calculated pressure over the bed and the measured pressure in the GSVR are presented in Figure 7 for HDPE particles at various gas injection velocities, varying from 55 to 110 m/s for 2 and 4 kg solids capacity and for 1 and 1.5 mm particles, respectively. As Eq. (11) can be used only over the bed, the calculated values are limited to the radial positions where the bed is located. The agreement between measured and calculated values is observed to be satisfactory: the deviation is less than 25%. Relatively good agreement has been observed for most particle diameters and solids capacities tested. Calculated pressure drop values are included in Figures 5 and 6. The agreement is generally better for higher injection velocities and lower bed masses, while it becomes less satisfactory as the bed mass increases and/or the azimuthal particle velocity decreases, resulting in a lower bed centrifugal acceleration. Under the latter conditions, the centrifugal force decreases as compared to the drag force and thus bubbling becomes more pronounced.41 In a bubbling bed, the particle‐end‐wall friction and particle‐particle interactions in radial direction can no longer be assumed negligible in Eq. (8). Correlations for particle‐wall friction suggested for riser or downer flows50, 51 have been applied using the solids fluctuating velocity instead of the average radial solids velocity, which is close to zero. However, the effect of including this contribution on the calculated values is negligible. Even though gravity can affect the fluidization in a GSVR operating with horizontal axis of symmetry,40 it cannot be included in this model as its effect changes with azimuthal position. CFD simulations are currently in progress to calculate the pressure profiles with more accuracy. CFD will also give the opportunity to account for the variation of the solids fraction in the bed, contrary to the present study where only an averaged value was used. Nevertheless, the present analytical models are considered to be as important as numerical modeling to gain insight into and to have a better understanding of the significance of the different contributions on the momentum balances governing the flow.
Figure 7.
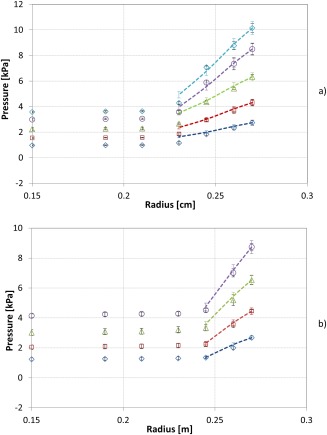
Profiles of measured pressure in the GSVR (symbols) and calculated pressure over the bed using Eq. 11 (lines) for HDPE (ρ s = 950 kg/m3); (a) d p = 1.5 mm and 4 kg bed mass, (b) dp = 1 mm and 2 kg bed mass at 55 m/s (⋄); 70 m/s (□); 85 m/s (Δ); 100 m/s (○); 110 m/s (x).
The circumferential wall is at r = 0.27 m. Black error bars represent the standard deviation for measured values between three repeated experiments. Colored error bars represent the ±5% deviation from the calculated values. [Color figure can be viewed in the online issue, which is available at wileyonlinelibrary.com.]
The drag force in a densely FB can be estimated using the Gidaspow model,49 where the Ergun equation is used for solid fractions higher than 0.2. Given that the average solids fraction measured in the GSVR varies between 0.2 and 0.5, the drag force exerted on the bed can be described as
| (12) |
where are given by
| (13) |
| (14) |
The particles are considered spherical. The average void fraction (Eq. (3)) is used to estimate the drag force. By comparing the latter estimated values to the values obtained by the right‐hand side of Eq. (9), the effect of the circumferential wall force, F s, on the bed is estimated. The data calculated by Eq. (12) and the right‐hand side of Eq. (9) are averaged over the bed height and compared. Table 2 provides some indicative results of the calculated values for each contributing term in Eqs. (9) and (12). All terms are normalized with respect to the total value calculated using the right‐hand side of Eq. (9). The linear, with respect to U g, r, drag contribution is an order of magnitude smaller than the corresponding quadratic, with respect to U g, r, drag term in Eq. (12). Furthermore, with increasing gas injection velocity the quadratic term becomes, as expected, more dominant over the linear term in the Ergun formula. Considering that the bed is fluidized, the main pressure drop contribution is expected to be the “weight” of the bed in the centrifugal field. Table 2 indicates that the centrifugal contribution of the solids phase, which can be interpreted as the “weight” of the bed in the centrifugal field, is indeed the dominant contribution. The centrifugal force and radial flow contributions of the gas phase are in all cases very small and can be neglected. At maximum solids capacity, the drag and the solids centrifugal contributions differ by less than 10%, indicating that at maximum solids capacity conditions these two forces are practically balanced. Remark that during the experiments no particle losses are observed, in accordance with the definition of maximum solids capacity, and only further addition of particles will result in particle entrainment. Consequently at maximum solids capacity, the circumferential wall effect on the bed is practically negligible. The deviations between the drag and centrifugal solids contributions can be due to the use of the average void fraction, as calculated from Eq. (3), when applying the Ergun equation. The void fraction estimation is not accurate, as the bed height is only visually determined. Even though the bed height changes with the azimuthal position as described by Kovacevic et al.,40 in this study the average bed height over all azimuthal positions is considered. Additionally, given that the Ergun equation is very sensitive to the void fraction and the latter changes considerably with the radial position, acquiring the void fraction profile along the radius could yield more accurate results. The solids velocities used in the calculations are recorded close to the wall of the chamber, but as discussed in Dvornikov and Belousov52 and De Wilde37 the velocities vary with axial distance and are lower at the wall. This also contributes to the deviation between the results of Eqs. (9) and (12) (Table 2). At lower solids capacity, for example 2 kg, the centrifugal solids contribution outweighs the drag force calculated from Ergun equation, indirectly confirming that more particles can be added to the bed before particle entrainment by the gas flow starts due to drag force. This shows that the circumferential wall effect on the bed is crucial at limited capacity conditions and that the presence of the wall ensures that the bed stays in the GSVR. Similar results are also obtained for the other operating conditions.
Table 2.
Contributions Calculated Using Ergun Eq. 12 and the Right‐Hand Side of Eq. 9
| V inj (W s,max) (m/s) ([kg]) | Ergun Equation (Eq. (12)) | Radial Momentum Balance (Eq. (9)) | |||||||
|---|---|---|---|---|---|---|---|---|---|
| Linear Contribution | Quadratic Contribution | Total | Centrifugal Contributions | Mean Gas Flow Contribution | Total | ||||
| Solids | Gas | ||||||||
|
|
|
|
|
|
|||||
| HDPE—1.5 mm—Maximum Solids Capacity | |||||||||
| 55 (4.8) | 0.099 | 0.838 | 0.94 | 1.004 | 0.002 | 0.002 | 1.00 | ||
| 70 (5.2) | 0.080 | 0.853 | 0.93 | 1.002 | 0.002 | 0.000 | 1.00 | ||
| 85 (5.4) | 0.065 | 0.850 | 0.92 | 1.004 | 0.002 | 0.002 | 1.00 | ||
| 100 (5.3) | 0.059 | 0.904 | 0.96 | 1.004 | 0.002 | 0.002 | 1.00 | ||
| 110 (5.4) | 0.062 | 1.005 | 1.07 | 1.004 | 0.002 | 0.002 | 1.00 | ||
| HDPE—1 mm—2 kg | |||||||||
| 55 | 0.062 | 0.331 | 0.39 | 1.007 | 0.005 | 0.002 | 1.00 | ||
| 70 | 0.056 | 0.368 | 0.42 | 1.008 | 0.006 | 0.002 | 1.00 | ||
| 85 | 0.051 | 0.402 | 0.45 | 1.008 | 0.006 | 0.002 | 1.00 | ||
| 100 | 0.045 | 0.421 | 0.47 | 1.008 | 0.006 | 0.002 | 1.00 | ||
All terms are normalized with respect to the total value calculated from the right‐hand side of Eq. (9). A gas injection velocity change indicates a change of gas flow rate, given that the slot thickness is constant in all experiments.
Self‐similarity
As mentioned in Introduction, a distinct feature of VRs, compared with conventional FBs and RFBs, is that both the centrifugal and the drag forces depend in a similar way on the gas flow rate.37 Moreover, as it will be shown below, both particle‐free and particulate flows show self‐similarity as the flow rate varies.
Particle‐Free Flow
Figure 8 depicts the pressure radial profile in the particle‐free GSVR flow for a gas injection velocity of 55 and 70 m/s. The pressure data, as those presented in Figure 8a, merge into a single curve in Figure 8b where the normalized pressure, (P − P a)/(P o − P a), is plotted; P a is the atmospheric pressure and P o is the pressure value at circumferential wall (r = R = 0.27 m). This merging shows the self‐similarity of the particle‐free GSVR flow.
Figure 8.
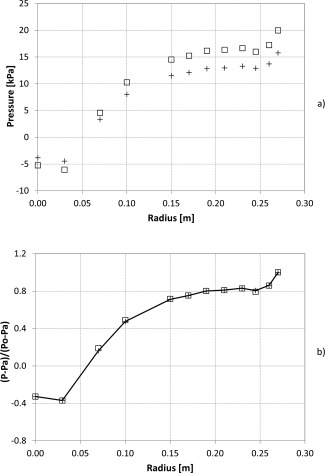
Pressure (a) and normalized pressure (b) profiles in the radial direction in the particle‐free GSVR flow at injection velocity of 55 (+) and 70 (□) m/s.
Particulate Flow
Figure 9 depicts the radial pressure profile in the particulate GSVR flow for gas injection velocities in the range of 55–110 m/s. The pressure data for a given type of particles and a given solids loading, presented in Figure 9a, nearly merge into a single curve in Figure 9b where the normalized pressure, (P − P m)/(P o − P m), is plotted; P m is the pressure close to half the radius of the GSVR (at r = 0.15 m), that is downstream of the bed where the pressure only slightly changes. This merging illustrates the self‐similarity of the particulate GSVR flow.
Figure 9.
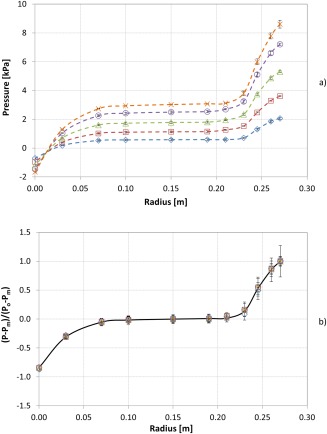
Pressure (a) and normalized pressure (b) profiles in the radial direction in the particulate GSVR flow for HDPE (ρs = 950 kg/m3), dp = 2 mm, 4 kg solids capacity at gas injection velocities of 55 m/s (
 ); 70 m/s (
 ); 85 m/s (
 ); 100 m/s (
 ); 110 m/s (
×
).
A gas injection velocity change indicates a change of gas flow rate, given that the slot thickness is constant in all experiments. [Color figure can be viewed in the online issue, which is available at wileyonlinelibrary.com.]
Figure 9 reveals that most of the pressure is lost over the particle bed (0.22 m < r < 0.27 m) and in the exhaust region (0 < r < 0.075 m), while pressure is nearly invariant in the particle‐free disk region in‐between. A similar merging of experimental data for this range of gas injection velocities is observed when changing the particle diameter, the bed mass and/or the solid density. Naturally, the bed thickness and the normalized pressure drop within the bed differ when changing the aforementioned control variables. Nevertheless, all pressure profiles within the particle bed merge for all control variables if the proper normalized parameters are used as it is shown next.
Particle Bed
Within the particle bed, the experimental results are plotted in terms of a normalized pressure and a normalized radial coordinate
| (15) |
| (16) |
Here, the subscripts “o” and “i” denote the outer and inner boundary of the particle bed, respectively. The outer boundary, r o = R = 0.27 m, is common for all data, while the inner boundary, r i, depends on particle diameter, bed mass, and solid density, as discussed. Given that the radial positions of the pressure taps are fixed and that the pressure downstream of the bed does not significantly change, as it is shown in Figures 2, 7, and 9, P i and r i correspond to the last measuring point in the bed before the pressure change becomes insignificant. Figure 10 reveals that data values gathered under a wide range of operating conditions, including different materials, particle diameters, and solids capacities, tested at different gas injection velocities, merge into a single curve when presented using these normalized variables. The curve can be approximated by a straight line, with a slope of 1. The relative data scattering is unavoidable due to the limited accuracy of the measurements. Nevertheless, the values for all experiments are found to deviate less than 20% from that line. Even this limited merging is valuable because it will allow making a satisfactory prediction of energy consumption in industrial‐size reactors.
Figure 10.
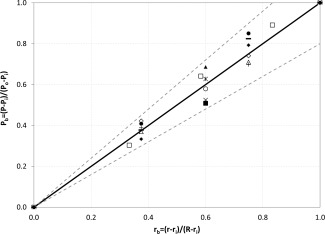
Normalized pressure profile in the bed as a function of normalized radial coordinates for HDPE (950 kg/m3): 1 mm, 2 kg, 85 m/s (○);1.5 mm, 2 kg, 55 m/s (▪); 1.5 mm, 3 kg, 70 m/s (Δ); 1.5 mm, 3 kg, 110 m/s (+); 1.5 mm, 4 kg, 55 m/s (⋄); 1.5 mm, maximum capacity, 70 m/s (□); 2 mm, 2 kg, 70 m/s (∗); and for PC (1240 kg/m3), 2 mm: 2 kg, 55 m/s (×); 3 kg, 70 m/s (▲); 4 kg, 70 m/s (♦); 4 kg, 100 m/s (•); maximum capacity, 70 m/s (−).
The continuous line represents the fitting line P b = r b. Dotted lines represent standard deviation of ±20%. A gas injection velocity change indicates a change of gas flow rate, given that the slot thickness is constant in all experiments.
The relation P b = r b illustrates an important physical feature: the radial pressure gradient is nearly invariant inside the bed. Merging all experimental data, as depicted in Figure 10, indicates that the normalized pressure profile within the bed remains nearly the same over a wide range of the gas injection velocities and other parameters. As the bed mass increases, approaching to the maximum solids capacity, the structure of the FB transforms from a dense to a bubbling FB.41 It is interesting that even this significant modification of the bed behavior practically does not change the normalized pressure profile. This feature is specific for the GSVR. In FBs and RFBs, where the gravitational and the centrifugal accelerations, respectively, are fixed, the bed structure radically varies from nonfluidized over partially fluidized to completely fluidized, and finally particles are entrained, as gas injection velocities increase. In contrast to conventional FBs and RFBs, the high acceleration gradient with radial position due to the intense interaction and momentum exchange between the gas and solid phase enables the particle self‐arrangement in the GSVR, making the flow stable and relatively invariant as the gas flow rate increases.
Conclusions
Experimental research in a cold flow pilot‐scale GSVR is performed over a range of operating conditions.
For the limiting case of particle‐free flow, the radial momentum conservation equation reduces to the cyclostrophic balance. This has been verified by calculating the azimuthal gas velocity near the circumferential wall using the cyclostrophic balance and the measured pressure profile. The calculated azimuthal gas velocity is close to the azimuthal gas injection velocity. When particles are introduced in the reactor significant momentum transfer from the gas to the particles takes place, making them rotate and balancing the particle‐wall friction. As a result, the azimuthal gas velocity magnitude decreases by an order of magnitude resulting in a significantly lower pressure drop in the GSVR. When increasing the bed mass and/or decreasing particle diameter, the total pressure drop over the bed increases. With increasing solid density, the pressure drop over the bed decreases, while it increases with increasing gas injection velocity.
The pressure drop is calculated based on the radial momentum balances for both phases using previously measured particle velocity profiles. The solids centrifugal force, or the “weight” of the bed in the centrifugal field, is the main contribution in the pressure drop, while the other terms can be neglected, as their contribution sums up to less than 1%.The calculated pressure drops agree fairly well with experimentally measured data. Deviations are less than 25%. The Gidaspow model is used for an estimate of the drag force. The quadratic term with respect to the superficial gas velocity in the Gidaspow model is one order of magnitude higher than the corresponding linear term. Combining the radial momentum balances of the two phases and the drag force estimated, the contribution of the force of the circumferential wall on the bed is evaluated. The latter is negligible at maximum solids capacity, but is important at lower bed masses. At maximum bed capacity the drag force almost equals the centrifugal force of the bed with deviations less than 10%. The normalized pressure profiles in the particle‐free and particulate GSVR flows are independent of the gas flow rate in the range studied. A unique normalized radial pressure profile over the bed of a GSVR is observed; the radial pressure profile over the bed approximately follows the relation (P − P i)/(P o − P i) = (r − r i)/(R − r i) for all gas injection velocities, particle densities, and particle diameters that were tested with deviations of experimental data less than 20%.
Notation
- dp
particle diameter, m
- Gf
gas volumetric flow rate, Nm3/s
- h
bed height, m
- FD
radial drag force per unit volume, N/m3
- LR
vortex chamber length, m
- P
total gauge pressure, Pa
- Pa
atmospheric pressure, Pa
- Pb
normalized pressure
- Pi
gauge pressure at the inner edge of the bed, Pa
- Pm
gauge pressure at r ≈ R/2, Pa
- Po
gauge pressure at the outer edge of the bed, that is, at r = R, Pa
gauge pressure at radial coordinate, rn, Pa
- r
radial position, m
- rb
normalized radius
- ri
radial position of the inner edge of the bed, m
- ro
radial position of the outer edge of the bed, m
- R
GSVR radius, m
- Sp
total gas‐particle interface area, m2
- t
time, s
gas injection velocity, m/s
radial gas velocity, m/s
azimuthal gas velocity, m/s
radial solids velocity, m/s
azimuthal solids velocity, m/s
local azimuthal particle velocity, m/s
- Ug,r
superficial gas velocity, m/s
- Vp
total particles volume, m3
- Ws
mass of the bed, kg
Greek symbols
- ε
void fraction
- εs
solids volume fraction
- θ
azimuthal coordinate, °
- μg
gas dynamic viscosity, Pa s
- ρg
gas density, kg/m3
- ρs
solids density, kg/m3
- σr
normal particle stress, Pa
drag coefficient, kg/m3s
drag coefficient, kg/m4
Abbreviations
- GSVR
gas‐solid vortex reactor
- FB
fluidized bed
- HDPE
high density poly‐ethylene
- PC
polycarbonate
- PI
process intensification
- RFB
rotating fluidized bed
- VR
vortex reactor
Acknowledgment
The authors acknowledge financial support from the “Long Term Structural Methusalem Funding by the Flemish Government” and from the European Research Council under the European Union's Seventh Framework Program FP7/2007‐2013 ERC grant agreement n° 290793.
Literature Cited
- 1. Zhang W. A review of techniques for the process intensification of fluidized bed reactors. Chin J Chem Eng. 2009;17(4):688–702. [Google Scholar]
- 2. Ashcraft RW, Heynderickx GJ, Marin GB. Modeling fast biomass pyrolysis in a gas–solid vortex reactor. Chem Eng J. 2012;207–208:195–208. [Google Scholar]
- 3. De Wilde J, Habibi A, de Broqueville A. Experimental and numerical study of rotating fluidized beds in a static geometry. Int J Chem React Eng. 2007;5:A106. [Google Scholar]
- 4. Kochetov LM, Sazhin BS, Karlik EA. Hydrodynamics and heat exchange in vortex drying chambers. Khimicheskoe i Neftyanoe Mashinostroenie. 1969;9:10–11. [Google Scholar]
- 5. Quevedo J, Pfeffer R, Shen Y, Dave R, Nakamura H, Watano S. Fluidization of nanoagglomerates in a rotating fluidized bed. AIChE J. 2006;52(7):2401–2412. [Google Scholar]
- 6. Rosales Trujillo W, De Wilde J. Fluid catalytic cracking in a rotating fluidized bed in a static geometry: a CFD analysis accounting for the distribution of the catalyst coke content. Powder Technol. 2012;221:36–46. [Google Scholar]
- 7. Volchkov EP, Dvornikov NA, Yadykin AN. Characteristic features of heat and mass transfer in a fluidized bed in a vortex chamber. Heat Transf Res. 2003;34:486–498. [Google Scholar]
- 8. Chen Y‐M. Fundamentals of a centrifugal fluidized bed. AIChE J. 1987;33(5):722–728. [Google Scholar]
- 9. Fan LT, Chang CC, Yu YS, Takahashi T, Tanaka Z. Incipient fluidization condition for a centrifugal fluidized bed. AIChE J. 1985;31(6):999–1009. [Google Scholar]
- 10. Kao J, Pfeffer R, Tardos GI. On partial fluidization in rotating fluidized beds. AIChE J. 1987;33(5):858–861. [Google Scholar]
- 11. Kroger DG, Abdelnour G, Levy EK, Chen J. Particle distibution and mixing in a centrifugal fluidized bed In: Grace JR, Matsen JM, editors. Fluidization. New York: Plenum Press, 1980:453. [Google Scholar]
- 12. Kroger DG, Levy EK. Flow characteristics in packed and fluidized rotating beds. Powder Technol. 1979;24(1):9–18. [Google Scholar]
- 13. Qian G‐H, Bágyi I, Burdick IW, Pfeffer R, Shaw H, Stevens JG. Gas–solid fluidization in a centrifugal field. AIChE J. 2001;47(5):1022–1034. [Google Scholar]
- 14. Qian GH, Bágyi I, Pfeffer R, Shaw H, Stevens JG. A parametric study of a horizontal rotating fluidized bed using slotted and sintered metal cylindrical gas distributors. Powder Technol. 1998;100(2–3):190–199. [Google Scholar]
- 15. Qian GH, Bágyi I, Pfeffer R, Shaw H, Stevens J. Particle mixing in a rotating fluidized bed: inferences about the fluidized state. AIChE J. 1999;45:1401–1410. [Google Scholar]
- 16. Qian GH, Burdick IW, Pfeffer R, Shaw H, Stevens JG. Soot removal from diesel engine exhaust using a rotating fluidized bed filter. Adv Environ Res. 2004;8(3–4):387–395. [Google Scholar]
- 17. Watano S, Imada Y, Hamada K, Wakamatsu Y, Tanabe Y, Dave RN, Pfeffer R. Microgranulation of fine powders by a novel rotating fluidized bed granulator. Powder Technol. 2003;131(2–3):250–255. [Google Scholar]
- 18. Watano S, Nakamura H, Hamada K, Wakamatsu Y, Tanabe Y, Dave RN, Pfeffer R. Fine particle coating by a novel rotating fluidized bed coater. Powder Technol. 2004;141(3):172–176. [Google Scholar]
- 19. Takahashi T, Tanaka Z, Itoshima A, Fan LT. Performance of a rotating fluidized bed. J Chem Eng Jpn. 1984;17(2):333–336. [Google Scholar]
- 20. Nakamura H, Watano S. Numerical modeling of particle fluidization behavior in a rotating fluidized bed. Powder Technol. 2007;171(2):106–117. [Google Scholar]
- 21. Zhu C, Lin CH, Qian GH, Pfeffer R. Modeling of the pressure drop and flow field in a rotating fluidized bed. Chem Eng Commun. 2003;190(9):1132–1154. [Google Scholar]
- 22. Saunders JH. Particle entrainment from rotating fluidized beds. Powder Technol. 1986;47(3):211–217. [Google Scholar]
- 23. Wong WY, Lu Y, Nasserzadeh VS, Swithenbank J, Shaw T, Madden M. Experimental investigation into the incineration of wool scouring sludges in a novel rotating fluidised bed. J Hazard Mater. 2000;73(2):143–160. [DOI] [PubMed] [Google Scholar]
- 24. Anderson L, Hasinger S, Turman B. Two‐component vortex flow studies of the colloid core nuclear rocket. J Spacecr. 1972;9:311–317. [Google Scholar]
- 25. Van engelandt G, De Wilde J, Heynderickx GJ, Marin GB. Experimental study of inlet phenomena of 35° inclined non‐aerated and aerated Y‐inlets in a dilute cold‐flow riser. Chem Eng Sci. 2007;62(1–2):339–355. [Google Scholar]
- 26. De Wilde J, de Broqueville A. Experimental investigation of a rotating fluidized bed in a static geometry. Powder Technol. 2008;183(3):426–435. [Google Scholar]
- 27. Dutta A, Ekatpure RP, Heynderickx GJ, de Broqueville A, Marin GB. Rotating fluidized bed with a static geometry: guidelines for design and operating conditions. Chem Eng Sci. 2010;65(5):1678–1693. [Google Scholar]
- 28. Ekatpure RP, Suryawanshi VU, Heynderickx GJ, de Broqueville A, Marin GB. Experimental investigation of a gas–solid rotating bed reactor with static geometry. Chem Eng Process: Process Intensif. 2011;50(1):77–84. [Google Scholar]
- 29. Kuzmin AO, Pravdina MK, Yavorsky AI, Yavorsky NI, Parmon VN. Vortex centrifugal bubbling reactor. Chem Eng J. 2005;107(1–3):55–62. [Google Scholar]
- 30. Loftus PJ, Stickler DB, Diehl RC. A confined vortex scrubber for fine particulate removal from flue gases. Environ Prog. 1992;11(1):27–32. [Google Scholar]
- 31. Ryazantsev AA, Malikov AS, Batoeva AA, Faddeenkova GA. Liquid‐phase oxidation of hydrogen sulphide in centrifugal bubbling apparatus. Russ J Appl Chem. 2007;80:1544–1548. [Google Scholar]
- 32. Tang YS, Stefanko JS, Dickson PW, Drawbaug D. Engineering study of colloid‐fueled reactor concept. J Spacecr. 1971;8(2):129–133. [Google Scholar]
- 33. Kochetov LM, Sazhin BS, Karlik EA. Experimental determination of the optimal ratios of structural dimension in the swirl chamber for drying granular material. Khimicheskoe i Neftyanoe Mashinostroenie. 1969;2:10–11. [Google Scholar]
- 34. Volchkov EP, Terekhov VI, Kaidanik AN, Yadykin AN. Aerodynamics and heat and mass transfer of fluidized particle beds in vortex chambers. Heat Transf Eng. 1993;14(3):36–47. [Google Scholar]
- 35. Staudt N, de Broqueville A, Trujillo WR, De Wilde J. Low‐temperature pyrolysis and gasification of biomass: numerical evaluation of the process intensification potential of rotating and circulating rotating fluidized beds in a static fluidization chamber. Int J Chem React Eng. 2011;9(1):A43. [Google Scholar]
- 36. Rosales Trujillo W, De Wilde J. Computational fluid dynamics simulation of fluid catalytic cracking in a rotating fluidized bed in a static geometry. Ind Eng Chem Res. 2010;49(11):5288–5298. [Google Scholar]
- 37. De Wilde J. Gas–solid fluidized beds in vortex chambers. Chem Eng Process: Process Intensif. 2014;85:256–290. [Google Scholar]
- 38. De Wilde J, de Broqueville A. Experimental study of fluidization of 1G‐Geldart D‐type particles in a rotating fluidized bed with a rotating chimney. AIChE J. 2008;54(8):2029–2044. [Google Scholar]
- 39. Eliaers P, de Broqueville A, Poortinga A, van Hengstum T, De Wilde J. High‐G, low‐temperature coating of cohesive particles in a vortex chamber. Powder Technol. 2014;258:242–251. [Google Scholar]
- 40. Kovacevic JZ, Pantzali MN, Heynderickx GJ, Marin GB. Bed stability and maximum solids capacity in a gas–solid vortex reactor: experimental study. Chem Eng Sci. 2014;106:293–303. [Google Scholar]
- 41. Kovacevic JZ, Pantzali MN, Niyogi K, Deen NG, Heynderickx GJ, Marin GB. Solids velocity fields in a cold‐flow gas–solid vortex reactor. Chem Eng Sci. 2015;123:220–230. [DOI] [PMC free article] [PubMed] [Google Scholar]
- 42. Shtern VN, Borissov AA. Counterflow driven by swirl decay. Phys Fluids. 2010;22:063601. [Google Scholar]
- 43. Shtern VN, Torregrosa MM, Herrada MA. Development of a swirling double counterflow. Phys Rev E. 2011;83(5):056322. [DOI] [PubMed] [Google Scholar]
- 44. Shtern VN, Torregrosa MM, Herrada MA. Development of colliding swirling counterflows. Phys Rev E Stat Nonlinear Soft Matter Phys. 2011;84(4 Pt 2):046306. [DOI] [PubMed] [Google Scholar]
- 45. Vatistas GH, Fayed M, Soroardy JU. Strongly swirling turbulent sink flow between two stationary disks. J Propul Power. 2008;24(2):295–301. [Google Scholar]
- 46. Batchelor GK. An Introduction to Fluid Dynamics. San Bernardino, CA: Cambrige University Press, 1967. [Google Scholar]
- 47. Ergun S, Orning AA. Fluid flow through randomly packed columns and fluidized beds. Ind Eng Chem. 1949;41(6):1179–1184. [Google Scholar]
- 48. Gidaspow D, Jung J, Singh RK. Hydrodynamics of fluidization using kinetic theory: an emerging paradigm: 2002 Flour‐Daniel lecture. Powder Technol. 2004;148(2–3):123–141. [Google Scholar]
- 49. Gidaspow D. Multiphase Flow and Fluidization ‐ Continuum and Kinetic Theory Descriptions. San Diego, CA: Academic Press, Inc, 1994. [Google Scholar]
- 50. Mabrouk R, Chaouki J, Guy C. Wall surface effects on particle–wall friction factor in upward gas–solid flows. Powder Technol. 2008;186(1):80–88. [Google Scholar]
- 51. Qi X‐B, Zhang H, Zhu J. Friction between gas–solid flow and circulating fluidized bed downer wall. Chem Eng J. 2008;142(3):318–326. [Google Scholar]
- 52. Dvornikov NA, Belousov PP. Investigation of a fluidized bed in a vortex chamber. J Appl Mech Tech Phys. 2011;52(2):206–211. [Google Scholar]


