Abstract
A sectional aerosol model (CARMA) has been developed and coupled with the Community Earth System Model (CESM1). Aerosol microphysics, radiative properties, and interactions with clouds are simulated in the size‐resolving model. The model described here uses 20 particle size bins for each aerosol component including freshly nucleated sulfate particles, as well as mixed particles containing sulfate, primary organics, black carbon, dust, and sea salt. The model also includes five types of bulk secondary organic aerosols with four volatility bins. The overall cost of CESM1‐CARMA is approximately ∼2.6 times as much computer time as the standard three‐mode aerosol model in CESM1 (CESM1‐MAM3) and twice as much computer time as the seven‐mode aerosol model in CESM1 (CESM1‐MAM7) using similar gas phase chemistry codes. Aerosol spatial‐temporal distributions are simulated and compared with a large set of observations from satellites, ground‐based measurements, and airborne field campaigns. Simulated annual average aerosol optical depths are lower than MODIS/MISR satellite observations and AERONET observations by ∼32%. This difference is within the uncertainty of the satellite observations. CESM1/CARMA reproduces sulfate aerosol mass within 8%, organic aerosol mass within 20%, and black carbon aerosol mass within 50% compared with a multiyear average of the IMPROVE/EPA data over United States, but differences vary considerably at individual locations. Other data sets show similar levels of comparison with model simulations. The model suggests that in addition to sulfate, organic aerosols also significantly contribute to aerosol mass in the tropical UTLS, which is consistent with limited data.
Keywords: aerosol, model, satellite
Key Points:
A sectional aerosol model has been developed and coupled with the community earth system model
Model performance is evaluated by comparing simulations with multiple data sets
1. Introduction
Aerosols, collections of tiny particles suspended in the air, affect climate directly through aerosol‐radiation interaction and indirectly through aerosol‐cloud interactions. Both of these interactions have large uncertainties (IPCC V) [Stocker et al., 2013]. Various types of aerosols exist in the atmosphere including: sulfates which largely result from sulfur dioxide produced partly by anthropogenic energy production, as well as dimethyl sulfide (DMS) produced biologically in the oceans [Chin et al., 2000]; black carbon particles, which largely originate from incomplete combustion of fossil fuels and biofuels [Koch et al., 2009]; primary organic particles which originate from biomass burning and anthropogenic activities; secondary organic particles which originate from vapors produced by the living and dead biomass and anthropogenic activities; as well as dust and sea salt particles, which largely originate from wind blowing over the arid lands or oceans. Aerosols generally cool the Earth by scattering solar radiation; however, some aerosols, such as black carbon (BC), can both scatter and absorb radiation and thus have the potential to warm the atmosphere and cool the surface [Koch, 2001; Bond et al., 2013]. BC is the second strongest contributor to global warming since the beginning of the industrial era and may be as important as carbon dioxide at high elevations such as those found in the Himalayan region [Ramanathan and Carmichael, 2008]. Besides direct effects on the radiation budget, aerosols in the troposphere can be cloud condensation nuclei (CCN). Changes in CCN, which can be induced by both natural [Rap et al., 2013] and anthropogenic influences [Ghan et al., 2013], can affect climate indirectly by changing the properties of clouds. Changing CCN properties (e.g., number and size) affects cloud albedo and precipitation. Absorbing aerosols heat the atmosphere and potentially increase cloud evaporation. Large uncertainties still exist in both aerosol direct and indirect effects [Stocker et al., 2013; Lohmann et al., 2010]. Because of the complexity of the aerosol impacts on climate, global climate models with sophisticated aerosol schemes are needed to gain a better understanding of the radiative forcing via aerosol‐radiation‐cloud interactions. Our goals in this paper are to describe a new sectional model in the NCAR/DOE Community Earth System Model (CESM1) framework, to document its current performance, and to identify some weaknesses, which we believe are also present in a wide range of aerosol models.
An accurate representation of global variations in the aerosol particle size distribution in climate models is important since particle size determines the wavelength dependence of the aerosol optical properties, and is also an important factor, in addition to composition, in determining which aerosols can act as CCN. Some climate models use bulk schemes (fixed size and externally mixed aerosols). However, such schemes cannot capture the spatial or temporal variations in the aerosol particle size distribution [Liu et al., 2012]. A considerable improvement is to use a modal aerosol microphysics scheme (modal model hereafter), which assumes aerosols are found in several size modes assuming a size distribution (usually lognormal) in each mode. The goal of the modal aerosol model (MAM) in CESM1 [Liu et al., 2012] is to create a “minimal representation of aerosols in climate models.” Liu and Penner [2002] applied a modal scheme for sulfate aerosol in the LLNL/IMPACT model, which was further developed by Liu et al. [2005]; Stier et al. [2005] applied a seven‐mode aerosol module into the ECHAM5‐HAM global model; Wang et al. [2009] implemented a modal model into CAM3 [Collins et al., 2006]; while Liu et al. [2012] compared two modal schemes in CAM5, a seven‐mode (MAM7 hereafter) and a three‐mode (MAM3 hereafter) model. Liu et al. [2012] show that because of different size ranges and standard deviations assumed for the lognormal distribution, the MAM3 and MAM7 have dust burdens that differ by 10% and sea salt burdens that differ by 30–40%.
Modal models generally are computationally more efficient than sectional models. However, to accurately represent aerosols and their perturbations, some modal models can require many modes and can reach computational expenses similar to sectional models [Weisenstein et al., 2007; Kokkola et al., 2009]. For example, using a 2‐D chemical‐transport model, Weisenstein et al. [2007] evaluated three and four‐mode modal models of sulfate aerosols in comparison with a 40 bin sectional model. They found that the three‐mode model required 70% of the computer time as the 40 bin model, while the four‐mode model was actually slower, requiring 110% as much time as the sectional representation. Mann et al. [2012] compared modal and sectional parameterizations for tropospheric aerosols within the same global chemistry transport model. They adjusted the modal model widths and intermodal separations to give improved agreement with the sectional model finding that differences between the modal and sectional scheme were much less than model‐observation differences They also concluded that “The findings here underline the need for a spectrum of complexity in global models, with size‐resolved aerosol properties predicted by modal schemes needing to be continually benchmarked and improved against freely evolving sectional schemes and observations.” Various studies have incorporated sectional models into global climate models [Spracklen et al., 2005; Yu and Luo, 2009; Jacobson, 2001; Bardeen et al., 2008; Adams and Seinfeld, 2002].
Besides a choice of aerosol size‐resolving scheme (e.g., bulk, modal, or sectional schemes), it is also important to accurately represent the aerosol mixing state. Both optical and chemical properties may depend on whether they are internally or externally mixed. Jacobson [2001] showed that direct forcing by externally mixed black carbon aerosols in climate model is less than from internally mixed aerosols with a core‐shell configuration as originally suggested by Ackerman and Toon [1981]. Our sectional model can be organized into many different choices of mixing states. Here we consider two classes of particles, one comprising newly nucleated sulfuric acid particles and the other representing mixtures of primary particles including primary organics, dust, sea salt, and black carbon with sulfate condensed on them. We do not include nitrogen compounds (e.g., nitrate and ammonia) in this version of the model to reduce computing load. Nitrogen compounds are also neglected by many aerosols modules [Shindell et al., 2013; Mann et al., 2014].
Organic compounds contribute 20–90% of submicron aerosol mass globally [Zhang et al., 2007; Kanakidou et al., 2005]. Jimenez et al. [2009] show that organic aerosol (OA) can be further oxidized/aged to oxygenated organic aerosol (OOA). The oxygen to carbon atomic ratio (O:C) is relevant to aerosol hygroscopicity and volatility, which affect aerosol lifetime and budget. Zhang et al. [2007] conclude that lack of explicit representation of oxygenated organics (OOA) leads to bias of the organic budget in global models. The complexity of organic aerosols is very great, and our knowledge of them is poor [Kanakidou et al., 2005]. Due to the equilibrium partitioning assumptions made in most organic aerosol schemes, we carry the organic aerosol as several classes of bulk aerosol using a volatility basis set approach derived from Pye et al. [2010].
In section 2, we first introduce the sectional model CESM1/CARMA and the assumptions used in our modeling approach. In section 3, we critically evaluate simulated aerosol properties against a wide range of observational data sets. In section 4, we examine simulated aerosol properties in several key regions of the atmosphere. In section 5, we conclude by identifying some deficiencies in our present model, focusing on those that we believe to be common across models, and are therefore deserving of further attention by the community.
2. Model Description
We use the Community Earth System Model (CESM1) coupled with the Community Aerosol and Radiation Model for Atmospheres (CARMA) [Toon et al., 1988]. The chemistry package used is MOZART‐4 [Emmons et al., 2010] with additional sulfur chemistry [Mills, 1996; English et al., 2011], and secondary organic aerosol (SOA) chemistry following Pye et al. [2010]. We use 1.9° × 2.5° horizontal resolution, the standard CESM1 resolution, and 56 hybrid levels from the surface to 1.86 . For this study, we run the model for 3 years from 2009 to 2011 following an additional half‐year to allow the model to reach a steady state. The meteorology fields are nudged to MERRA reanalysis data [Rienecker et al., 2011]. Appendix A provides a detailed model description including aerosol source functions, sulfur chemistry, SOA chemistry, and aerosol microphysical parameterization schemes.
Both CARMA and MOZART‐4 consider the emission of aerosols and gases. CARMA controls the wind‐driven emission of sea salt and dust aerosols with source functions provided by Fan and Toon [2011] and Su and Toon [2009], respectively. The anthropogenic emission of primary organic aerosol (POA) and black carbon (BC) including gas‐flaring data follow Amann et al. [2011]. The biomass combustion emission of POA and BC use the Global Fire Emission Database (GFED, version 3) [van der Werf et al., 2006, 2010]. The details of the MOZART‐4 treatment of the emissions of SO2 and VOCs are described in Appendix A and Emmons et al. [2010].
Table 1 summarizes the aerosol emission rates and burden of primary/secondary aerosols averaged over the 3 year run and compares them with values reported by Liu et al. [2012] for the MAM7 model. Note that both models can vary these values depending on the assumptions made, such as number of modes used, and the emission databases used. Therefore, this comparison is primarily of use in understanding the general behavior of the models, and is not meant to be a quantitative comparison suggesting a deficiency of either code. We find most differences are due to CAM/CARMA including sources not included in Liu et al. [2012]. However, some differences in the removal rate of sea salt and dust may be due to the modal model as used by Liu et al. [2012] not including particles that are as large as those in CAM/CARMA (refer to Figure A2 in Appendix A). Appendix A also presents results from the MAM7 model run with the reanalysis winds, and anthropogenic emission databases used by CARMA. These results differ from those presented in Liu et al. by less than 20%.
Table 1.
| POA/SOA | CARMA | MAM7 | BC | CARMA | MAM7 |
|---|---|---|---|---|---|
| Source Tg/yr | 159.3/122.8 | 50.2/103.3 | Source Tg/yr | 11.74 | 7.76 |
| Burden Tg | 1.63/1.27 | 0.68/1.15 | Burden Tg | 0.14 | 0.093 |
| Lifetime days | 3.73/3.77 | 4.9/4.08 | Lifetime days | 4.35 | 4.37 |
| DD, Tg/yr | 65.1/8.35 | 8.4/11.2 | DD, Tg/yr | 2.96 | 1.27 |
| WD, Tg/yr | 95.37/115.88 | 41.7/92 | WD, Tg/yr | 8.90 | 6.48 |
| SEA SALT | CARMA | MAM7 | DUST | CARMA | MAM7 |
| Source Tg/yr | 7211.98 | 5004.1 | Source Tg/yr | 2997.18 | 2943.5 |
| Burden Tg | 8.77 | 7.58 | Burden Tg | 12.33 | 24.7 |
| Lifetime days | 0.44 | 0.55 | Lifetime days | 1.5 | 3.07 |
| DD, Tg/yr | 4939.3 | 3073.8 | DD, Tg/yr | 2509.08 | 1732.7 |
| WD, Tg/yr | 2294.96 | 1927.4 | WD, Tg/yr | 528.71 | 1212.9 |
| SO2 | CARMA | MAM7 | Nss‐sulfate | CARMA | MAM7 |
| Burden Tg S | 0.25 | 0.34 | Source Tg S/yr | 58.8 | 45.71 |
| H2SO4 | CARMA | MAM7 | Burden Tg S | 1.32 | 0.47 |
| Burden Tg S | 0.0024 | 0.00042 | Lifetime days | 8.02 | 3.72 |
| DMS | CARMA | MAM7 | DD, Tg S/yr | 18.6 | 5.51 |
| Burden Tg S | 0.046 | 0.067 | WD, Tg S/yr | 40.2 | 40.20 |
Note: Nss‐sulfate stands for sulfate not emitted with sea salt particles; DD denotes dry deposition flux; WD denotes wet deposition flux.
As summarized in section 1 of Table 1, CAM/CARMA has a much larger source of POA than does Liu et al. [2012]. CAM/CARMA includes primary biological particles and primary marine organics, which are not simulated in Liu et al. [2012]. The primary biological and marine organics account for 60% of the total source of organic aerosols. However, these particles are relatively large so they are removed quickly by dry deposition including sedimentation. Biological particles are emitted mostly in supermicron bins, with mean radius of 1.5 μm (see details in section A2.4). Marine organics are emitted internally mixed with both sub and supermicron sea salt particles, which are more hydrophilic than organics. Thus marine organics are removed more efficiently through wet deposition than terrestrial organics, which are not coemitted with salt. Therefore, CAM/CARMA has a larger source of POA and a shorter lifetime for POA than Liu et al. [2012].
The SOA source, burden, and lifetime in Table 1 are within about 10% in CAM/CARMA and Liu et al. [2012]. However, as described in Appendix A, CAM/CARMA subdivides the SOA into four volatility classes so that the properties of the SOA are better resolved in CAM/CARMA than in Liu et al. [2012].
The BC source in CAM/CARMA is 54% larger than in Liu et al. [2012] because CARMA uses different anthropogenic emission databases developed by Amann et al. [2011] and a biomass‐burning database from the third version of global fire emission database [van der Werf et al., 2010]. The burden of BC in CARMA is 50% higher than in Liu et al. [2012] consistent with the emission difference.
As summarized in section 2 of Table 1, CAM/CARMA and Liu et al. [2012] have similar aerosol burdens for sea salt. However, CARMA predicts 60% more sea salt dry deposition flux compared with Liu et al. [2012]. The larger flux and the corresponding shorter lifetime are due to larger sized sea salt particles included in CAM/CARMA, which have high fall speeds.
CESM1/CARMA predicts only 50% of the dust burden from Liu et al. [2012], while the emission fluxes are within about 3%. However, the similar emission fluxes are somewhat misleading. CARMA's dust lifting scheme emits larger sized particles than does the flux scheme used by Liu et al. [2012]. Consequently the dry deposition flux predicted by CARMA is 45% higher than in Liu et al. [2012]. Likewise, the wet deposition flux predicted by CARMA is only 43% of Liu et al. [2012]. Another reason, besides having larger particles, for the lower wet deposition in CARMA is that CARMA calculates a mass weighted hygroscopicity and assumes dust is more hydrophobic than other aerosol species such as organics, sulfate, and salt. The calculated wet deposition flux in CARMA is only 21% of the dry deposition flux, which indicates dry deposition is the dominating sink of dust. A similar result is reported by Su and Toon [2011].
As summarized in section 3 of Table 1, CESM1/CARMA predicts 4.2 times the burden of sulfuric acid in the gas phase as Liu et al. [2012], while SO2 and DMS burdens simulated in MOZART are consistent between both models. Sulfuric acid above 100 mb in CESM1/CARMA accounts for 75% of total sulfuric acid mass, while most sulfuric acid burden in Liu et al. [2012] is in the troposphere. CARMA includes carbonyl sulfide (OCS), which contributes to the disagreement on sulfuric acid burden in the stratosphere between the two models.
CESM1/CARMA has about 2.8 times the burden for nonsea‐salt sulfate aerosol as Liu et al. [2012], while the source in CARMA is 30% higher than Liu et al. [2012]. CARMA predicts 3.4 times the dry deposition flux as Liu et al. [2012], while the wet deposition fluxes are similar. One of reason for the difference in burden is that CESM1/CARMA includes additional processes and sulfur chemistry for simulating aerosol in the stratosphere as well as the troposphere.
As mentioned previously, while we have identified some differences between the Liu et al. [2012] model and the CESM1/CARMA model, these are not inherent errors in Liu et al. [2012] or CESM1/CARMA. The differences could be narrowed by changes in source functions, size ranges covered, or rainout rates.
3. Model Evaluations
3.1. Simulated Aerosol Optical Depth (AOD) Compared With Satellite Observations
Aerosol optical properties are calculated using a core‐shell Mie Code assuming CARMA's mixed particles are internally mixed. Black carbon and dust are cores while water forms a shell along with water‐soluble compounds such as organics, sea salt, and sulfate. Details of the optical assumptions are presented in Appendix A.
Figure 1 compares annual column‐integrated AOD at a wavelength of 533 nm from a CAM/CARMA simulation nudged to offline meteorology by MERRA [Rienecker et al., 2011] for the years 2009–2011 with satellite observations of Terra MODIS collection 5 Level 3 monthly data (http://ladsweb.nascom.nasa.gov/) and MISR version 4 Level 3 monthly data (https://eosweb.larc.nasa.gov/) averaged over the same period. The wavelength of the MODIS and MISR data is 550 nm. It should be noted that satellites often do not retrieve aerosol optical depths either because of orbital sampling bias, or because of cloud screening. This data loss can lead to bias in the global average data sets. In the comparison, we did not mask out data when and where satellites actually did not measure. In addition, retrieval uncertainties of satellites also limit the ability to constrain climate models. The optical depth detection limit for MISR is 0.05 according to Khan et al. [1998], while the expected uncertainties for MODIS are reported as ±(0.05 + 15%*AOD) over land and ±(0.03 + 5%*AOD) over ocean [Remer et al., 2008].
Figure 1.
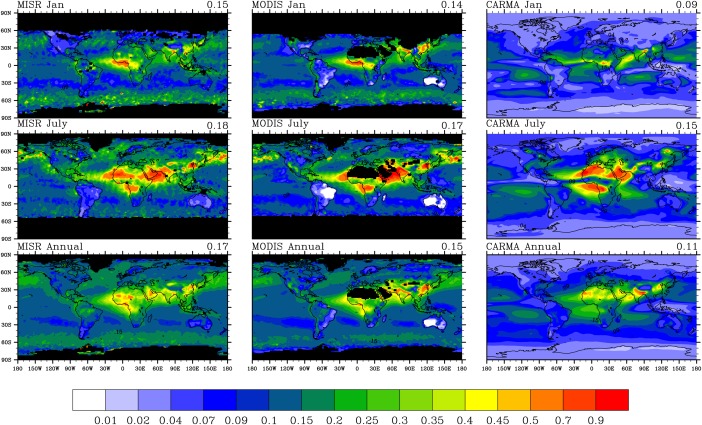
AOD global maps for (top row) January, (middle row) July, and (bottom row) annual average; MISR observations (550 nm) are shown in left column; MODIS observations (550 nm) are shown in middle column; CARMA simulations (532 nm) are shown in right column. Both observations, and the model are averaged from 2009 to 2011 with calculated global mean AOD shown on the right top of each figure. Missing values are denoted by black shading. For the global mean AOD from CARMA we have only averaged over the same area of the planet that is observed by the MISR.
As shown in Figures 1 and 2, the model underestimates global annual average AOD observed by MISR by 32% (normalized mean bias), while MODIS shows a 9% difference with MISR. Our simulated global‐averaged optical depth is within the uncertainty of the MISR and MODIS data noted above. Generally, the model captures temporal and spatial distributions of AOD over land annually. Both model and satellites show peaks at Northern Africa, equatorial Africa, South Asia, and East Asia. The model underestimates AOD in midhigh latitudes of the Northern Hemisphere both over land and ocean. Compared with MISR and MODIS, the model overestimates AOD in the central Pacific Ocean and Indian Ocean between the equator and 30°S by up to 60%. The model strongly underestimates AOD in the South China Sea and Southeast Asia. The model also shows up to 80% underestimation of AOD, likely due to sea salt, in the southern ocean between 60°S and 75°S. In addition to a possible missing source of sea salt particles, the model may generate too much convection and wash particles out too aggressively. However, the Maritime Aerosol Network (MAN) shows that the measured AOD from cruises in the southern ocean is less than 0.1 [Smirnov et al., 2011], as simulated by CARMA. The disagreement between measured AOD from MAN and satellite retrieval may suggest large observational uncertainties.
Figure 2.
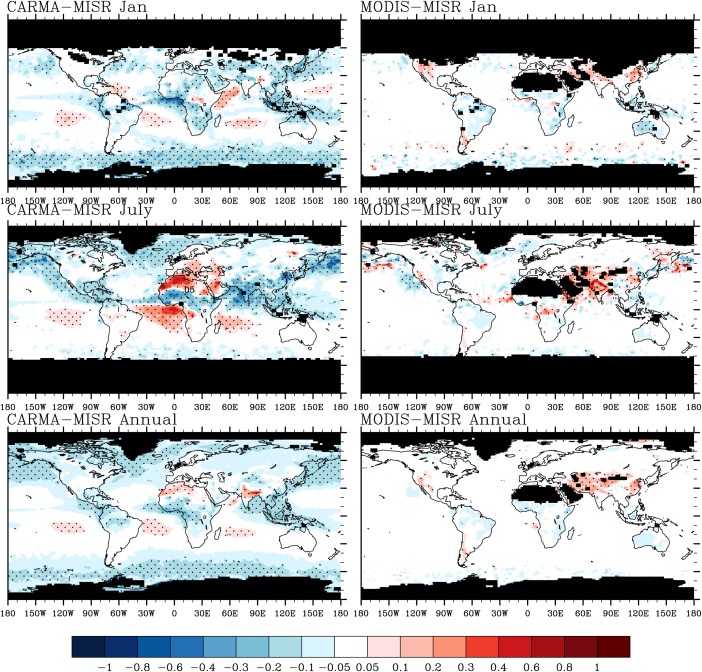
(left) Calculated AOD differences between CARMA (532 nm) and MISR (550 nm); (right) calculated AOD difference between MODIS (550 nm) and MISR. Top figures are January averaged from 2009 to 2011; the middle figures are July; the bottom figures are annual averaged. Missing values are denotes by black shading. Stippling in each figure denotes where differences are greater than reported MISR detection limit.
In January, both model and satellites shows high AOD over equatorial Africa associated with strong biomass burning and over East Asia associated with strong anthropogenic pollution. CAM/CARMA shows the peak opacity over central Africa, while the satellites show it over Western Africa and the Gulf of Guinea. Possibly this difference indicates that the model underestimates the emissions in Western Africa in January or that the model does not capture some gas to particle conversion occurring as the smoke moves downwind.
In July, both model and satellites show a strong peak of AOD in the Sahara, central Africa, western Asia, and eastern China. The modeled peak over the Sahara is mostly contributed by dust particles and deviates from satellite observations spatially by being slightly to the North. The modeled AOD in the Amazon in July ranges from 0.1 to 0.15, while MISR shows values of 0.07–0.09. Thus, the simulation overestimates the observations by a factor of 1–2. The strong deviation may indicate the model produces too many secondary organics in the Amazon. However, the AOD retrieved by satellites in South America is similar to their detection limits, which indicates high uncertainties exist in this region. The simulated AOD is within a factor of 2 of both MODIS and MISR in North America. Over the Pacific Ocean along the west coast of North America, the model underestimates MISR AOD by 80%, however MODIS also has lower AOD compared with MISR. Kinne et al. [2006] show MISR AOD products have a high bias over the Pacific Ocean along the west coast of North America compared with retrievals by other satellites including MODIS. Further Pappas et al. [2013] show that the MODIS AOD is within 20% of recent aerosol climatology data in the same region, which indicates observational uncertainties exist in these areas. The model shows an AOD peak in the central tropical Pacific (0°S–20°S), which is not shown either by MISR or MODIS. This disagreement may indicate the model overestimates aerosol (mostly sea salt) production in that region. Alternately, Kipling et al. [2013] show that the vertical distribution of aerosol (e.g., BC) is sensitive to convective scavenging; thus, not enough wet deposition in tropics may contribute to the disagreement. Also, high cloud cover in the tropics may increase the observational uncertainties for AOD retrieved from satellites.
3.2. Simulated AOD Compared With AERONET Observations
Aerosol Robotic Network (AERONET) sites around the globe and their optical depths are shown in Figure 3. An AERONET site is picked for comparison with the model if the site has more than 32 months of AOD measurements at midvisible wavelength out of the 36 months from January of 2009 to December of 2011. It should be noted that AERONET may be missing data on a daily or hourly basis, and we did not attempt to exclude times from the simulations when a particular site did not report data. As shown in Figure 3, lower AOD is found in the western U.S., the Southern Hemisphere, and Europe, while higher AOD is found in eastern U.S., as well as parts of Africa, the Middle East, and Asia.
Figure 3.
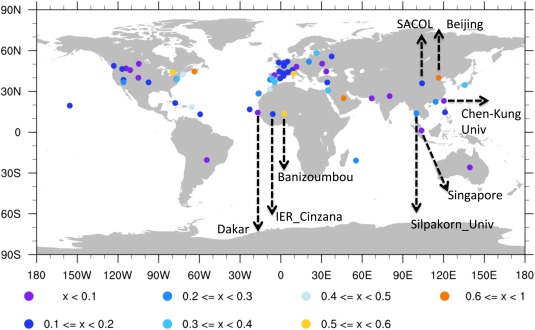
Annual column AOD at midvisible wavelength over 75 AERONET sites averaged from 2009 to 2011. Colors of cycles correspond to AOD values as shown in the legends. Sites marked are further discussions in Table 2.
A comparison between simulations and annual‐averaged AERONET data from the period between 2009 and 2011 is shown in Figure 4. Simulations are also for the period from 2009 to 2011. The simulated AOD around the globe on average captures 65% of AERONET AOD with a correlation coefficient of 0.80. Modeled AOD is generally within a factor of 2 of observations at rural sites. The model underestimates AOD by more than a factor of 2 at some urban sites with large AOD. This underestimation may be due to urban anthropogenic emissions being averaged over a coarse model grid cell in the simulations, while the simulation results are compared with point measurements made at AERONET sites. Error bars in each point of Figure 4 denote yearly variations of observations.
Figure 4.
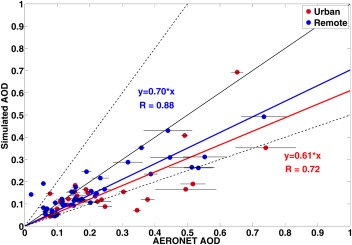
AOD (midvisible wavelength) simulations compared with data from 72 AERONET sites from 2009 to 2011. Blue (red) line is fitted line forced thru the origin for rural (urban) sites, 1:1 line is shown in solid black, 1:2 and 2:1 lines are shown in dashed black. Urban sites are denoted by red circles, while rural or remote sites are denoted by blue circles. Error bars denote year‐to‐year variability of observations.
Monthly variations of AOD at selected AERONET sites and from simulations are shown in Figure 5 (urban and suburban sites) and Figure 6 (rural and remote sites). In each plot of Figures 5 and 6, observational data from two sites are shown using red and blue colored solid lines, while simulations are shown in solid circles. In general, the simulations are within the error bars of the observations. However, for some sites summarized in Table 2 the simulations underestimate AOD. These are usually urban and suburban locations (e.g., Beijing, Chen‐Kung University, Silpakorn University, and Singapore). Our model resolution (2°) is not capable of resolving the high local AOD in urban sites with high pollution since emissions are averaged over each 2° model grid. The simulations overestimate the AOD at some locations where the site is located at high elevation, since we cannot resolve small‐scale topography.
Figure 5.
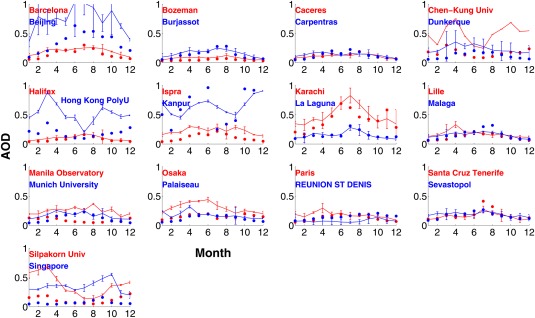
AERONET monthly AOD at midvisible wavelengths at selected urban/suburban sites averaged from 2009 to 2011 (solid lines); model simulations (solid dots). Error bars indicate standard deviation of 3 years of data for each month. Each figure contains monthly AOD data at two sites marked by red and blue colors, respectively, with the site names listed in each figure.
Figure 6.
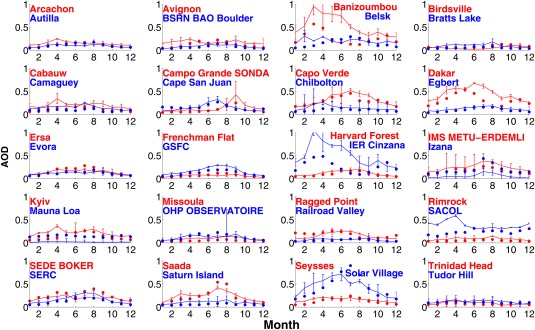
Same as Figure 5 but for rural and remote sites.
Table 2.
Locations With Large Differences Between AERONET Observations and Model Simulations and Corresponding Information About Each Sitea
| Sites | Model | Months | Site Information |
|---|---|---|---|
| Banizoumbou | Under | 1–10 | Sandy, near village |
| Beijing | Under | All | Urban |
| Chen‐Kung_Univ | Under | 8–12 | Urban, near train station |
| Dakar | Under | 1–8 | Coastal, 90 km from Dakar |
| IER_Cinzana | Under | 1–7 | Cultivated, 35 km from Sigou city |
| SACOL | Over | 1–4 | Top of mountain, bush |
| Silpakorn_Univ | Under | 11–14 | Urban Nakhon Pathom, Thailand |
| Singapore | Under | All | Urban, University of Singapore |
Note: sites are marked in Figure 3; “under” (“over”) means model underestimates (overestimates) observation; months indicates when the disagreements between model and observations occur.
3.3. Evaluation of Surface Mass Concentrations of Different Aerosol Components
Filter measurements from the Interagency Monitoring of Protected Visual Environment (IMPROVE) U.S. network data (mostly rural sites, http://vista.cira.colostate.edu/improve/) as well as EPA Chemical Speciation Network data (urban sites) show that the surface concentration of black carbon, organic carbon, and sulfate is higher in the eastern U.S. and lower in the midwest. Simulated surface concentrations of organics, black carbon, and sulfate aerosol over U.S. are illustrated in Figure 7. Simulated organics, black carbon, and sulfate have a large gradient from the eastern U.S. to the west. This spatial distribution is consistent with higher anthropogenic emission in the east than the west. Black carbon mass is an order of magnitude smaller than the mass of organics. Sulfate dominates the mass in the western U.S. and is comparable to organic mass in eastern U.S. Comparisons between simulations and IMPROVE and EPA data for BC, organics, and sulfate are shown in Figure 8.
Figure 7.
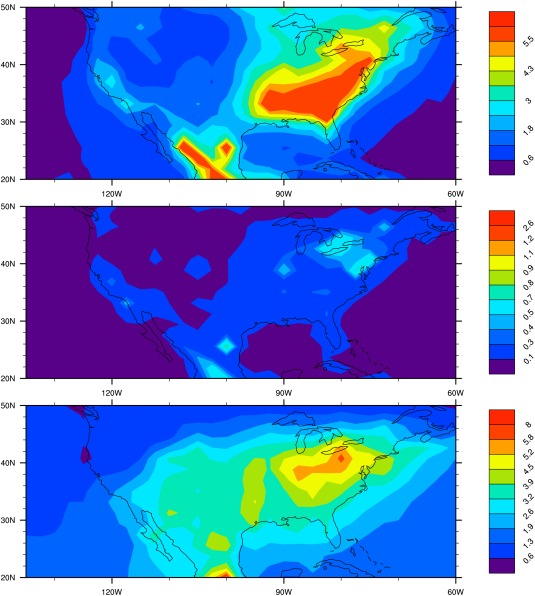
(top) Annual‐averaged total organic aerosol concentration (in ) with particle size less than 2.5 µm in U.S. simulated by CARMA; (middle) same as top but for black carbon ( ); (bottom) same as top but for sulfate ( ).
Figure 8.
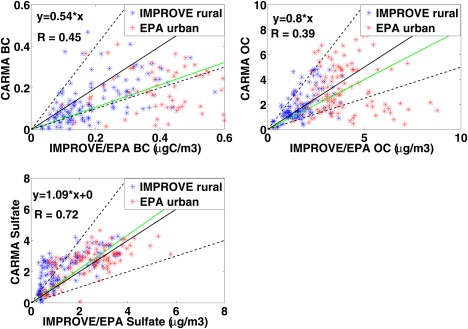
The top left figure compares BC between CARMA simulations and IMPROVE/EPA data. A fitted line forced to zero is shown in green, 1:1 line is shown in solid black, 1:2 and 2:1 lines are shown in dashed black. Blue points represent IMPROVE data and red points stand for EPA data. Model is run for 3 years from 2009 to 2011 and observations are averaged over 5 years from 2006 to 2010. The top right figure is the same as the top left figure but for OC (µg OM/m3); the bottom plot is for sulfate aerosol (µg SO4/m3).
IMPROVE and EPA data are averages of 5 years from 2006 to 2010, while the model simulation is for 3 years from 2009 to 2011. Observations are averaged in each model grid‐cell (2°) and compared to corresponding model data. Simulated organic mass (OM) and sulfate over the U.S. are mostly within a factor of 2 of observations (Figure 8). On the annual mean, the model underestimates observed OM concentration by 20% with a fairly weak correlation coefficient of 0.39, while the model overestimates observed sulfate by 9% with a correlation coefficient of 0.72. By contrast, the model generally underestimates BC in U.S. by 50% with a correlation coefficient of 0.45.
3.4. Simulated Near‐Surface Mass Concentration and Composition Compared With Data From Aerosol Mass Spectrometers
Aerosol concentrations have been measured by aerosol mass spectrometers (AMS) at many locations. Zhang et al. [2007] summarized the organic and sulfate concentrations measured during a variety of field campaigns from 2000 to 2006. Most data are collected in Northern America, Europe, and Eastern Asia as shown in Figure 9. Higher concentrations of sulfate and total organics are found in Asia than in Europe and North America. The principal component analysis of the data [Zhang et al., 2006] provides quantification of organics into several types including hydrocarbon‐like organics aerosol (HOA) and oxygenated organic aerosol (OOA). In CAM/CARMA we assume directly emitted organics are categorized as HOA, including organics from biomass burning, forest fires, and anthropogenic sources. We also assume SOA from both anthropogenic and biogenic sources are categorized as OOA. No further oxidation of HOA to OOA is considered in CARMA. Each simulation in Figure 10 is for the same month(s) when the measurements were taken but averaged from 2009 to 2011. Comparison between simulated and observed total organics and sulfate is shown in Figure 10, left, while comparison of HOA and OOA between model and observation is shown in Figure 10, right. CARMA on average is within 71% the total organic (TOA) and 75% of the sulfate (SULF) observations. Many of these measurements are from urban sites, which may not be well resolved by our model.
Figure 9.
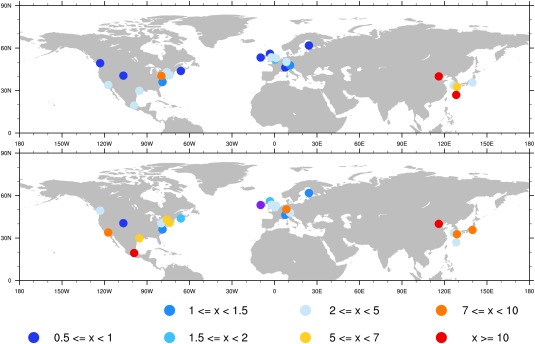
(top) AMS‐measured sulfate aerosol surface concentration ( ) summarized in Zhang et al. [2007]; (bottom) AMS‐measured total organic aerosol (TOA) concentration (HOA+OOA) ( ).
Figure 10.
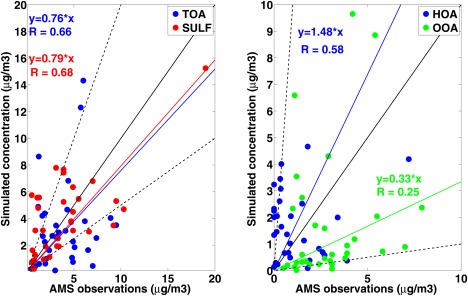
The left figure compares TOA (blue, ) and sulfate (red, ) concentrations observed in AMS campaigns and CARMA simulations The thick black line shows 1:1 between simulations and observations; dashed black lines show 1:2 and 2:1, respectively. The right figure is the same as the left figure but for HOA (blue, ) and OOA (green, ), dashed lines denotes 1:10 and 10:1, respectively.
Jimenez et al. [2009] show organic aerosols evolve by becoming increasingly oxidized and the aging processes are observed both in the atmosphere and laboratory. One advantage of the AMS data is that it differentiates the organics by degree of oxidation. As shown in Figure 10, on average the model overestimates HOA concentrations by 44% with a correlation of 0.6 while it underestimates OOA concentrations by 70% with a lower correlation of 0.24. In Eastern Asia, the simulated HOA fraction is much higher than observed; thus, directly emitted organics are likely being aged in highly urbanized places. The model performance possibly suggests that the aging process from HOA to OOA and among different organic volatility‐bins needs to be further parameterized and studied by introducing the oxidation state variable and carbon number used in Kroll et al. [2011].
3.5. Simulated Black Carbon Mass Concentration Compared With Multiple Data Sets
Koch et al. [2009] summarized black carbon surface measurements from multiple data sets around the globe. As described in Koch et al. [2009], data for the U.S. came from the IMPROVE network (year 1995–2001), those for Europe (year 2002–2003) were from the European Monitoring and Evaluation Program (EMEP) network (http://www.emep.int) and some Asian data (year 2006) are from Zhang et al. [2009]. As shown in Figure 11, relatively small concentrations (100–500 ) of black carbon are found in the U.S., while large concentrations (>1000 ) are found in Asia and parts of Europe. The largest concentrations (>10,000 ) are found in Asian urban sites listed in Zhang et al. [2009]. The pattern corresponds to emission reduction policies implemented in the U.S. and fast economic development in Asia with few restrictions on emissions.
Figure 11.
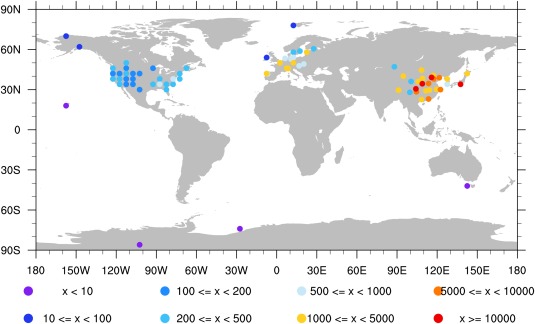
Observed BC surface concentrations ( ) summarized by Koch et al. [2009].
Comparisons between CARMA simulations and the data from Koch et al. [2009] are shown in Figure 12. Simulations are annual‐averaged data from 2009 to 2011. The averaged values from CARMA simulations are similar to observations in the U.S. and Asia, but lower than in Europe. However, the simulations differ greatly from observations at many individual rural locations, especially in Asia. Our model resolution may not be able to resolve urban sites with high pollution. However, it is also worth noting that the BC emission databases during 2009–2011 may differ from emissions from 1995 to 2006, when the data were collected.
Figure 12.
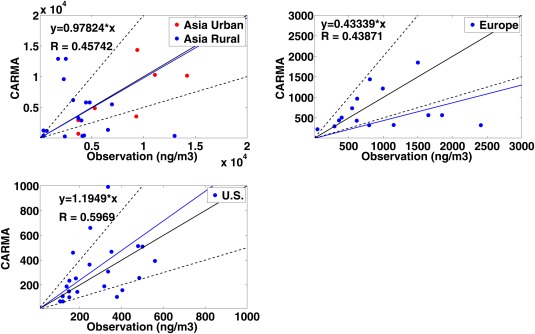
Scatterplots of CARMA simulations of black carbon versus observations summarized by Koch et al. [2009]. Black lines in each figure represent 2:1, 1:1, and 1:2 values. Simulations are annual averaged from 2009 to 2011. Urban sites in Asia listed in Zhang et al. [2009] are shown in red cycles in the top left plot.
3.6. Simulated Sulfate and Sea Salt Mass Concentration Compared With University of Miami Network Observations
Long‐term observations of nss‐sulfate and sea salt aerosol were conducted by the University of Miami network [Prospero et al., 1989; Arimoto et al., 1996] at numerous marine sites around the globe. Nss‐sulfate and sea salt annual‐averaged concentrations are shown in Figure 13. Data were mostly collected from 1983 to 1997. The observed nss‐sulfate concentration is higher in the Northern Hemisphere near the U.S. and East Asia. Correlations between model simulations and University of Miami network data for nss‐sulfate and sea salt aerosol are shown in Figure 14. Simulations are annual averages from 2009 to 2011. Simulated sea salt concentrations do not have a large bias (17% underestimation), but the spread is large and the correlation coefficient is 0.15. The simulated sulfate concentration overestimates observations on average by 63%. The overestimation of sulfate could be partly due to significant emission shifts in China‐India [Chin et al., 2014] from the time data were measured (1983–1997) and the simulation period (2009–2011). In addition to emission, the model may not have enough removal of sulfate over the ocean, may have too much production of sulfate over the ocean, or may have too much transport from land sources. Fan and Toon [2011] showed that because this database is sparse and highly sensitive to wind speed, better agreement can be obtained by using model simulations only for time periods when data were actually collected. We have not sampled our simulations to correspond with the data collection periods in Figure 14.
Figure 13.
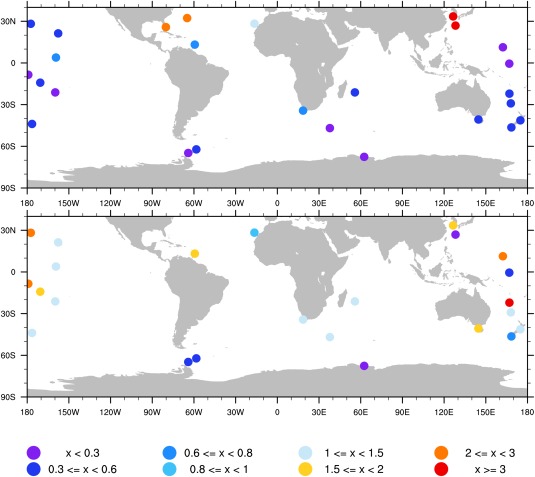
(top) Observed nonsea salt sulfate annual‐averaged surface concentrations (unit: ) according to University of Miami network [Prospero et al., 1989; Arimoto et al., 1996]; (bottom) same as top but for sea salt surface concentration (unit: 10 ). Data are summarized in Stier et al. [2005, Appendix A].
Figure 14.
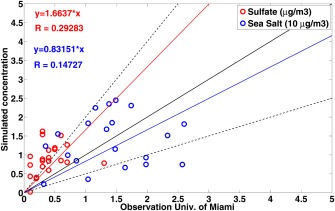
Scatterplot of CARMA simulation compared with University of Miami data for both sea salt and nonsea salt sulfate concentrations. Red circles stand for nonsea salt sulfate, blue circles stand for sea salt concentrations (multiplied by 0.1). Black lines represent 2:1, 1:1, and 1:2. To avoid extreme data, sulfate data are removed if concentration is over 3 and sea salt data are removed if concentration is over 30 .
3.7. Simulated Mass Concentration and Composition in the UTLS Compared With Data From Airborne Observations
3.7.1. UTLS Aerosol Composition
Murphy et al. [2006, 2007] and Froyd et al. [2009, 2010] measured the aerosol composition from the upper troposphere to the lower stratosphere during Pre‐AVE in January 2004, and CR‐AVE in January and February 2006 as shown in Figure 15. During the Pre‐AVE and CR‐AVE campaigns, both of which occurred in a similar region near Costa Rica, aerosol in upper troposphere or lower stratosphere was largely composed of sulfate‐organic particles. In Pre‐Ave organics were the dominant aerosol in troposphere, while in CR‐AVE sulfates dominated. The different composition was likely due to a difference in the prevailing wind, which was from South America where SOA dominates in Pre‐Ave, and from the Pacific Ocean where sulfate dominates in CR‐AVE. In both missions sulfate and organics were about equal in mass near 14–15 km, while sulfate dominated in the stratosphere. Observations and CARMA simulations are shown in Figure 15. Simulation data are averaged over January and February from 2009 to 2011 in black dotted line, with error bars denoting standard deviation among years between 2009 and 2011 at each altitude. Simulations are averaged over grids bounded by 5°S–20°N and 95°W–75°W as reported by Froyd et al. [2009]. CARMA predicts sulfate and organics are equal in mass around 16 km. The high gradient of sulfate mass fraction near and above the tropopause suggests limited vertical transport of organics from the troposphere to the stratosphere, as well as the presence of sulfate sources from OCS in the lower stratosphere.
Figure 15.
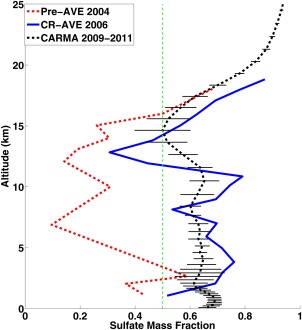
Sulfate mass fraction of sulfate‐organic particles observed by PALMS during Pre‐AVE (red) and CR‐AVE (blue); CARMA simulation for month of January and February averaged from 2009 to 2011 over studied area (Costa Rica and surrounding oceans) is shown in black dotted lines; dashed green line indicates equal mass of sulfate and organics. The error bars on the black line denote standard deviation of among yearly simulations. Particles with diameter greater than 0.2 are included corresponding to the detection efficiency of PALMS [Froyd et al., 2009].
3.7.2. Simulations Compared With Observations of the Vertical Distribution of Black Carbon Mass
During the HIAPER Pole‐to‐Pole Observations campaign (HIPPO1, January 2009), the refractory Black Carbon (rBC) mass mixing ratio (MMR) was measured by SP2 instruments in January 2009 [Schwarz et al., 2008] operated on board the NSF/NCAR GV aircraft as shown in Figure 16. Schwarz et al. [2010] showed that the rBC mixing ratio in the UTLS around the globe ranges from 0.1 to 3 ng/kg, with higher concentration found in high latitudes and lower concentration in tropics; while the rBC mixing ratio in the near‐surface region ranges from 0.05 to 50 ng/kg. They also showed that rBC decreased from the near‐surface to the UTLS in the tropics.
Figure 16.
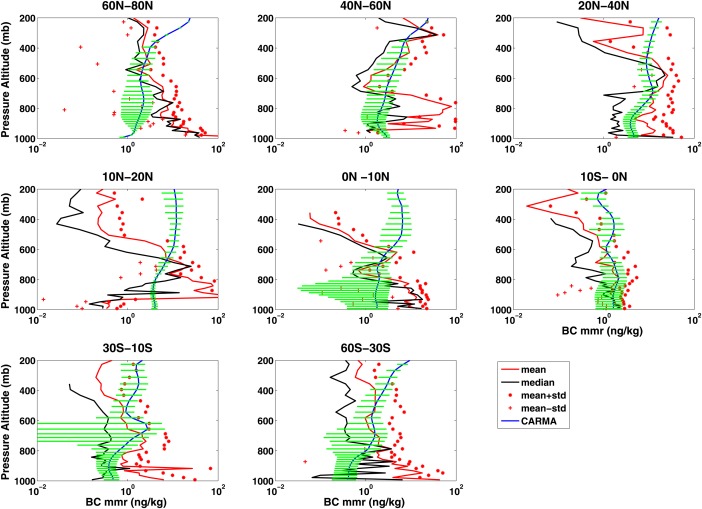
Average vertical profile for rBC MMR following HIPPO1 flight track for different latitude ranges: HIPPO 1 (January 2009) observational mean is shown with red lines; observational mean plus one standard deviation is shown in red stars; observational median is shown in black solid lines; CESM1/CARMA simulation (January of 3 years from 2009 to 2011) results are shown using blue lines with variability (yearly standard deviation from 2009 to 2011) shown in green lines.
Figure 16 compares simulated and HIPPO1 observed BC. The simulated data are averaged over January of 2009–2011, interpolated to the flight track of the HIPPO1 flights in Pacific, Arctic and near‐Antarctic regions. Generally, the observed median BC is very different from the mean, indicating high variability in the BC concentrations, as might be expected since the BC sources from combustion are highly variable. The model also shows strong year‐to‐year variation of BC in the troposphere from 2009 to 2011, which indicates that in addition to emission variations, the meteorology also strongly contributes to BC temporal‐spatial distribution. Generally, both the model and the data suggest that the mixing ratio declines by less than an order of magnitude from 1000 to 200 . In our simulations, we do not consider a hydrophobic period for the BC, unlike many other models, which assume that BC is hydrophobic for times on the order of days after emission [Koch et al., 2009]. We do not see evidence in field measurements for such a period of hydrophobic behavior. Carrico et al. [2004] show biomass burning particles take up water with relative humidity higher than 40%. The model is often within the error bars of the HIPPO1 data, and it is difficult to draw conclusions about deviations due to the high variability. We have added recent source data from Amann et al. [2011] for the Arctic, which represents gas‐flaring BC from the oil industry, and which increased simulated BC Arctic surface concentrations by a factor 3. However, it is likely that either additional sources are present at high Northern latitudes, rainout is too aggressive at high latitudes, or transport from lower latitudes is not well represented. Wang et al. [2013] conducted several numerical experiments on the convective scheme, wet removal rate, and aging rate. In one experiment with slower BC aging rate, the BC Arctic surface concentration increased by a factor of 10 in winter. However, this experiment also makes BC surface concentrations in midlatitudes and tropics deviate more from control runs than with the normal assumed aging rate. The model overestimates BC in the tropical upper troposphere by up to 2 orders of magnitude. Schwarz et al. [2013] show a similar overestimate by AeroCom models and suggests that climate models overestimate the lifetime of BC.
3.7.3. Vertical Distribution of Organics and Sulfate Compared With Aircraft Observations
Heald et al. [2011] summarized the organic and sulfate aerosol vertical profiles from multiple aircraft field campaigns between 2001 and 2009 (see Figures 17 and 18). Campaigns mostly took place in the Northern Hemisphere and most of the campaigns used an Aerodyne Aerosol Mass Spectrometer (AMS) [Jayne et al., 2000; Canagaratna et al., 2007] to measure aerosol concentrations. AMS data are available at https://sites.google.com/site/amsglobaldatabase. Organic aerosol concentrations near the surface are generally low (less than 2 ) in remote sites (e.g., Pacific ocean and Atlantic ocean), and high (6–10 ) if the sites that are influenced by local or transported biomass burning plumes (e.g., North America, western Africa, and Arctic). Organic concentrations in polluted areas (e.g., cities in Japan, Texas, and Europe) generally range from 2 to 6 at the surface while decreasing to background values (less than 1 g/m3) above 4 km in altitude. Similar vertical distribution patterns are also found for sulfate aerosol.
Figure 17.
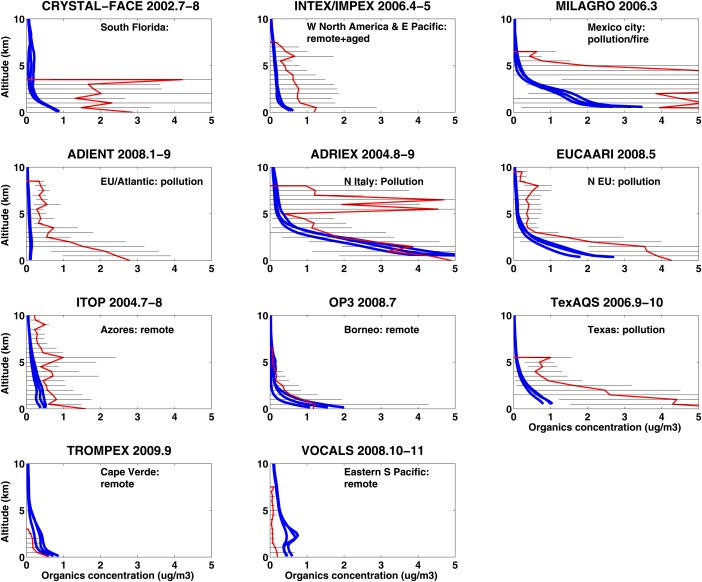
Vertical profiles of organic aerosol (measured by AMS between year 2001 and 2009) for different field campaigns summarized by Heald et al. [2011] in red lines; error bars denote standard deviation of data. CESM1/CARMA simulated aerosol concentrations in 3 years from 2009 to 2011 are shown in blue lines. Simulation data are averages for the month, but not the year, of the observations. The four figures inside the green box denote field measurements in remote regions. Black lines are error bars of observations.
Figure 18.
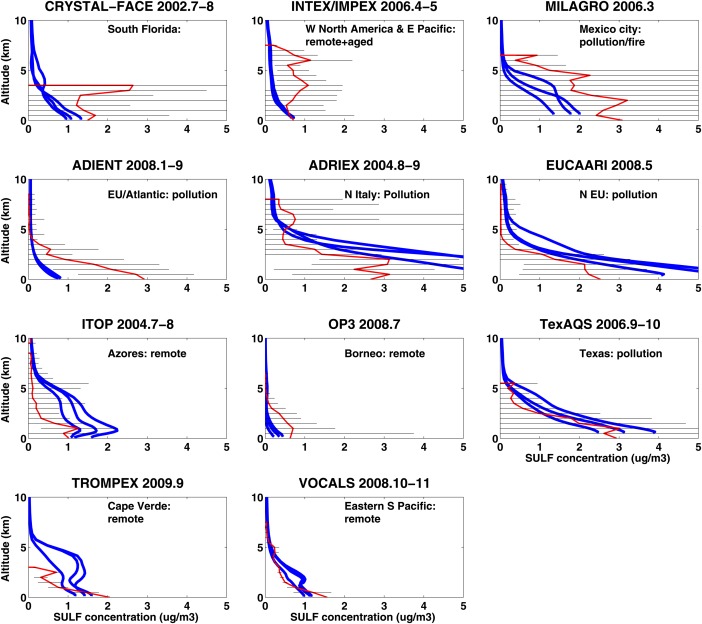
Same as Figure 16 but for submicron sulfate aerosol mass concentration.
Time (month of year) and locations are consistent between simulations for each campaign with observations in Figures 17 and 18. However, we did not simulate the specific year and days for each campaign, instead we use monthly mean output for the years from 2009 to 2011. Modeled organics have low variability from year to year, while modeled sulfate differs more in remotes regions. Simulations are generally within the error bars of the observations. However, the data variability is large, reflecting considerable natural variability. The model is close to the mean values of the organic and sulfate distributions in some remote areas and some highly polluted areas, but is far from the mean values in others. Some campaigns (e.g., ADRIEX and MILAGRO) show an elevated plume of organics, while simulation shows steady decline with altitude. Generally, the model fails for urban areas such as Mexico City (MILAGRO), Houston (Texas AQ), and Miami (CRYSTAL‐FACE), probably because the emission sources are subgrid scale.
3.8. Simulated Optical Extinction Compared With SAGEII Observations in the Tropics
English et al. [2011] used a sulfate aerosol sectional model (WACCM3/CARMA) similar to the one used here to show that in the UTLS sulfate aerosols alone fail to explain the extinction observed by the Stratospheric Aerosol and Gas Experiment (SAGE) II satellite retrievals [Chu et al., 1989]. As shown in Figure 19, English et al. [2011] simulated extinction due to sulfate aerosol is about a factor of 5 lower than SAGE II observed extinction in the tropical lower stratosphere near 18 km. Murphy et al. [2007] and Froyd et al. [2009] observed that organic aerosols can contribute a significant amount of the aerosol mass in the lower stratosphere and upper troposphere. Neely et al. [2011] suggested from these data that organics likely contributed the missing SAGE II extinction. Brühl et al. [2012] using a stratospheric aerosol model also suggested that organic particles could explain the missing SAGE II extinction.
Figure 19.
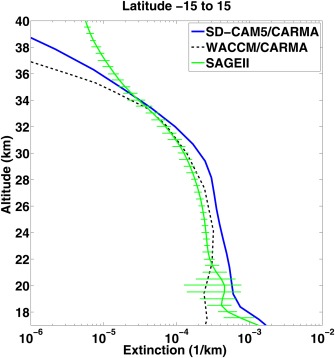
SAGEII extinction [Chu et al., 1989] at 525 nm in the tropics (15°S–15°N) from 17 to 40 km in altitude is shown by the green line, pure sulfate extinction simulated by WACAM/CARMA is shown in dashed black line [English et al., 2011], CESM1/CARMA simulated aerosol extinction at 533 nm is shown in solid blue line including mixed particles, and pure sulfates. The mixed particles contain significant organics below 20 km, as shown in Figure 15.
In section 3.7.1 and Figure 15, we show that organic aerosols contribute to the aerosol mass in the UTLS [Froyd et al., 2009]. Figure 19 shows that organics may contribute to the extinction observed by SAGE II bringing the model and observations within data variability in the lower stratosphere. The difference in extinction between the English et al. [2011] simulations and SAGE II data above 35 km was shown to be due to meteoritic smoke by Neely et al. [2011].
4. Aerosol Properties in Different Parts of the Atmosphere
In this section we present an analysis of a range of aerosol properties simulated by the model. Here measurements are limited so we present model results for several aerosol properties that we find interesting.
4.1. Organic Aerosol Concentration Near the Surface and Its Composition
The ratio of OOA to total organics may serve as an indicator of SOA formation. Some relevant data were collected by multiple campaigns using AMS listed in Zhang et al. [2007], which are shown in Figure 10, but generally the data are sparse. The simulated surface concentration ratio of OOA to total organics is shown in Figure 20 for two seasons. In our simulations OOA, which is the same as SOA in our model, is more than half the organics in most continental areas. OOA is more than 70% of the organics in equatorial South America, the Arctic, and Australia during DJF. The ratio peaks in the Eastern U.S. and Russia in JJA. The fraction usually peaks in forests or highly vegetated areas due to strong emissions, which are the precursors of SOA formation. However, the organic aging process, which tends to oxidize HOA and create OOA, is not included in the model and may alter the OOA distribution relative to our simulations in locations where OOA is a small fraction of the total organics. Further observations and numerical studies would be valuable to determine better the global organic aerosol budget.
Figure 20.
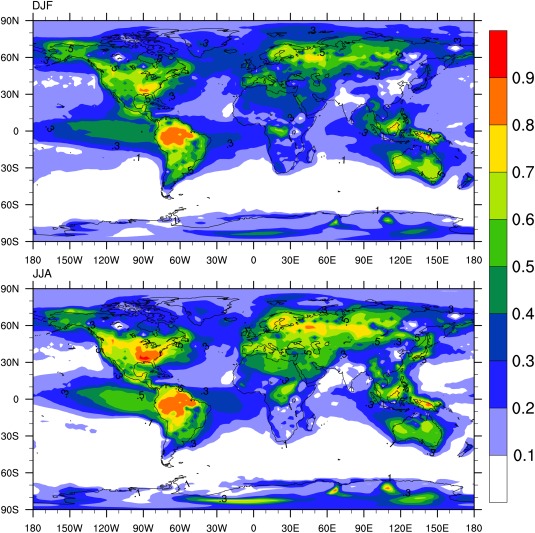
(top) Simulated ratio of OOA surface concentration to total submicron organics in DJF season; (bottom) same as top, but for JJA season.
4.2. Aerosol Concentration in the UTLS and its Composition
Froyd et al. [2009] found from the PALMS single particle data that aerosol during Pre‐AVE (winter, 2004) and CR‐AVE (winter, 2006) in the tropical tropopause transition layer were mostly mixtures of sulfate and organics. However, in our simulations the ratio of organic mass to sulfate is variable in latitude. Figure 21 illustrates the mass fraction of organics to sulfate+organics at three pressure levels that represent the global UTLS: 72 hPa which is likely in the stratosphere at all latitudes; 100 hPa, which is in the stratosphere outside the tropics; and, 260 hPa which is in the model troposphere in tropics and midlatitudes as shown in Figure 21. Simulations are 3 year averages from 2009 to 2011. The left figures represent particle sizes ranging from 0.2 to 2 μm in diameter, a size range that is similar to the reported detection limit of PALMS [Murphy et al., 2006]; while the right figures denote particles with diameters less than 1 μm, a detection upper limit of AMS [Jimenez et al., 2003]. As expected and also observed by Froyd et al. [2009], the organic fraction in the size range from 0.2 to 2 μm ranges from 30 to 60% in the tropical UTLS and increases with increasing pressure. The organic fraction of the aerosols is lower in high altitudes because these pressures are often in the stratosphere where there are in situ sulfate sources (e.g., OCS). At 260 , organics dominates above source regions in the tropics like South America and central Africa. Similar patterns are found for submicron particles as well; however, organic fractions are generally higher, ranging from 40 to 80% in tropical UTLS. At these altitudes mass is concentrated at and below 0.2 μm. The secondary organics in the model are enriched in these smaller particles as discussed in section A3.2.
Figure 21.
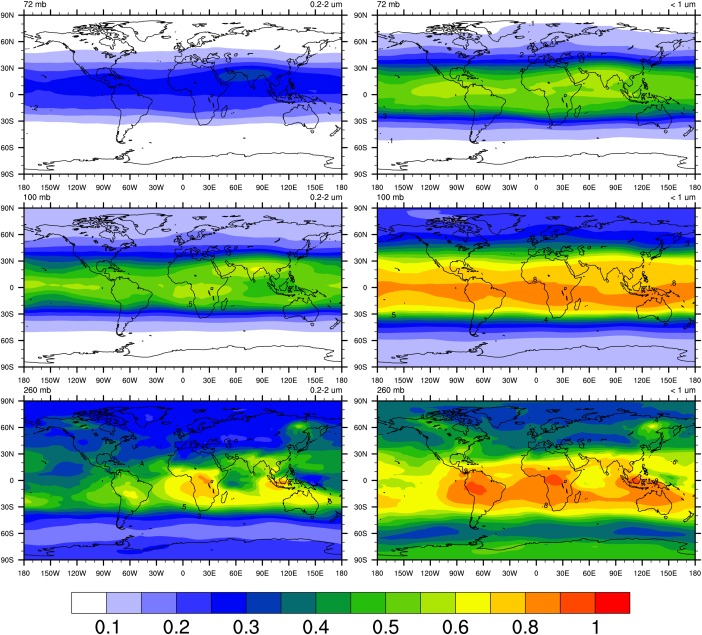
Simulated ratio of organic aerosol mass to organics+sulfate aerosol mass concentration at 72/100/260 levels. Simulations are averaged from 2009 to 2011. (left) Aerosol with diameters ranging from 0.2 to 2 um, the detection limit of PALMS [Murphy et al., 2006]; (righ) submicron particles corresponding to AMS detection limit which is smaller than 1 µm [Jimenez et al., 2003].
4.3. Simulated Tropospheric Aerosol Spatial Distribution
Figure 22 shows the simulated zonal and annually averaged aerosol vertical profiles at all latitudes for each of the aerosol constituents. Near the surface, dust and sea salt have the largest mass concentrations by about an order of magnitude, except near the poles where nonsea salt sulfate and organics become important. Organic aerosols dominate in the tropical and midlatitude upper troposphere, while sulfate dominates in stratosphere, though organics are still important in the tropical lower stratosphere. In the tropical upper troposphere region the SOA concentration is higher than POA, because SOA is formed by gas‐particle partitioning and the gases are transported further in the atmosphere than is the POA. The mass of primary particles emitted from the surface (e.g., POA, BC, dust, and sea salt) generally peaks in the lower troposphere near the source region. However, POA and BC reach higher altitudes than dust and sea salt because they are found in smaller sized particles. Dry deposition is important in removing dust and sea salt aerosols since they are large. Near the surface, nss‐sulfate peaks in the latitude belts between 0°S–60°S and 20°N–40°N. The broad peak in the Southern Hemisphere (0°S–60°S) is due to DMS emission in addition to anthropogenic sources, while the peak in midlatitudes of the Northern Hemisphere (20°N–40°N) is due to anthropogenic SO2 emission. The model does show a contribution of anthropogenic and natural SO2 emissions in the troposphere to aerosols in the lower stratosphere. This point is discussed further in Yu et al. [2015].
Figure 22.
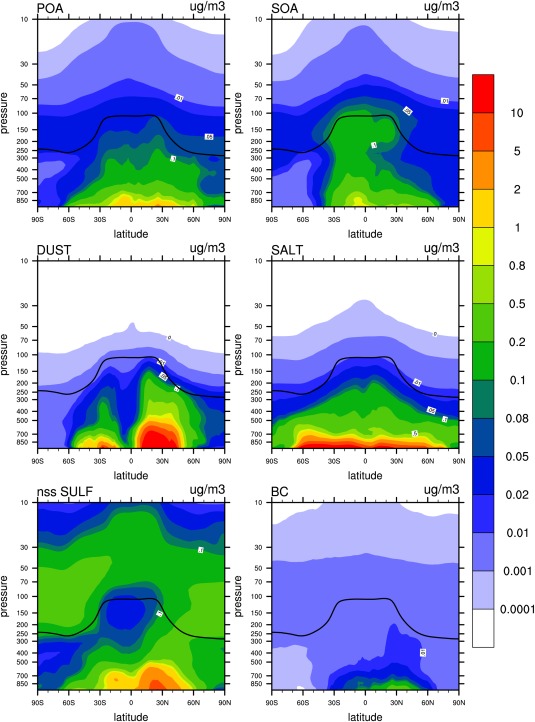
Zonal and 3 year averaged mass distribution simulated by CESM1/CARMA for major aerosol compositions (i.e., POA, SOA, BC, salt, nonsea‐salt sulfate, and dust). Black line in each figure denotes annually averaged simulated tropopause height.
4.4. Compositions of Aerosols and Optical Contributions From Various Aerosol Types
Figure 23 shows the composition of the 20 aerosol bins, ranging from 0.05 to 8.7 μm in dry radius, used in the CESM1/CARMA simulations of this study and their contribution to the total aerosol extinction. Simulations are annual averages over the U.S. Four different altitudes are shown: 1–2, 2–5, 5–10, and 10–18 km. As expected sea salt and dust dominate the mass of supermicron particles, while sulfate and organics dominates submicron particles. In the lower troposphere (up to 5 km), supermicron particles dominate the mass of total particles. Submicron particles become more and more dominant with altitude since larger particles are removed quickly. Different from the mass distribution, submicron particles always dominate the aerosol midvisible extinction due to their greater surface area than supermicron particles.
Figure 23.
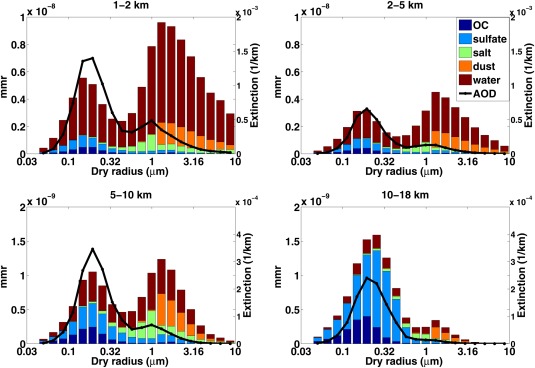
The mass mixing ratios of organics, sulfate, sea salt, dust, and condensed water in aerosol particles are shown in stacked bar charts. Four different altitudes are shown: 1–2, 2–5, 5–10, and 10–18 km. Each bar represents one particle size bin. The black line denotes aerosol extinction (1/km, 532 nm) for each bin. Simulations are annual averaged over United States.
In the boundary layer, condensed water contributes the most mass in each bin. The water contribution decreases with altitude corresponding to relative humidity changes. Figure 23 shows that water is the leading contributor to aerosol extinction, compared to the sum of the dry materials in the lower troposphere.
5. Discussion and Conclusions
This study uses a state of the art chemistry/climate model coupled with a sectional aerosol model, CESM1/CARMA, to simulate tropospheric aerosols. Our goals in this paper, and its appendices, are to describe the new sectional aerosol model in the NCAR/DOE CESM1 framework, and to document its current performance. In the previous sections, we have shown that the model is able to reproduce the general characteristics of a large number of diverse observational data sets including optical depth data from satellites and AERONET, as well as observations of composition from ground based and aircraft based instruments. While most of the aerosol data originate from the lower atmosphere, we also show our model has skill in predicting aerosol optical and chemical properties into the lower stratosphere. We conduct 3 year run from 2009 to 2011 with a half‐year spin up and use them for all the model‐data comparisons in this study, Similar approaches can be found in other aerosol model descriptions [Liu et al., 2012; Wang et al., 2009, 2011; Mann et al., 2012]. In this section of the paper we focus on identifying and discussing the weaknesses of the observational comparison and the model. The weaknesses are summarized in Table 3 (a–e) and discussed, respectively.
Table 3.
Weaknesses of Observational Comparison and CESM1/CARMA
| a. Models cannot easily simulate data retrievals, data error sources, or spatial and temporal sampling biases in data sets |
| b. Model intercomparisons are hampered by varying choices of emission data sets, model physics, and model structure |
| c. The sectional model is significantly slower than the modal models (e.g., MAM3 and MAM7) commonly used in CESM1 |
| d. The current model does not include ammonia or nitrates |
| e. The current model does not simulate aging processes from HOA to OOA |
(a) In this study we use a version of the model driven by observed winds, and appropriate emissions data sets for the years from 2009 to 2011. While we are attempting to simulate the particular time and locations of a large variety of observations, there are a number of weaknesses in making comparisons with data. These weaknesses occur because observations often depend on assumptions to retrieve data, observations have errors of their own, and observations have sampling biases and models may not be sampled with the same biases.
The only near‐global data sets on aerosol properties originate from satellite observations. Satellites, with a few exceptions, do not measure optical depth directly but make assumptions about particle optical and physical properties to obtain the optical depths they report. There are significant issues that limit retrievals, particularly the presence of clouds, bright ground surfaces, and inaccurate knowledge of particle optical properties. The optical depth detection limit for MISR is 0.05 according to Khan et al. [1998], while the expected uncertainties for MODIS are reported as the larger of ±(0.05 + 15%*AOD) over land and ±(0.03 + 5%*AOD) over ocean [Remer et al., 2008]. As shown in Figure 2 MISR and MODIS retrievals (annual mean) differ by 9% on average, which is smaller than the stated uncertainty of the measurement. MISR and MODIS differ by up to 100% in some places (western U.S. in January, southern South America, and Asia) limiting the ability to constrain models with these data sets in those places.
It is most accurate to make comparisons between simulations and observations by omitting simulated data at times and locations where the satellites did not make observations so that data and simulation averages over time and space are identical [Fan and Toon, 2011]. However, this sort of one‐to‐one comparison is rarely made, and we did not make it here, because of the difficulty in knowing enough about the observations to properly filter the simulations.
Other types of data, for example, AERONET retrievals of optical depth, are direct measurements of the quantity of interest. However, the AERONET instruments are located at geographic points, and they also have sampling biases, such as not making measurements if there are too many clouds present. It is always suspect to compare simulations with a model having a grid that is 2° wide with point data, because there may be localized strong sources that can bias the data at the measurement location relative to the rest of the grid cell. This is a particular problem near urban areas, and we identified a number of data sets in which we assume the differences between the model and the data are due to localized emission sources.
Data from aircraft field missions have similar problems. They are localized in time and space, so models should simulate times and specific locations of the flights. Such simulations become prohibitive when comparisons are made with the results of multiple complex field programs, and we have not attempted such comparisons. The CESM1 modeling framework makes it possible to perform such comparisons more precisely than done here. For instance, we are currently working on a model comparison with data from a multiaircraft, multiground station field campaign in which we sample the model at the times and evolving locations of the aircraft sampling.
(b) As shown in Table 1, it is also not easy to compare aerosol models. While generally our sectional model compares well with the MAM7 model [Liu et al., 2012] for the source strengths, burdens, and lifetimes of aerosols there are notable differences despite the fact that these two models share many features since they both use the CESM1 model. We trace some of the differences to the inclusion of sources in one model and not the other, or the use of emission data for different time periods. However, we find that there are large differences between the models for sea salt and dust, whose sources are independent of anthropogenic emission data. While the use of different lifting formula, or different computed wind speeds, could account for these variations, we think it is most likely that modal models have problems simulating sea salt and dust because sea salt and dust are subject to significant dry deposition which varies as the square of the particle radius. This strong dependence on particle size makes it essential that the modal sizes are selected properly and allowed to evolve as particles on the large particle tail of the size distribution fall out. The differences between the sectional model and the modal model likely could be resolved by careful comparisons of the codes and adjustments of the widths, mode radius, or intersection of modes in the modal model. We did not attempt such comparisons here. However, modal models are widely used for climate simulations. One potential future application of our sectional model is to test the performance of modal models and suggest improvements.
(c) Modal models are used in climate simulations because of their speed. Table A1 shows that the MAM3 model with the full version of MOZART chemistry code is about 2.6 times faster than the sectional model in which the coagulation and fall velocity are not recomputed every time step. Recomputing the coagulation kernels every time step takes a significant amount of the computer time. However, we did not compare MAM3 simulations to simulations using CESM1/CARMA since MAM3 does not represent the aerosol particle composition and sizes as accurately as MAM7. MAM7 with the full version of MOZART chemistry is about 2.0 times faster than CAM/CARMA. The sectional model includes some extra sulfur chemistry so that stratospheric aerosols can be treated. Despite being slower than MAM3, the sectional model is fast enough to perform decade length calculations with modest computer costs.
(d) As discussed in section 3.2 our simulations underestimate annual AOD on average by 34% compared to AERONET data with a correlation coefficient of 0.80. Part of this underestimate may be because the model does not include ammonia nor nitrates. Shindell et al. [2013] evaluate 10 ACCMIP aerosol models and find that most of them do not include nitrates. This omission may become more important in the future as sulfate emissions decline and nitrates become relatively more important.
(e) One of the major current challenges of aerosol science is to simulate organic aerosols. Organic aerosols have a wide range of compositions and properties, so it is impractical to simulate them in detail. Their concentrations are observed to vary by at least 2 orders of magnitude, and some sources such as cities are relatively small scale compared with typical global model grids. As suggested by Zhang et al. [2007], organic aerosols can be divided into hydrocarbon‐like organic aerosol (HOA) and oxidized organic aerosol (OOA). Figure 8 shows a factor of 10 variability in HOA and OOA. Generally the model overestimates the HOA fraction and underestimates the OOA in comparison to AMS data from around the world. In the future, more careful parameterization of the organic aerosol aging process and secondary organic aerosols is required to better simulate the global organic aerosol budget.
MODIS satellite AOD data differ from MISR AOD data by less than 10% on average, while the model differs from MISR data by about 32% on a global and annual average. There are several locations in Figures 1 and 2, with larger differences between the model simulations and the satellite data. One large difference is that the model underestimates AOD in Southeast Asia by over 80% in January and over 60% in July. A similar underestimation is found in the same region by MAM3 and MAM7 coupled with CESM1 [Liu et al., 2012]. One likely reason for these differences is that the model generates too much convection and washes particles out too aggressively. Another possible reason for underestimation of AOD is due to omission of nitrate.
Relative to satellite data, the model overestimates AOD in central tropical Pacific Ocean and Indian Ocean, where sea salt particles dominate. Since the model is nudged to MERRA winds, not enough wash‐out is a more likely reason for the difference than wind‐dependent emission from the tropical ocean. In addition, the model underestimates AOD in Northern Pacific Ocean and Northern Atlantic Ocean relative to satellite data.
Black carbon is an important aerosol despite contributing only a few percent of global aerosol optical depth, because it is a major source of solar energy absorption in the atmosphere. Both observations [Koch et al., 2009] and simulations show BC concentrations, and emissions, are highest in Asia and Europe and relatively lower in the U.S., with concentrations varying by 3 orders of magnitude across these regions (Figure 11). Compared with HIPPO1 data over the Pacific Ocean, the model simulation is generally within the data variability (Figure 16). However, CESM1/CARMA overestimates BC in the tropical upper troposphere and underestimates BC concentrations in the high‐latitude lower troposphere. AeroCom models also find similar overestimation in upper troposphere according to Schwarz et al. [2013]. The emission database used in our model might miss BC surface sources at high latitudes. We have added recent source data from Amann et al. [2011], which represents BC from gas flaring by the oil industry. Although this improved our model skill against the observations, it is nevertheless likely that either additional sources are present, or rainout is too aggressive at high latitudes, or transport from lower latitudes is not well represented in the model.
The in situ measurements of black carbon are limited in number and satellite observations of fires have considerable limitations. Emissions vary strongly across the globe, and sources are often short‐lived, as well as small scale. For these reasons, modeling black carbon is challenging, and we cannot have much confidence in the ability of global models to perform accurate simulations of individual fires.
According to our simulations, organic particles contribute half of the aerosol mass in the tropical TTL region, which is consistent with observations reported by Froyd et al. [2009] in Costa Rica. The disagreement of aerosol extinction between WACCM/CARMA sulfate simulations and SAGE II observations in the tropical UTLS by English et al. [2011] could be explained by adding the extinction due to organics to that due to sulfate. Our simulations also suggest that organics in the TTL and the lower stratosphere are mostly secondary organic aerosol formed by gas/particle partitioning.
The sectional aerosol model we have discussed here has many successes in treating aerosols from the surface to the lower stratosphere, and generally reproduces important climate related parameters, such as the aerosol optical depths, within observational constraints. However, there are many shortcomings in our model. It is difficult to confidently constrain models because there is a general paucity of data over the globe for many types of aerosols, such as black carbon and organics, whose concentrations vary by several orders of magnitude. A significant amount of emissions also come from small‐scale sources, including cities and fires, which are difficult to resolve on current spatial grids in global climate models. Our model and others have difficulty constraining the organic aerosol composition and secondary aerosol chemistry and formation processes, since these are poorly understood at present. Also, some types of aerosols are not included in our model, or most others, including ammonia and nitrates.
In order to limit the scope of this paper we have not discussed the interactions of our sectional aerosol model with the two‐moment cloud physics in the CESM1 model, nor the predicted abundances of cloud condensation nuclei. These are important, but complex topics, and will be described at length in future work.
Acknowledgments
The CESM project was supported by the National Science Foundation and the Office of Science (BER) of the US Department of Energy. Computing resources (ark:/85065/d7wd3xhc) were provided by the Climate Simulation Laboratory at NCAR's Computational and Information Systems Laboratory (CISL), sponsored by the National Science Foundation and other agencies. This work also utilized the Janus supercomputer, which is supported by the National Science Foundation (award CNS‐0821794), the University of Colorado Boulder, the University of Colorado Denver, and the National Center for Atmospheric Research. The Janus supercomputer is operated by the University of Colorado Boulder. We thank Lin Su for help developing CARMA. We thank Alma Hodzic and Sasha Madronich at NCAR for discussions on SOA modeling. We thank Andreas Stohl and Klimont Zbigniew providing ECLIPSE emission data for black carbon and organics. MISR data can be found at https://eosweb.larc.nasa.gov/; MODIS data can be found http://ladsweb.nascom.nasa.gov/; AERONET data can be found http://aeronet.gsfc.nasa.gov/; IMPROVE and EPA Chemical Speciation Network data sets can be found at http://vista.cira.colostate.edu/improve/; AMS network data sets can be found at https://sites.google.com/site/amsglobaldatabase; black carbon surface measurements data are published at Koch et al. [2009] and can be found at http://aerocom.met.no/databenchmarks.html; University of Miami network data are summarized at Stier et al. [2005, Appendix A]; PALMS data for Pre‐AVE and CR‐AVE field campaigns are published in Froyd et al. [2009]. HIPPO data set can be found at http://data.eol.ucar.edu/master_list/?project=HIPPO‐1; SAGE II data can be found at https://eosweb.larc.nasa.gov/project/sage2/sage2_table; OPAC software package is available at http://opac.userweb.mwn.de/radaer/opac.html. This work was supported by NSF award ATM0856007, by NASA award NX09AK71G, and by NASA award NNX12AC64G.
Appendix A. Model Description
A.1. General Structure of the Model
A.1.1. General Structure of the Model
The Community Aerosol and Radiation Model for Atmospheres (CARMA, version 3.0), which was first developed at NASA Ames Research Center [Toon et al., 1988], is a multidimensional and multisectional aerosol microphysical model. Bardeen et al. [2008] recently coupled CARMA with CESM1 (Community Earth System Model) developed by the National Science Foundation, the National Center for Atmospheric Research (NCAR), the Department of Energy, and many other researchers. CARMA has also been applied to multiple kinds of aerosols using a variety of dynamical models, for example, smoke [Matichuk et al., 2007, 2008]; stratospheric sulfate [English et al., 2011; Neely et al., 2013, 2014]; wind‐blown dust [Su and Toon, 2009, 2011]; sea salt [Fan and Toon, 2011]; noctilucent clouds [Bardeen et al., 2010]; cirrus clouds [Bardeen et al., 2013]; meteoritic smoke [Bardeen et al., 2008; Neely et al., 2011]; and stratospheric black carbon [Mills et al., 2008; Ross et al., 2010].
Figure A1 provides a summary of the processes included in the version of CESM1/CARMA in this study, and those treated in CESM1. As shown in Figure A1, CARMA calculates aerosol tendencies through microphysics parameterizations (e.g., emission, nucleation, condensational growth, coagulation, and deposition) and CESM1 is responsible for gas‐phase emission (e.g., SO2 and VOCs), gas phase and cloud phase chemistry, and deposition. The CARMA model includes carbonaceous aerosols (OC and BC), wind‐blown dust, sea salt, and sulfate. In the current CESM1/CARMA, we treat black carbon, sulfate deposited from the gas phase or from cloud evaporation, organic carbon, sea salt, sea‐spray sulfate, dust and secondary organics as internally mixed aerosol. Sulfate aerosol, called pure sulfate, created from nucleation from the gas phase and subsequent growth is treated as externally mixed with other aerosol types mentioned above. Hereafter, we refer to CARMA aerosol in two main groups: mixed aerosols and pure sulfate. Similar aerosol groupings are treated in other climate models such as seven‐mode ECHAM5‐HAM [Stier et al., 2005], and CESM1‐MAM3 and CESM1‐MAM7 [Liu et al., 2012]. CESM1‐MAM7 also includes ammonium aerosol that CARMA does not have at this moment.
Figure A1.
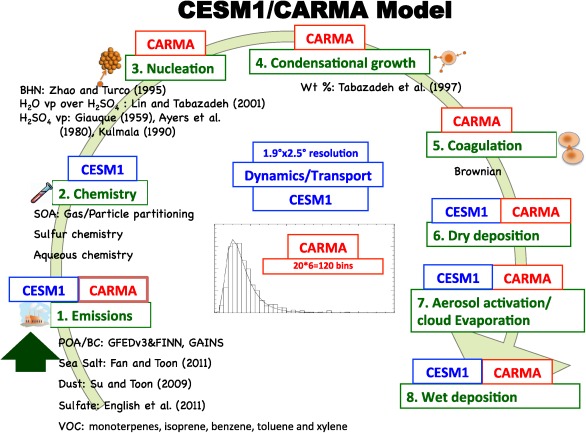
Diagram of the CESM1/CARMA model. In addition to sulfate, the model includes organics, dust, sea salt, black carbon, aqueous chemistry, and aerosol‐cloud interactions (activation and evaporation).
Figure A2.
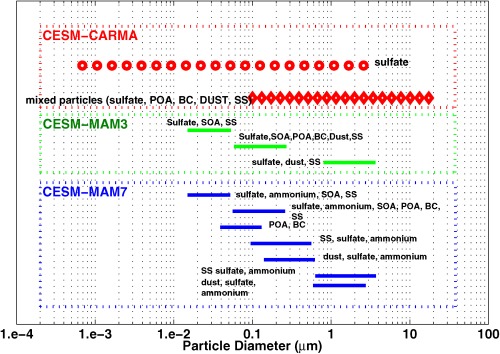
Diagram shows aerosol size bins and multiple aerosol modes: CARMA (red), MAM3 (green), and MAM7 (blue). CARMA sulfate bins are shown in circles, and mixed particle bins are shown in diamonds; modes from MAM3/MAM7 have line edges at the tenth and ninetieth percent of the number of particles in each mode described by Liu et al. [2012]. SS denotes sea salt. Bulk SOA in CESM1/CARMA is not shown in figure.
Aerosol size settings for CARMA and the CESM1 modal modules (MAM3 and MAM7) are shown in Figure A2. The CARMA sectional size settings can be changed easily by altering one parameter if needed to treat a specialized problem or one single aerosol species. The central size of each bin is shown in red circles (pure sulfate) or diamonds (mixed particle). For modal schemes, the tenth and ninetieth percent of global‐averaged number distribution of each mode are shown by green (MAM3) and blue (MAM7) lines. Generally the sectional model (CARMA) has wider size ranges for particles.
CESM1/CARMA separates the mixed aerosols into 20 discrete mass bins from approximately 0.05–8.7 μm in radius and considers the mass fraction of the aerosol in each size bin composed of OC, BC, dust, sea salt, and sea‐spray sulfate. The model separates pure sulfate particles into another set of 20 discrete bins from 0.2 nm to 1.3 μm. The bins track the dry mass of the particles, and in total there are 120 CARMA prognostic advected aerosol tracers in this CESM1/CARMA model.
Particle mass, size, and composition inside one CARMA particle bin are assumed homogenous. The various constituents of the particles are separately tracked, so for instance the mass of sulfate, black carbon, dust and so forth are known for each particle size bin. We often need to know the wet radius of a particle. In the tables, we provide the equations we use to compute the relative humidity and temperature‐dependent wet radius. We use the densities provided in Tables A4, A5, A6, A7, A8 to compute the overall volume of the mixed particle, including any water that may be present. This assumption ignores changes in density that may occur if a material is dissolved in the water.
Generally we run CESM1/CARMA while recomputing the coagulation kernels at every grid box and time step. For 1.9° × 2.5° horizontal resolution and 30 vertical levels, the model requires 8.5 h of wall‐clock time using 250 processors (2125 computing units) for a year‐long simulation, or 3.5 days of wall‐clock time for a decade‐long simulation. If coagulation kernels are not recomputed, the model requires 6.2 h of wall‐clock time for a 1 year simulation. CESM1/CARMA, as currently configured, contains a more advanced chemistry package, MOZART, than either the standard bulk or modal models. Shown in Table A1, CESM1/MAM7 with the full version of MOZART requires 3.1 wall‐clock hours for a 1 year simulation with the same resolution and computer processors, while CESM1/MAM7 without MOZART requires 1.6 wall‐clock hours. Of course, all of these models are in a state of evolution and can be altered to treat additional aerosol types or to expand their size resolution. Hence, intermodel comparisons are only useful for defined sets of studies. Nevertheless, CESM1/CARMA provides an option for decade‐scale climate runs using a sectional model as an alternative to the bulk or modal models.
Table A1.
Comparison Among Different Models on Computer Costsa
| Model | CESM1/CARMA3.0 | CESM1/CARMA3.0 | CESM1/MAM7 | CESM1/MAM3 | CESM1/MAM7* |
|---|---|---|---|---|---|
| Resolution | 1.9 × 2.5, 30 vertical levels | ||||
| Gas phase chemistry | CAM‐Chem | CAM‐Chem | CAM‐Chem | CAM‐Chem | None |
| Chemical reactions # | 234 | 234 | 210 | 210 | 7 |
| Aerosol tracers # | 138 | 138 | 31 | 15 | 31 |
| Wall‐clock hours | 8.5 h/yr | 6.2 h/yr | 3.1 h/yr | 2.4 h/yr | 1.6 h/yr |
| CPU | 250 | 250 | 250 | 250 | 250 |
| Notes | SOA use VBS; including stratospheric sulfate chemistry | No recomputation of coagulation kernels | Fixed yields for SOA | Fixed OH, HO2, O3, NO3 | |
Note CESM11/MAM7* represents MAM7 model with simplified gas phase chemistry.
A.1.2. Emission Database and Source Functions
A.1.2.1. SO2, DMS, and OCS Emissions
The current study includes sulfur dioxide (SO2), dimethylsulfide (DMS) and carbonyl sulfide (OCS) as sulfate aerosol precursors. Due to its long lifetime in the troposphere, OCS is specified with a constant surface concentration of 510 [Chin and Davis, 1995; Montzka et al., 2007]. Emission of SO2 and DMS are described in Emmons et al. [2010] and listed in Table A2.
Table A2.
Sulfur Emissions
| Quantity | Value | Reference |
|---|---|---|
| OCS | 510 pptv at the surface | Chin and Davis [ 1995] Montzka et al. [ 2007] |
| Anthropogenic SO2 | EDGAR‐FT2000 database | http://www.mnp.nl/edgar/ |
| Biomass burning SO2 | GFED version 2 database | van der Werf et al. [ 2006] |
| Volcanic SO2 | GEIA version 1 database | Andres and Kasgnoc [ 1998] |
| DMS | Marine biogeochemistry model HAMOCC5 | Kloster et al. [ 2006] |
A.1.2.2. VOCs Emissions
MOZART‐4 [Emmons et al., 2010] updated the isoprene oxidation scheme and the sources of volatile organic compounds (VOCs). In total five species are oxidized and treated as precursors of SOA, including two VOCs emitted by vegetation (isoprene and monoterpene) and three VOCs emitted from anthropogenic or biomass burning sources (benzone, tolune, and xylene). Emissions of isoprene are estimated by MEGAN2 (Model of Emission of Gases and Aerosols from Nature) [Guenther et al., 2006]. VOC emissions are summarized in Emmons et al. [2010] and listed in Table A3.
Table A3.
VOCs Emissions
Table A4.
Emission of POA and BC
| Quantity | Value | Reference |
|---|---|---|
| OC/BC biomass burning | GFED version 3 | van der Werf et al. [ 2010] |
| OC/BC anthropogenic | GAINS model | Amann et al. [ 2011] |
| Mass of emitted OM relative to carbon | 1.8 | IMPROVE report V [Hand et al., 2011] |
| Emitted size distribution | AERONET retrieved | Matichuk et al. [ 2008] |
| Density of OC/BC | 1.35 g/cm3 | Reid et al. [ 1998] |
| Solubility of OM | 0.2 | Tuned |
A.1.2.3. Primary Organics and Black Carbon
We assume primary organic carbon aerosol (POA) and black carbon (BC) are emitted internally mixed, but the masses of the different aerosol types are tracked separately in the model. The initial particle size distribution for biomass burning aerosol is based on a daily mean size distribution retrieved by AERONET at Jaru Reserve, Brazil on 20 September 2002. Matichuk et al. [2007, 2008] showed this distribution worked well for biomass aerosols in Southern Africa, and South America. Similar distributions have been found for boreal forest fires [Westphal and Toon, 1991]. We assume all primary organic aerosols and BC primary emissions involve the same initial size distribution. Of course, size distributions evolve through microphysical processes (e.g., coagulation, condensation, and deposition) discussed later. The anthropogenic emission of POA and BC includes gas‐flaring data following Amann et al. [2011]. The biomass combustion emission of POA and BC use the Global Fire Emission Database (GFED, version 3) [van der Werf et al., 2006, 2010]. According to van der Werf et al. [2006], total dry mass burned is first estimated from satellite retrievals (e.g., MODIS). Then emission factors for different types of fuel reported by Andreae and Merlet [2001] translate carbon mass burned to aerosol/gas emitted. The reported emission factors for OC (BC) range from 3.3 (0.48) to 9.7 (1.5) g/kg dry mass burned for different vegetation types. We also apply a [OM]:[OC] ratio of 1.8 to convert derived carbon mass to total organic aerosol mass as suggested by IMPROVE report V [Hand et al., 2011]. OC/BC emissions are summarized in Table A4.
A.1.2.4. Biological Particles
Primary biological aerosol particles (PBAP) contribute a large fraction of the organic aerosol mass budget over heavily vegetated areas [Heald and Spracklen, 2009]. Fungal spores and pollen grains compose the most important PBAP types. However, measured pollen diameters peak around 25–27 μm according to O'Connor et al. [2014], with size ranges from 21 to 82 μm according to Sabban and van Hout [2011]. The largest particle size simulated in the current model is about 30 μm. Thus pollen grains are not simulated in our model.
Uncertainties exist in fungal spore emissions. Després et al. [2012] summarized estimated global annual emissions by several studies and found they range from 8 Tg yr−1 [Sesatric and Dallafior, 2011] to 186 Tg yr−1 [Jacobson and Streets, 2009]. We assume a lognormal particle size distribution for spore particle emission with a mean radius ( ) of 1.5 μm and standard deviation ( ) of 1.2 according to Reponen [1995]. The total emission rate of spores ( , unit: # cm−2 s−1) is parameterized as: . Here (unit: # s−1 (leaf area, cm−2)) denotes the maximum emission rate over unit leaf area, as estimated from Hoose et al. [2010]; denotes leaf area index, a dimensionless quantity in unit of (leaf area, cm2)/cm2, which is based on 17 different plant functional types considered in the Community Land Model (CLM) [Lawrence et al., 2011]; and, denotes specific humidity. Heald and Spracklen [2009] show a positive correlation between water vapor content and mannitol concentration, a unique tracer of fungal spore. denotes the emission factor accounting for monthly variation, with values taken from Jacobson and Streets [2009, Table A2]. The annual emission of spores in this study is 60 Tg yr−1, which is within the very broad range reported by Després et al. [2012].
Spore emissions are put into 20 discrete mixed aerosol bins from 0.05 to 8.7 as part of POA, by solving the equation: , where denotes the lognormal distribution probability density function. The emission rate for each bin (unit: # cm−2 s−1) is parameterized as: . Number flux ( ) is converted to mass flux ( ) as: , where (unit: gram per particle) denotes mass per spore particle, estimated as . Density ( ) is assumed to be 1 g cm−3 [Heald and Spracklen, 2009] and which is in the range of values given by Jacobson and Streets [2009]. Parameterization of spore emissions is listed in Table A5.
Table A5.
Biological Particle Emission Parameters
| Quantity | Value | Reference |
|---|---|---|
| , mode radius | 1.5 μm | Reponen [ 1995] |
| , standard deviation | 1.2 | Reponen [ 1995] |
| , vegetation density | Community Land Model | Lawrence et al. [ 2011] |
| , maximum number emission rate | 0.01 # s−1 (leaf area, cm−2) | Hoose et al. [ 2010] |
| , monthly variation | Month dependent | Jacobson and Streets [ 2009] |
| Density | 1 g cm−3 | Heald and Spracklen [ 2009] |
| Solubility | 0.2 | Tuned |
A.1.2.5. Dust Source Function
Mineral dust is lifted by saltating sand grains. Saltation is driven by the surface stress represented by wind friction velocity. The dust source function follows Su and Toon [2009] and is based on Ginoux et al. [2001]. The total dust emission flux (unit: g cm−2 s−1) is parameterized as: , where stands for 10 m wind speed parameterized using wind stress and 10 m drag coefficient (Cd) under neutral condition: . The drag coefficient is calculated using the roughness length ( ) of the model grid cell predicted by the land model and the von Karman constant ( ). . is a scaling factor used to obtain the correct total dust emission and is model resolution dependent ( μg s2 m−5 for 1.9 × 2.5 resolution); denotes the dust erodibility factor, which describes the efficiency of dust lifting when winds exceed the threshold wind speed ( ). Erodibility factors (Se) derived from the TOMS aerosol index come from Ginoux et al. [2001], which is derived from the TOMS aerosol index. Su and Toon [2009] parameterized threshold velocity dependent on both particle size [Marticorena and Bergametti, 1995] and soil moisture [Ginoux et al., 2001] as: , where is the particle size‐dependent threshold velocity from Marticorena and Bergametti [1995]; denotes soil moisture ( ), which is predicted by CESM1.
A Weibull wind distribution [Gillette and Passi, 1988; Colarco et al, 2002] is used to represent subgrid wind velocity as described in Su and Toon [2009]. Wind speed is integrated from threshold wind velocity to infinity. The terms in the dust source function are replace by a Weibull correction term as:
where is a scale factor in the wind probability distribution function with unit of ms−1 following Justus et al. [1978] and Grini et al. [2005]. is the incomplete gamma function, and is the gamma function. is a shape parameter as a function of 10 m wind speed ( ) in the Weibull distribution.
The total emission flux ( ) is put into 20 CARMA mixed size bins, and the emission flux for each bin ( , unit: g cm−2 s−1) is parameterized as: . denotes the fraction of the total emission put into , which satisfies . CARMA divides 20 discrete bins into two groups dependent on bin size. One group is assumed to be composed of silt particles greater than 1 μm in radius and the other is a clay group with a smaller particle size [Tegen and Fung, 1994]. According to measurements by Prospero and Bonatti [1969], it is assumed that 90% of dust emission flux is put into silt bins, while the remaining 10% of flux is put into clay bins. For example, based on bin settings of the current model, the radius of first 12 particle bins are less than 1 μm and thus been categorized as the clay group:
Overall, the dust emission flux (unit: g cm−2 s−1) for each bin is calculated as: . Parameterizations of dust lifting are listed in Table A6.
Table A6.
Dust Emission Parameters
| Quantity | Value | Reference | |
|---|---|---|---|
| Se, Dust erodibility factor | Derived from TOMS aerosol index | Ginoux et al. [ 2001] | |
| Roughness length | Community Land Model | Lawrence et al. [ 2011] | |
| C, dust scaling parameter | 0.6 μg s2 m−5 (1.9 × 2.5) | Tuned | |
|
|
90% of flux in bins with particles radius >1 µm | Prospero and Bonatti [ 1969] | |
| Density | 2.65 g/cm3 | ||
| Solubility | 0.1 | Tuned |
A.1.2.6. Sea Spray Particle Source Function
When the wind blows over the ocean surface, sea spray particles in the atmosphere are produced primarily by bubble bursting, though the largest particles are produced by the wind blowing the crests off of waves. Sea spray particle sizes range across several orders of magnitude from several nanometers to several hundred microns. We assume sea spray particles are composed of salt, organics, and sulfate. In the next section we define our scheme to separate the composition of the total emissions.
The sea spray source function used in the current model is introduced by Fan and Toon [2011]. It combines several other source functions [e.g., Gong et al., 2003; Caffrey et al., 2006] that were developed for different particle size ranges. The sea spray aerosol number emission flux (unit: #m−2 s−1 μm−1) is described in Fan and Toon [2011] as follows:
For radius r = 0.01–0.8 μm,
For radius r = 0.8–8.7 μm,
is the dry diameter of the sea spray particles. See Clarke et al. [2006, Table 1] for β coefficients. The factor converts to .
Similar to the dust source function, a Weibull wind distribution is also used in the sea spray particle source function. It is integrated from threshold wind speed to infinity: , where denotes the portion of the sea spray source function that only depends on particle size, which is source function described above; the wind speed‐dependent part is based on the Weibull distribution. Thus, the total sea spray particle flux is parameterized as:
where denotes shape parameter, is the incomplete gamma function, and is the gamma function. To get particle mass emission rate ( , unit: g m−2 s−1) in each bin, the number emission flux (unit: # m−2 s−1 μm−1) is then multiplied by aerosol bin interval ( , unit: μm) and mass per particle in each bin ( , unit: gram per particle): . Parameterizations of sea spray emissions are listed in Table A7.
Table A7.
Sea Spray Particle Emission Parameters
| Quantity | Value | Reference |
|---|---|---|
| , threshold wind speed | 4 m/s | Fan and Toon [ 2011] |
| Density | 2.65 g/cm3 | |
| Solubility | 0.8 | Tuned |
Table A8.
Sea Spray Sulfate and Organics Parameters
| Quantity | Value | Reference |
|---|---|---|
| Chlorophyll A concentration | Derived from SeaWiFS satellite | O'Reilly et al. [ 1998] |
| Ratio of sulfate ion mass to | 9.83% | Lewis and Schwartz [ 2004] |
| Organic mass fraction | Chlorophyll dependent | O'Dowd et al. [ 2008] |
| Density (g/cm3) | 1.35 (organics), 1.923 (sulfate) | Reid et al. [ 1998] |
| Solubility | 0.2 (organics), 0.5 (sulfate) | Tuned |
A.1.2.7. Sea Salt, Marine Organics, and Sulfate
Marine organics and sulfates are assumed to be internally mixed with sea salt. We assign fractions of the sea salt flux defined in the previous section to sulfate and to marine organics. The annual marine organic aerosol emission is about 41 Tg C/yr. The source function for the marine organic submicron mass emission rate [O'Dowd et al., 2008] and supermicron mass emission rate [Gantt et al., 2009] are:
Here ( ) denotes the chlorophyll‐dependent mass contribution of organics in submicron (supmicron) sea spray aerosols. O'Dowd et al. [2008] shows a linear correlation between organic mass fraction and chlorophyll concentration: , while denotes the chlorophyll concentration ( ) derived from monthly averaged Level 3 SeaWiFS data [O'Reilly et al., 1998]. denotes sea spray aerosol mass ( ) flux at size bin of radius . Physically has an upper limit of 1. As may be seen the organic aerosol flux for particles smaller than 0.5 microns is always at least 10% of the total marine particle flux and organics can be dominant in this size range. Following Gantt et al. [2009], the organic mass flux for supermicron particles is assumed to be 3% of the mass flux of marine particles.
Savoie and Prospero [1977] show that sulfate mixed with sea salt droplets accounts for 10–15% of sea salt mass at numerous island and marine locations. O'Dowd and Smith [1993] provide evidence of coarse mode sulfate emitted directly with sea spray. In the current study, sea salt ( ), marine organics, and marine sulfate all contribute to the total sea spray particle mass. Considering that the observed mass fraction of sulfate ion in seawater is 0.27% and the fraction of sodium is 1.08% [Lewis and Schwartz, 2004], the emission of oceanic sulfate ion is estimated as 9.83% of the sea salt ( ) flux.
In CESM1/CARMA, sea spray particles are assumed to be mixture of sea salt ( ), sulfate, and organics. So the total sea spray flux is parameterized as: and , where denotes marine sulfate flux and denotes sea salt emission flux. The NaCl flux can be determined by subtracting the organic flux from the total sea spray flux:
Parameterizations of sea spray sulfate and organics are listed in Table A8.
A.1.3. Chemistry (SOA and Sulfur)
A.1.3.1. Organic Aerosols and SOA Chemistry
Organic aerosols are of great interest because they often compose a significant fraction of the aerosol loading [Zhang et al., 2007]. Organic aerosol classification is still open to debate. There are far too many types of organics to track them individually by composition. In the current study, we treat primary organics as nonvolatile particles as assumed by Hodzic and Jimenez [2011]. However, different from Hodzic and Jimenez [2011], oxidation of primary particles to secondary particles is not considered in the current model.
Treatment of secondary aerosols is a multistep process. First the precursor organic gases—monoterpenes, isoprene, benzene, toluene, and xylene—are oxidized in MOZART by oxidants such as , and under low and high conditions [Chung and Seinfeld, 2002; Henze and Seinfeld, 2006]. Then CESM1/CARMA considers gas/particle partitioning among oxidized organic compounds.
Instead of the traditional two‐product partitioning method [Odum et al., 1996], a volatility‐basis set scheme is used to simulate SOA formation depending on their volatility. Pye et al. [2010] divide SOA into five volatility bins (i.e., saturation concentration of 0, 0.1, 1, 10, and 100 μg/cm3). Our current study considers the last four of the five bins from Pye et al. [2010]. Table A9 summarizes the used for different VOCs under four different volatility bins denoted by C* in units of μg m−3 from Pye et al. [2010]. For monoterpenne, the model used the constants for ‐pinene under low NOX conditions.
Table A9.
Partitioning Constants ( ) Used in Four‐Bin SOA Module for Different VOCs or SOA Precursors
| C* bin | |||||
|---|---|---|---|---|---|
| VOCs | Oxidant | 0.1 | 1 | 10 | 100 |
| Isoprene | OH | 0 | 0.031 | 0 | 0.095 |
| Isoprene | NO3 | 0 | 0 | 0.217 | 0.092 |
| Monoterpenne | OH | 0.08 | 0.019 | 0.18 | 0.03 |
| Monoterpenne | O3 | 0.08 | 0.019 | 0.321 | 1.083 |
| Monoterpenne | NO3 | 0. | 0 | 0.09 | 0.015 |
| BENO2 | HO2 | 0.37 | 0 | 0 | 0 |
| BENO2 | NO | 0 | 0.078 | 0 | 0.793 |
| XYLO2 | HO2 | 0.3 | 0 | 0 | 0 |
| XYLO2 | NO | 0 | 0.025 | 0.036 | 0.09 |
| TOLO2 | HO2 | 0.36 | 0 | 0 | 0 |
| TOLO2 | NO | 0 | 0.032 | 0.094 | 0.08 |
Gas‐particle partitioning theory [Pankow, 1994; Odum et al., 1996] assumes equilibrium between the gas and particle phase for each semivolatile compound. The equilibrium coefficient is temperature dependent and proportional to the inverse of saturation concentration (C*): , where denotes reaction reference temperature, denotes enthalpy ( ) of vaporization, and denotes gas constant.
The current version of MOZART tracks five main types of secondary organics in the aerosol and the gas phase (SOG), respectively, based on their precursors: isoprene (SOAI/SOGI), monoterpenes (SOAM/SOGM), benzene (SOAB/SOGB), toluene (SOAT/SOGT), and xylene (SOAX/SOGX). The mathematical relation between gas and particle phase mass concentration is expressed as: , where and are the mass concentrations of secondary organic aerosol and gas of compound ; denotes the mass concentration of absorbing organic material. CESM1/CARMA uses the total mass across all POA bins for [OM] initially. Then the model solves for [OM] iteratively in equation by adding secondary organic aerosol ( ) into [OM].
A.1.3.2. Coupling SOA With CARMA Aerosol
CARMA is a bin‐resolved aerosol model. However, we treat the SOA as a bulk aerosol both to save computer time, and to be able to deal with the equilibrium calculations. However, for purposes of computing size distributions and other parameters that depend on the total aerosol, we assume SOA exists internally mixed in the mixed aerosol bins. Inspired by the APM model [Yu, 2011], bulk SOA are distributed into various bins of mixed aerosol when needed for outputting properties, or computing such things as radiative forcing. Since the particles are assumed to be internally mixed, we cannot add new particles into the bins, but instead must distribute the mass across the bins in a way that conserves particle number, but adds mass to the bins. According to condensation equation [Seinfeld and Pandis, 1998, equation (12.3)], the transfer rate from gas to aerosol phase for one single particle is proportional to aerosol particle size: , where denotes mass transfer rate, is aerosol diameter, denotes diffusion coefficient, denotes molecular weight of aerosol/gas species, is a correction factor, and denotes the difference between vapor pressure and equilibrium vapor pressure. We can rewrite the single particle condensation equation as . Given the number concentration in bin is , the total mass transfer rate into bin (i.e., ) is proportional to the ratio of total mass of bin to the second moment of particle diameter: . Thus, the mass fraction of SOA for each bin (i.e., ) can be calculated by normalizing the mass transfer rate in each bin as: . In order to conserve number when the mass is added to the bin, it is partitioned between adjacent bins so that the number of particles does not change, but mass is conserved.
A.1.3.3. Sulfur Chemistry
Sulfur chemistry is modeled following the package used in WACCM‐CARMA [refer to English et al., 2011, Table 1]. However, the current version of the model (CESM1‐CARMA) does not include stratospheric reactions among SO, ClO, BrO, and OClO radicals. CESM1‐CARMA also includes SO2 formation from DMS as used in MOZART‐4 [Emmons et al., 2010, Table 3] and CAM‐Chem [Lamarque et al., 2012, Table A1]. In this model, SO2 also forms cloud‐borne sulfate aerosol through aqueous chemistry in MOZART. Cloud borne sulfate is released when clouds or precipitation evaporates. Table A10 summarizes the sulfur chemistry used in different aerosol modules in CESM1. All the models have aqueous chemistry shown in last two rows and SO2 formation from DMS. But CARMA also includes photochemical reactions relevant to the stratosphere and more detailed sulfur chemistry also mainly relevant to the stratosphere as summarized in English et al. [2011].
Table A10.
Sulfur Chemistry (Gas and Aqueous Phase) Used in Different Modulesa
| CESM1/CARMA | Default CESM1/MAM7 | Bulk |
|---|---|---|
| H2SO4 + hv → SO3 + H2O | ||
| SO2 + hv → SO + O | ||
| SO3 + hv → SO2 + O | ||
| OCS + hv → S + CO | ||
| SO + hv → S + O | ||
| DMS + OH → SO2; | DMS + OH → SO2; | DMS + OH → a*SO2 + (1‐a)*MSA |
| DMS + OH → 0.5 * SO2 + 0.5 * MSA* | DMS + OH → 0.5 * SO2 + 0.5 * MSA* | |
| DMS + NO3 → SO2 + HNO3 | DMS + NO3 → SO2 + HNO3 | DMS + NO3 → SO2 |
| OCS + O → SO + CO | ||
| OCS + OH → SO2 + C + H | ||
| S + OH → SO + H | SO2 + OH → H2SO4 | SO2 + OH + M → SO4 + M |
| S + O2 → SO + O | ||
| S + O3 → SO + O2 | ||
| SO + OH → SO2 + H | ||
| SO + O2 → SO2 + O | ||
| SO + O3 → SO2 + O2 | ||
| SO + NO2 → SO2 + NO | ||
| SO2 + OH + M → HSO3 + M | ||
| HSO3 + O2 → SO3 + HO2 | ||
| SO3 + H2O → H2SO4 | ||
| S(IV) + H2O2 → SO4 | S(IV) + H2O2 → SO4 | S(IV) + H2O2 → SO4 |
| S(IV) + O3 → SO4 | S(IV) + O3 → SO4 | S(IV) + O3 → SO4 |
Note: MSA* is not tracked in CESM1/CARMA or default CESM1/MAM7.
MOZART considers two pathways for DMS oxidation with OH, which come from Chin et al. [1996]. One pathway is effective on low ambient temperature: DMS + OH → SO2; the other pathway of DMS oxidation has end products of MSA and SO2. The current version of MOZART used in CESM1/CARMA, does not track MSA.
A.1.4. Radiative Properties
CARMA precalculates aerosol radiative properties using a Mie based core‐shell code following Toon and Ackerman [1981]. CARMA creates lookup tables for radiative properties for each aerosol bin. Radiative properties strongly depend on particle size, which is one reason to use a sectional model. CARMA considers black carbon, organic, dust, sea‐spray, and sea salt sulfate particles to be internally mixed. It is assumed that liquid components, such as organics, and water‐soluble constituents (e.g., water, sulfate, and sea salt) form a liquid shell. Cores are composed of insoluble material such as black carbon and dust.
According to the IPCC V report [Stocker et al., 2013], dust and black carbon aerosols affect the climate by absorbing solar radiation, i.e., warming the atmosphere. The imaginary parts of refractive indices of the core are calculated dependent on the mass fraction of black carbon and dust which vary with location and time: , where and denotes BC and dust mass in the mixed particle, respectively. For simplicity, the real parts of refractive indices of the core are assumed to be the average value of those of dust and black carbon, which is not composition‐dependent: .
The refractive indices of the particle shells are set to be the same as the measured indices of sulfate aerosol for simplicity. In summary, refractive indices for core/shell are parameterized as:
The refractive indices of aerosols ( , , , , ) are wavelength‐dependent and listed in Table A11 from the OPAC project (Optical Properties of Aerosols and Clouds) [Hess et al., 1998].
Table A11.
Aerosol Refractive Indices Versus Wavelengtha
| Dust | Black Carbon | Sulfate | ||||
|---|---|---|---|---|---|---|
| Wavelength (µm) | Imag | Real | Imag | Real | Imag | Real |
| Short Wave Values | ||||||
| 3.419 | −0.018 | 1.51 | −0.556 | 1.877 | −0.158 | 1.367 |
| 2.759 | −0.028 | 1.52 | −0.527 | 1.832 | −0.057 | 1.315 |
| 2.312 | −0.012 | 1.523 | −0.503 | 1.813 | −0.003 | 1.358 |
| 2.041 | −0.008 | 1.529 | −0.492 | 1.802 | −0.001 | 1.38 |
| 1.77 | −0.007 | 1.53 | −0.481 | 1.791 | −0.001 | 1.393 |
| 1.444 | −0.006 | 1.53 | −0.458 | 1.768 | −0.000 | 1.405 |
| 1.27 | −0.005 | 1.53 | −0.451 | 1.761 | −0.000 | 1.412 |
| 0.957 | −0.004 | 1.53 | −0.44 | 1.76 | −0.000 | 1.422 |
| 0.693 | −0.004 | 1.53 | −0.43 | 1.75 | −0.000 | 1.428 |
| 0.517 | −0.006 | 1.53 | −0.443 | 1.75 | −0.000 | 1.43 |
| 0.387 | −0.014 | 1.53 | −0.461 | 1.75 | −0.000 | 1.442 |
| 0.299 | −0.024 | 1.53 | −0.47 | 1.741 | −0.000 | 1.468 |
| 0.227 | −0.03 | 1.53 | −0.45 | 1.62 | −0.000 | 1.484 |
| Long Wave Values | ||||||
| 55.556 | −0.7 | 2.34 | −1 | 2.69 | −0.22 | 1.89 |
| 23.529 | −0.857 | 2.904 | −0.884 | 2.501 | −0.152 | 1.913 |
| 17.699 | −0.462 | 1.748 | −0.825 | 2.398 | −0.085 | 1.932 |
| 15.038 | −0.263 | 1.508 | −0.791 | 2.332 | −0.223 | 1.586 |
| 13.158 | −0.319 | 1.911 | −0.764 | 2.287 | −0.195 | 1.678 |
| 11.111 | −0.26 | 1.822 | −0.734 | 2.234 | −0.441 | 1.758 |
| 9.709 | −0.65 | 2.917 | −0.714 | 2.198 | −0.696 | 1.855 |
| 8.85 | −0.373 | 1.557 | −0.696 | 2.166 | −0.695 | 1.597 |
| 7.782 | −0.093 | 1.242 | −0.668 | 2.114 | −0.459 | 1.147 |
| 6.969 | −0.105 | 1.447 | −0.644 | 2.054 | −0.161 | 1.261 |
| 6.098 | −0.061 | 1.432 | −0.624 | 2.028 | −0.172 | 1.424 |
| 5.848 | −0.101 | 1.18 | −0.674 | 2.124 | −0.551 | 1.164 |
| 5.155 | −0.025 | 1.473 | −0.604 | 1.977 | −0.144 | 1.352 |
| 4.619 | −0.011 | 1.495 | −0.593 | 1.948 | −0.12 | 1.379 |
| 4.31 | −0.008 | 1.5 | −0.586 | 1.933 | −0.122 | 1.385 |
| 4.008 | −0.007 | 1.5 | −0.58 | 1.921 | −0.126 | 1.385 |
Note: database from OPAC project (optical properties of aerosols and clouds [Hess et al., 1998]).
CARMA provides detailed aerosol information (i.e., particle wet radius and composition) that vary with location and time. These are used to look up the appropriate optical properties (e.g., scattering coefficient, absorption coefficient and single scattering albedo, and asymmetry parameter) that are then passed to the CESM1's radiation model (RRTMG) [Iacono et al., 2008] for online radiative calculation as forcing and heating rates.
A.1.5. Aerosol‐Cloud Interaction
CARMA interacts with the two‐moment cloud model in CESM1 [Morrison and Gettelman, 2008; Gettelman et al., 2008, 2010]. CARMA aerosols that are cloud condensation nuclei (CCN) can be activated, and then released when cloud evaporates. Sulfate aerosol formation from SO2 oxidization in cloud droplets is also included in CESM1/CARMA.
A.1.5.1. Aerosol Activation
Aerosols are activated to CCN following the methods of Ghan et al. [1993, 1995], and Abdul‐Razzak and Ghan [2002]. However, these studies have slightly different treatments of activation. Ghan et al. [1993] calculate critical supersaturation ( ) and maximum supersaturation ( ) that particles can obtain from updraft for a single mode. Ghan et al. [1995] applied the same method for multiple log‐normal modes instead of a single particle mode. Abdul‐Razzak and Ghan [2002] determine based on calculated effective critical supersaturation ( ) across all bins for sectional models, which is used in our current study.
In this study we define pure sulfate particles as group , and mixed particles sections as group . Critical supersaturation of a particle with dry radius of in bin i and group j is parameterized as: , where denotes hygroscopicity and denotes surface tension effects in Ghan et al. [1993]. Hygroscopicity is parameterized as dependent on number of ions , where denotes osmotic coefficient, ( ) denotes water (aerosol) molecular weight, and ( ) denotes water (aerosol) density. Surface tension term is parameterized dependent on surface tension ( ) and temperature ( ) as . Following Abdul‐Razzak and Ghan [2002], is determined for pure sulfate sections and mixed particle sections, respectively: , where denotes bin index in each group; denotes number concentration in bin of group . is then determined based on (j = 1, 2) calculated for two groups following the method from Ghan et al. [1995]:
where ζ and η are dimensionless terms in Ghan et al. [1993]. If is greater than critical supersaturation, the particle is activated as a CCN.
A.1.5.2. Aerosol Released by Cloud Evaporation
Cloud‐borne aerosols are released when cloud evaporates. Cloud‐borne aerosols in CESM1/CARMA are tracked with the same number of bins as interstitial aerosols, which means one particle bin in the cloud droplet corresponds to one interstitial bin. When the cloud forms, one droplet is formed on each aerosol. CESM1 tracks the number of cloud drops, so the number of aerosols released is just the number of cloud drops that evaporate. If there is no cloud droplet coagulation, and no in‐cloud chemistry, we would release one particle of the original size back to the aerosol bins when the cloud evaporates. In the current model coagulation of cloud droplets is not modeled. However, as shown in Table A10, CESM1/CARMA includes aqueous chemistry from MOZART for SO2 gas uptake and oxidization inside cloud droplets. Cloud‐borne sulfate aerosols are formed through reactions between SO2 and ozone/hydrogen peroxide [Barth et al., 2000]. In the model, the total sulfate mass formed ( ) is first computed by MOZART. CARMA puts into the cloud‐borne mixed particle bins in proportion to the sulfate mass in each bin before aqueous chemistry happens. Thus the mass put into each mixed bin is calculated as: , where denotes cloud‐borne sulfate mass in mixed aerosol bin. Newly formed sulfate aerosols inside each droplet formed through aqueous chemistry are expected to coagulate with the existing aerosol in each droplet, thus the number is conserved. However, the current treatment allows the particle number to change within each bin so that mass is added due to the chemistry, while total number is conserved.
Different assumptions are made for rain. We assume pure sulfate formed in cloud is part of the mixed particles inside raindrops. When rain evaporates, all the released materials are put into the mixed aerosol bins. In addition, all the particles inside one raindrop, which originated from the large number of cloud droplets that coalesced to form the raindrop, are assumed to fully coagulate to form one bigger particle. The particles released from raindrop evaporation are assumed to be bigger than the largest bin (i.e., 8.7 μm in radius) in current model and we assume the particles are removed quickly from the air.
A.1.6. Hygroscopic Growth and Sulfuric Acid Physical Properties in CARMA
Water vapor condenses on aerosols (e.g., sea salt, sulfate, and organics) once they exceed their deliquescent relative humidity. The particle size increase due to the addition of the water is important for particle microphysical processes (e.g., sedimentation, dry deposition, wet deposition and coagulation) and optical properties. CARMA assumes particles are always in an equilibrium state with ambient water vapor as deliquesced aerosols. Thus, CARMA does not track directly the amount of water condensed on particles, and it does not allow for the possibility that efflorescence may occur and return the particles to a dry state below the deliquescent relative humidity.
A.1.6.1. Wet Radius of Pure Sulfate
Weight percent of sulfuric acid in H2SO4‐H2O particles is defined as:
| (A1) |
where ( ) denotes H2SO4 mass concentration (volume) in H2SO4‐H2O particles; denotes dry density of sulfuric acid; ( ) denotes mass concentration (volume) of H2SO4‐H2O particles; denotes wet particle density. The wet radius of sulfuric acid particle ( ) is calculated as a function of as:
| (A2) |
Here denotes dry radius of sulfuric acid particles.
Following Tabazadeh et al. [1997], sulfuric acid weight percent is parameterized as:
| (A3) |
where denotes sulfuric acid molality as a function of temperature and water activity ( ): . Here functions and are given in Tabazadeh et al. [1997, Table 2]; denotes water partial pressure in air calculated from idea gas law and denotes vapor pressure of water over pure water described in section A6.3.
A.1.6.2. Wet Radius of Mixed Particles
Wet radius [unit: cm] for mixed aerosols is calculated following Petters and Kreidenweis [2007] as:
| (A4) |
where denotes water activity, denotes mass weighted hygroscopicity of an internally mixed particle with different aerosol components. In this equation if the Kelvin effect is neglected, then relative humidity ( ) can be used instead of water activity [Seinfeld and Pandis, 1998, equation (10.63)]. To avoid generating too large particles through swelling, relative humidity is constrained to be less than 99.5% in CARMA when calculating the particles' wet radius. Hygroscopicity values for different aerosol species are given in Tables A4, A5, A6, A7, A8.
Secondary organics aerosols (SOA) are formed through gas/particle partitioning theory, in which process the organic vapors condense onto the mixed particles. However, the model treats SOA as bulk aerosols with four classes of volatility. Mass fraction of total SOA partitioning onto section i of mixed particles ( ) is described in section A3.2. Thus, the wet radius considering SOA is: , where denotes mass concentration of total SOA; denotes mass fraction of total SOA partitioning onto section i of mixed particles; denotes mass concentration of mixed particle in section i excluding SOA. In the calculation above, we neglect the density difference between SOA and total mixed particle.
A.1.6.3. Vapor Pressure of Water and Sulfuric Acid
The water vapor pressure ( , unit: dyne cm−2) over pure water is parameterized as function of temperature following Murphy and Koop [2005]:
For liquid water:
| (A5) |
where 123 < T < 322 K.
For ice:
| (A6) |
where T > 110 K.
Equilibrium vapor pressure of sulfuric acid ( , unit: dyne cm−2) is parameterized as a function of weight percent ( ) defined in section A6.1. The scheme is originally from in Ayers et al. [1980] with temperature correction by Kulmala and Laaksonen [1990] and thermal dynamics constants from Giauque [1959].
| (A7) |
where, denotes factor considers water in H2SO4‐H2O particles; , which is the low end of measurement range by Ayers et al. [1980]; denotes correction factor from Kulmala and Laaksonen [1990].
A.1.7. Sedimentation in CARMA
In CARMA, particles are moved downward in each model layer by gravitational sedimentation. As described in Fan and Toon [2011], the sedimentation velocity (or fall velocity ) for spheres in CARMA is calculated as:
| (A8) |
where (unit: kg m−1 s−1) denotes air dynamic viscosity following Sutherland [1893]; denotes air density; denotes wet particle density; denotes wet particle radius; denotes gravitational acceleration; denotes Reynolds number; denotes slip correction factor; and denotes air mean free path, where is thermal velocity of air molecule with mass and denotes air density. Reynolds number is calculated using fall velocity of stoke flow: . CARMA also has equations for particle fall velocities for a variety of shapes including oblate and prolate spheroids, and fractals.
It is rare for aerosols to be in the high Reynolds number regime in equation (A8). However, as one moves up in altitude the mean free path increases and the ratio of mean free path to particle radius (the Knudsen number) becomes larger than one. Then the slip correction factor deviates significantly from one. In the limit of large Knudsen number the fall velocity equation is .
Figure A3 (right) illustrates the calculated fall velocity from CESM1/CARMA as a function of altitude for 20 aerosol size bins (dry radius from 0.05 to 8.7 μm) denoted by each line. Sedimentation velocities for each bin are global averages and calculated using their wet radius. For particles larger than several μm, the velocity decreases only slightly with altitude as the air viscosity changes in response to temperature. For small particles the fall velocity increases with altitude as the air density declines. Each line represents a size bin: the leftmost line denotes a bin of 0.05 μm in dry radius and the rightmost line denotes the biggest bin of 8.7 μm. The only particle properties involved in the fall velocity are the particle density and the radius. The particle densities are given in Tables A4, A5, A6, A7, A8.
Figure A3.
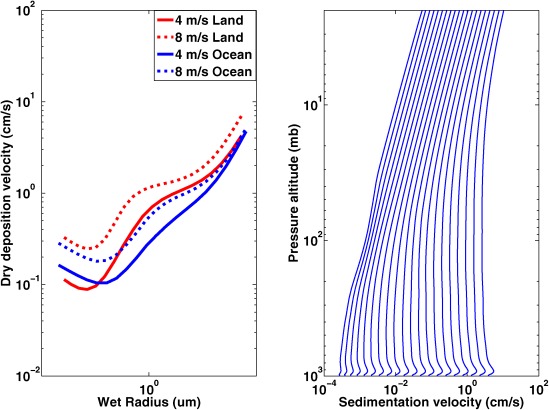
(left) CESM1/CARMA‐predicted dry deposition velocity (cm s−1) at model surface as a function of wet radius with different wind speed; (right) modeled sedimentation velocity (cm s−1) as a function of altitude, each line represents a size bin. The leftmost line denotes the smallest bin.
A.1.8. Dry Deposition in CARMA
In CARMA, particles are removed by dry deposition in the surface layer. The dry deposition velocity ( , cm s−1) is parameterized following Zhang et al. [2001] as:
| (A9) |
where denotes the sedimentation velocity ( ) at model surface layer, denotes aerodynamic resistance, and denotes surface layer resistance.
The deposition velocity depends on the surface type (i.e., land, ocean, and sea ice) in the grid cell through roughness length and other parameters. Aerodynamic resistance ( ) over land is provided by the CESM1 land model, while over ocean and sea‐ice is calculated separately in CARMA following Seinfeld and Pandis [1998] as , where denotes the center of model bottom layer, denotes the friction velocity dependent on 10 m ( ) wind and drag coefficient ( ) calculated from Community Land model, denotes the Von Karman constant, denotes the stability function [Seinfeld and Pandis, 1998, equation (19.13)], and is the roughness length (unit: m) for ocean and sea ice, respectively. Surface resistance ( ) is parameterized following Zhang et al. [2001]. denotes the fraction of particles that stick to the surface when they hit it; is an empirical constant and is taken as 3; , and denote collection efficiency from Brownian diffusion, impaction, and interception respectively. Detailed parameterizations are listed in Table A12.
Table A12.
Summary of Dry Deposition Parameterizationa
| Item | Formula | Parameter Settings | ||
|---|---|---|---|---|
| Dry deposition velocity, |
|
sedimentation velocity at surface layer | ||
| Aerodynamic resistance, | , for ocean/sea ice; for land from CESM1 Land model | κ=0.4, Von Karman constant;μ*, friction velocity;ψ, stable function | ||
| Surface layer resistance, |
|
fraction of particles that stick to the surface; | ||
| empirical constant | ||||
| Brownian diffusion collection efficiency, |
|
; | ||
| , Kinetic air viscosity; | ||||
| , Brownian diffusivity | ||||
| Impaction collection efficiency, |
|
, Stoke number | ||
| Interception efficiency, |
|
|
The dry deposition tendency is written in implicit format to avoid generating negative values: . Here is particle concentration at time ; and are time and spatial increments. The solution shows concentrations decrease exponentially in time: . However, the solution for explicit format is , which may lead to negative concentrations if the deposition velocity ( ) is too large.
Modeled dry deposition velocity at the model surface is shown in Figure A3, left, as a function of wet radius at wind speeds of 4 and 8 m/s over ocean and land. shows a minimum value around 0.2 μm. The reason for this behavior is that small particles are efficiently transported to surface through Brownian diffusion, and large particles are quickly transported by gravitation. The particles with intermediate size (around 0.2 μm) are transported mainly by inertial impaction, which is not as efficient as the other mechanisms. is generally larger over ocean than land for the same wind speed, and increases more rapidly with wind speed over the ocean. These trends are due to the lower surface roughness over the ocean than the land, so that the friction wind speed is lower for a given 10 m wind speed with lower dry deposition velocities.
A.1.9. Wet Deposition in CESM1
CARMA uses the wet deposition scheme in CESM1 [Rasch et al., 2000; Barth et al., 2000] for both in‐cloud and below‐cloud scavenging. Some details were discussed in the main text of this paper.
CARMA aerosols are activated into cloud as CCN and then removed by in‐cloud scavenging dependent on cloud fraction in each grid box, cloud water amount, and rate of precipitation formation.
The below cloud particle mixing ratio loss rate is parameterized as , where denotes the precipitation rate, denotes the aerosol mixing ratio, and denotes the below‐cloud scavenging coefficient, defined as the washout coefficient ( ) normalized by the precipitation rate. The below‐cloud scavenging coefficient is dependent on the aerosol and raindrop size distributions according to observational studies [Andronache, 2003; Andronache et al., 2006]. Online calculation of the scavenging coefficient for both aerosol and precipitation spectra is quite expensive [Henzing et al., 2006] so numerous studies have been implemented to parameterize or simplify the coefficient calculation in global models. These approaches include (1) simple bulk parameterizations based on precipitation rate by Balkanski et al. [1993] (used in the CAM/CARMA model by Fan and Toon [2011] as well as Su and Toon [2009]); (2) aerosol size‐dependent scavenging based on typical precipitation rates and assumed log‐normal raindrop distributions [Dana and Hales,1976] (used in IMPACT model [Liu et al., 2005]); (3) scavenging which is a function of aerosol mode and is scaled by rain or snow flux (used in ECHAM5‐HAM model) [Stier et al., 2005]; (4) scavenging which is aerosol size, raindrop size, and precipitation rate‐dependent using look‐up tables [Croft et al., 2009]; (5) scavenging coefficients which are aerosol size and precipitation rate‐dependent found using Gamma raindrop distribution based on De Wolf [2001] and [Henzing et al., 2006] (used in APM model by Yu and Luo [2009]); and (6) scavenging coefficients which are aerosol size and precipitation rate dependent and based on Marshall‐Palmer raindrop distributions (developed in current study see Appendix B). Figure B1 shows calculated scavenge coefficient as a function of precipitation rate and particle radius.
A.1.10. Nucleation in CARMA
CARMA parameterizes binary homogenous nucleation (BHN) using classic theory modified by Zhao and Turco [1995]. A binary solution of H2SO4‐H2O is considered. The equilibrium vapor pressure of water over the binary solution is calculated using Lin and Tabazadeh [2001], while the equilibrium vapor pressure of sulfuric acid is from Ayers et al. [1980] as described in sections A6.1 and A6.3.
The classical theory for the binary homogenous nucleation rate ( , unit: particles ) applied to H2SO4‐H2O solution is:
| (A10) |
where denotes critical size of the cluster. When the size of the cluster reaches the critical value the cluster is stable and grows through condensation. denotes the number density of water molecules in the gas phase. The Boltzmann constant. ; denotes the molecular impingement rate of sulfuric acid on the embryo surface (unit: molecules ). denotes molecular weight of H2SO4. denotes the change in Gibbs free energy between the condensed and vapor state (unit: ), where denotes surface tension of cluster (unit: ) calculated using constants from Sabinina and Terpugow [1935].
To solve the BHN equation, the critical size of the stable cluster and corresponding minimum Gibbs free energy (i.e., the saddle point) are required. These can be found by solving the equation . Zhao and Turco [1995] transform the saddle point search to a ‐ space where denotes weight percent of sulfuric acid in the solution and denotes volume of cluster. The advantage of the transformation is that the unique solution under two 1‐dimension spaces is computationally rapid.
There are many issues related to nucleation not treated in our model, such as the role of ions, organics, and ammonia in altering the free energies.
A.1.11. Growth and Evaporation in CARMA
In CESM1/CARMA, condensation and evaporation of sulfuric acid is parameterized following Toon et al. [1989]:
| (A11) |
where denotes the rate of particle mass change in a size bin (g cm−3 s−1); denotes the partial pressure of sulfuric acid in the ambient air; denotes the saturation vapor pressure of sulfuric acid over a flat surface described in section A6.3 (assumed to be zero over mixed particles, explained later). The vapor pressure correction factor represents the Kelvin (curvature) effect ( ), where represents surface tension and denotes the solution density. In determining the vapor pressure of pure sulfate it is assumed that the ambient water vapor fixes the solution composition, as discussed in section A6.3. and are particle growth kernels parameterized in Toon et al. [1989] as a function of vapor diffusivity ( ) and thermal conductivity ( ), where denotes molecular weight of sulfuric acid; denotes latent heat of condensation; and are ventilation factors to represent the effects of motion of particles through the air on condensation and thermal conduction; Following Fuchs and Sutugin [1971], vapor diffusivity is parameterized as: ; and thermal conductivity is parameterized as: . Here denotes temperature dependent diffusivity in air; denotes the thermal conductivity of air with ambient temperature ; and are factors for particle shape correction and set to unity for spherical particles; and are Knudsen numbers defined by the ratio of mean free path to particle size, where , , denotes mean thermal velocity of a water molecule, denotes mean thermal velocity of air molecules, denotes heat capacity of air; and are factors dependent on Knudsen numbers:
where and denotes sticking coefficient and thermal accommodation coefficient, and assumed to be unity [Fuchs and Sutugin, 1971].
For the pure particles we assume that growth occurs on sulfuric acid. For the mixed particles we assume that the sulfuric acid has been fully neutralized to sulfate, and consequently has zero vapor pressure (i.e., ). So the condensation and evaporation equation for mixed particles is .
A.1.12. Coagulation in CARMA
In CESM1/CARMA, coagulation is simulated among pure sulfate particle bins and among mixed particle bins, as well as between pure sulfate and mixed particle bins. The basic coagulation equation used in CARMA is . Here is the coagulation kernel between particles of volume and particles of volume ; denotes the concentration of particles with volume . The two terms on the right side of coagulation equation represent the production rate and the loss rate, respectively. The production rate of particles of volume is due to coagulation of smaller particles and the loss rate of particles of volume is due to coagulation to form bigger particles.
For aerosols only Brownian coagulation is important. In Brownian coagulation particles collide due to random motion in a fluid. The Brownian coagulation kernel ( ) is parameterized follows Fuchs [1964] as:
| (A12) |
where and denotes radius of particle and respectively; denotes the thermal velocity of particle of mass of ; denotes the diffusion coefficient of particle , where kB is Boltzman constant; is the slip correction factor; denotes air viscosity. and are described in section A7; denotes the mean distance from the center of a sphere reached by particles leaving the surface of the sphere and traveling a distance of particle mean free path ( ): , where .
In the continuum regime ( ), particles encounter many air molecules in moving a distance comparable to their radius, and the resistance to motion comes from air viscosity; for the free‐molecular regime (i.e., ) particles encounter few air molecules in moving a distance comparable to a radius and the resistance to motion comes from the inertia of the particles. In continuum regime and free‐molecular regime, Brownian coagulation kernels can be simplified as:
| (A13) |
where denotes probability that the two particles will stick together. Figure A4 shows Brownian coagulation kernels (cm3 s−1) at the surface and at 20 km are similar, which is due to the low dependence of kernels on temperature. Kernels are relatively small when two particle sizes are similar, and become larger when two particles have sizes which differ from each other.
Figure A4.
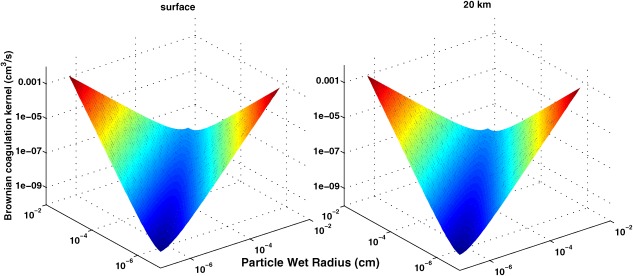
Calculated Brownian coagulation kernel (cm3 s−1) at (left) surface and (right) 20 km as a function of particle radius. Colors are used to make the graph easier to read.
A.1.13. Comparison of Aerosol Burden With Different Meteorology and Emissions
Table A13 lists simulated aerosol burden (Tg) using different aerosol modules. In addition to CARMA and Liu et al. [2012], additional runs of CESM‐MAM7 (denoted by MAM7*) are included in Table A13. MAM7* is driven by the same meteorology winds (i.e., MERRA) from 2009 to 2011 and the same anthropogenic emissions of BC and POA used in CARMA. Simulated aerosol burden is within 20% between MAM7* and Liu et al. [2012].
Table A13.
| Burden (Tg) | CARMA | Liu et al. [2012] | MAM7* |
|---|---|---|---|
| POA | 1.63 | 0.68 | 0.61 |
| SOA | 1.27 | 1.15 | 1.14 |
| BC | 0.14 | 0.093 | 0.073 |
| SALT | 8.77 | 7.58 | 7.5 |
| DUST | 12.33 | 24.7 | 21.6 |
| SULFATE | 1.32 | 0.47 | 0.42 |
Note: MAM7* run is CESM‐MAM7 driven by MERRA reanalysis winds from 2009 to 2011. Anthropogenic emissions of BC and POA are the same as CARMA run.
Appendix B. Below Cloud Scavenging Parameterization
We consider monodisperse particle washed out by a raindrop size distribution, and the washout coefficients are given by Engelmann [1968]:
where denotes particle radius; denotes raindrop radius; denotes collection efficiency between particle of radius and raindrop of radius ; denotes raindrop number flux (unit: ) with radii from to ; is the number pdf for rain distribution, and is the total flux of rainfall. We assume the rainfall spectrum is invariant with rainfall rate J ( ), the rainfall rate is thus given by Dana [1971]:
Thus, we calculate the scavenging coefficient normalized by rainfall rate J (referred to as the scavenging coefficient (unit: ) hereafter):
Figure B1.
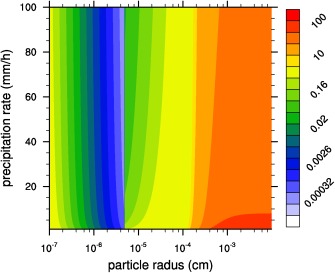
Scavenging coefficient (1/cm) using Marshall‐Palmer raindrop distribution as a function of the wet aerosol radius and precipitation rate.
According to Dana and Hales [1976], the collection efficiency used in washout coefficient calculation (a, R, cm) is
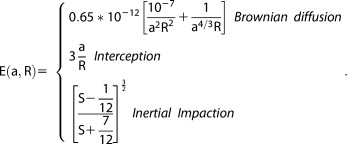 |
Based on the simplified collection efficiency:
We rewrite the scavenging coefficients for different modes (i.e., diffusion, interception, and Initial):
As suggested by Rogers and Yau, we assume the raindrop size follows Marshall and Palmer distribution:
where N(R)dR is the number of drops per unit volume with diameters between R and (R+dR), and coefficient , the pdf of Marshall and Palmer distribution is:
where denotes stoke number dependent on particle radius ( ) and density ( ). The scavenging coefficient dependent on Rainfall rate and particle radius is:
Yu, P. , Toon O. B., Bardeen C. G., Mills M. J., Fan T., English J. M., and Neely R. R. (2015), Evaluations of tropospheric aerosol properties simulated by the community earth system model with a sectional aerosol microphysics scheme, J. Adv. Model. Earth Syst., 7, 865–914, doi:10.1002/2014MS000421.
References
- Abdul‐Razzak, H. , and Ghan S. J. (2002), A parameterization of aerosol activation: 3. Sectional representation, J. Geophys. Res., 107(D3), 4026, doi:10.1029/2001JD000483. [Google Scholar]
- Ackerman, T. P. , and Toon O. B. (1981), Absorption of visible radiation in atmosphere containing mixtures of absorbing and nonabsorbing particles, Appl. Opt., 20, 3661–3667, doi:10.1364/AO.20.003661. [DOI] [PubMed] [Google Scholar]
- Adams, P. J. , and Seinfeld J. H. (2002), Predicting global aerosol size distributions in general circulation models, J. Geophys. Res., 107(D19), 4370, doi:10.1029/2001JD001010. [Google Scholar]
- Amann, M. , et al. (2011), Cost effective control of air quality and greenhouse gases in Europe: Modeling and policy applications, Environ. Modell. Software, 26, 1489–1501. [Google Scholar]
- Andreae, M. O. , and Merlet P. (2001), Emission of trace gases and aerosols from biomass burning, Global Biogeochem. Cycles, 15, 955–966, doi:10.1029/2000GB001382. [Google Scholar]
- Andres, R. , and Kasgnoc A. (1998), A time‐averaged inventory of sub‐aerial volcanic sulfur emissions, J. Geophys. Res., 103, 25,251–25,261. [Google Scholar]
- Andronache, C. (2003), Estimated variability of below‐cloud aerosol removal by rainfall for observed aerosol size distributions, Atmos. Chem. Phys., 3, 131–143. [Google Scholar]
- Andronache, C. , Gronholm T., Laakso L., Phillips V., and Venalainen A. (2006), Scavenging of ultrafine particles by rainfall at a boreal site: Observations and model estimations, Atmos. Chem. Phys., 6, 4739–4754. [Google Scholar]
- Arimoto, R. , Duce R. A., Savoie D. L., Prospero J. M., Talbot R., Cullen J. D., Tomza U., Lewis N. F., and Ray B. J. (1996), Relationships among aerosol constituents from Asia and the North Pacific during PEM‐West A, J. Geophys. Res., 101, 2011–2023. [Google Scholar]
- Ayers, G. P. , Gillett R. W., and Gras J. L. (1980), On the vapor‐pressure of sulfuric acid, Geophys. Res. Lett., 7, 433–436. [Google Scholar]
- Bardeen, C. G. , Toon O. B., Jensen E. J., Marsh D. R., and Harvey V. L. (2008), Numerical simulations of the three‐dimensional distribution of meteoric dust in the mesosphere and upper stratosphere, J. Geophys. Res., 113, D17202, doi:10.1029/2007JD009515. [Google Scholar]
- Bardeen, C. G. , Toon O. B., Jensen E. J., Hervig M. E., Randall C. E., Benze S., Marsh D. R., and Merkel A. (2010), Numerical simulations of the three‐dimensional distribution of polar mesospheric clouds and comparisons with Cloud Imaging and Particle Size (CIPS) experiment and the Solar Occultation For Ice Experiment (SOFIE) observations, J. Geophys. Res., 115, D10204, doi:10.1029/2009JD012451. [Google Scholar]
- Bardeen, C. G. , Gettelman A., Jensen E. J., Heymsfield A., Conley A. J., Delanoe J., Deng M., and Toon O. B. (2013), Improved cirrus simulations in a general circulation model using CARMA sectional microphysics, J. Geophys. Res. Atmos., 118, 11,679–11,697, doi:10.1002/2013JD020193. [Google Scholar]
- Barth, M. C. , Rasch P. J., Kiehl J. T., Benkovitz C. M., and Schwartz S. E. (2000), Sulfur chemistry in the National Center for Atmospheric Research Community Climate Model: Description, evaluation, features, and sensitivity to aqueous chemistry, J. Geophys. Res., 105, 1387–1415, doi:10.1029/1999JD900773. [Google Scholar]
- Bond, T. C. , et al. (2013), Bounding the role of black carbon in the climate system: A scientific assessment, J. Geophys. Res. Atmos., 118, 5380–5552, doi:10.1002/jgrd.50171. [Google Scholar]
- Brühl, C. , Lelieveld J., Crutzen P. J., and Tost H. (2012), The role of carbonyl sulphide as a source of stratospheric sulphate aerosol and its impact on climate, Atmos. Chem. Phys., 12, 1239–1253, doi:10.5194/acp-12-1239-2012. [Google Scholar]
- Caffrey, P. F. , Hoppel W. A., and Shi J. J. (2006), A one‐dimensional sectional aerosol model integrated with mesoscale meteorological data to study marine boundary layer aerosol dynamics, J. Geophys. Res., 111, D24201, doi:10.1029/2006JD007237. [Google Scholar]
- Canagaratna, M. R. , et al. (2007), Chemical and microphysical characterization of ambient aerosols with the aerodyne aerosol mass spectrometer, Mass Spectrom. Rev., 26(2), 185–222, doi:10.1002/mas.20115. [DOI] [PubMed] [Google Scholar]
- Carrico, C. M. , et al. (2004), Hygroscopic growth behavior of a carbon‐dominated aerosol in Yosemite National Park, Atmos. Environ., 39, 1393–1404, doi:10.1016/j.atmosenv.2004.11.029. [Google Scholar]
- Chin, M. , and Davis D. D. (1995), A reanalysis of carbonyl sulfide as a source of stratospheric background sulfur aerosol, J. Geophys. Res., 100, 8993–9005, doi:10.1029/95JD00275. [Google Scholar]
- Chin, M. , Jacob D. J., Gardner G. M., Foreman‐Fowler M. S., Spiro P. A., and Savoie D. L. (1996), A global three‐dimensional model of tropospheric sulfate, J. Geophys. Res., 101, 18,667–18,690, doi:10.1029/96JD01221. [Google Scholar]
- Chin, M. , Rood R. B., Lin S.‐J., Müller J.‐F., and Thompson A. M. (2000), Atmospheric sulfur cycle simulated in the global model GOCART: Model description and global properties, J. Geophys. Res., 105, 24,671–24,687, doi:10.1029/2000JD900384. [Google Scholar]
- Chin, M. , Diehl T., Tan Q., Prospero J. M., et al. (2014), Multi‐decadal variations of atmospheric aerosols from 1980 to 2009: Sources and regional trends, Atmos. Chem. Phys., 14, 3657–3690, doi:10.5194/acp-14-3657-2014. [Google Scholar]
- Chu, W. P. , McCormick M. P., Lenoble J., Brogniez C., and Pruvost P. (1989), SAGE‐II inversion algorithm, J. Geophys. Res., 94, 8339–8351, doi:10.1029/JD094iD06p08339. [Google Scholar]
- Chung, S. H. , and Seinfeld J. H. (2002), Global distribution and climate forcing of carbonaceous aerosols, J. Geophys. Res., 107(D19), 4407, doi:10.1029/2001JD001397. [Google Scholar]
- Clarke, A. D. , S. R., Owens , and Zhou J. C. (2006), An ultrafine sea‐salt flux from breaking waves: Implications for cloud condensation nuclei in the remote marine atmosphere, J. Geophys. Res., 111, D06202, doi:10.1029/2005JD006565. [Google Scholar]
- Colarco, P. R. , Toon O. B., Torres O., and Rasch P. J. (2002), Determining the UV imaginary index of refraction of Saharan dust particles from total ozone mapping spectrometer data using a three‐dimensional model of dust transport, J. Geophys. Res., 107(D16), 4289, doi:10.1029/2001JD000903. [Google Scholar]
- Collins, W. D. , et al. (2006), The formulation and atmospheric simulation of the community atmosphere model version 3 (CAM3), J. Clim., 19, 2144–2161. [Google Scholar]
- Croft, B. , Lohmann U., Martin R. V., Stier P., Wurzler S., Feichter J., Posselt R., and Ferrachat S. (2009), Aerosol size‐dependent below‐cloud scavenging by rain and snow in the ECHAM5‐HAM, Atmos. Chem. Phys., 9, 4653–4675, doi:10.5194/acp-9-4653-2009. [Google Scholar]
- Dana, M. T. (1971), Washout of soluble dye particles, in Pacific Northwest Laboratory Annual Report for 1970 to the USAEC Division of Biology and Medicine, Vol. II: Physical Sciences, Part I, Atmospheric Sciences, BNWL‐1551(11, I), pp. 63–67, Battelle, Pac. Northwest Lab., Richland, Wash. [Google Scholar]
- Dana, M. T. , and Hales J. M. (1976), Statistical aspects of the washout of polydisperse aerosols, Atmos. Environ., 10, 45–50. [Google Scholar]
- de Wolf, D. A. (2001), On the Laws‐Parsons distribution of raindrop sizes, Radio Sci., 36, 639–642. [Google Scholar]
- Després, V. R. , et al. (2012), Primary biological aerosol particles in the atmosphere: A review, Tellus, Ser. B, 64, 15598, 12–13, doi:10.3402/tellusb.v64i0.15598. [Google Scholar]
- Emmons, L. K. , et al. (2010), Description and evaluation of the model for ozone and related chemical tracers, version 4 (MOZART‐4), Geosci. Model Dev., 3, 43–67, doi:10.5194/gmd-3-43-2010. [Google Scholar]
- Engelmann, R. J. (1968), The calculation of precipitation scavenging, in Meteorology and Atomic Energy, edited by Slade D. H., U.S. Atomic Energy Commission (USAEC), Pacific Northwest Laboratory, Richland, Wash. [Google Scholar]
- English, J. M. , Toon O. B., Mills M. J., and Yu F. (2011), Microphysical simulations of new particle formation in the upper troposphere and lower stratosphere, Atmos. Chem. Phys., 11(17), 9303–9322, doi:10.5194/acp-11-9303-2011. [Google Scholar]
- Fan, T. , and Toon O. B. (2011), Modeling sea‐salt aerosol in a coupled climate and sectional microphysical model: Mass, optical depth and number concentration, Atmos. Chem. Phys., 11(9), 4587–4610, doi:10.5194/acp-11-4587-2011. [Google Scholar]
- Froyd, K. D. , Murphy D. M., Sanford T. J., Thomson D. S., Wilson J. C., Pfister L., and Lait L. (2009), Aerosol composition of the tropical upper troposphere, Atmos. Chem. Phys., 9(13), 4363–4385. [Google Scholar]
- Froyd, K. D. , Murphy D. M., Lawson P., Baumgardner D., and Herman R. L. (2010), Aerosols that form subvisible cirrus at the tropical tropopause, Atmos. Chem. Phys., 10(1), 209–218. [Google Scholar]
- Fuchs, N. A. (1964), The Mechanics of Aerosols, 408 pp., Dover, Mineola, N. Y. [Google Scholar]
- Fuchs, N. A. , and Sutugin A. G. (1971), Highly dispersed aerosols, in Topicsin Current Aerosol Research, vol. 2, edited by Hidy G. M. and Brock J. R., pp. 1–60, Pergamon, N. Y. [Google Scholar]
- Gantt, B. , Meskhidze N., and Kamykowski D. (2009), A new physically‐based quantification of marine isoprene and primary organic aerosol emissions, Atmos. Chem. Phys., 9, 4915–4927, doi:10.5194/acp-9-4915-2009. [Google Scholar]
- Gettelman, A. , Morrison H., and Ghan S. J. (2008), A new two‐moment bulk stratiform cloud microphysics scheme in the Community Atmospheric Model (CAM3), Part II: Single‐column and global results, J. Clim., 21(15), 3660–3679. [Google Scholar]
- Gettelman, A. , Liu X., Ghan S. J., Morrison H., Park S., Conley A. J., Klein S. A., Boyle J., Mitchell D. L., and Li J.‐L. F. (2010), Global simulations of ice nucleation and ice supersaturation with an improved cloud scheme in the Community Atmosphere Model, J. Geophys. Res., 115, D18216, doi:10.1029/2009JD013797. [Google Scholar]
- Ghan, S. J. , Chuang C. C., and Penner J. E. (1993), A parameterization of cloud droplet nucleation. Part I: Single aerosol type, Atmos. Res., 30, 198–221, doi:10.1016/0169-8095(93)90024-I. [Google Scholar]
- Ghan, S. J. , Chuang C. C., Easter R. C., and Penner J. E. (1995), A parameterization of cloud droplet nucleation. Part II: Multiple aerosol types, Atmos. Res., 36, 39–54, doi:10.1016/0169-8095(94)00005-X. [Google Scholar]
- Ghan, S. J. , Smith S. J., Wang M., Zhang K., Pringle K., Carslaw K., Pierce J., Bauer S., and Adams P. (2013), A simple model of global aerosol indirect effects, J. Geophys. Res. Atmos., 118, 6688–6707, doi:10.1002/jgrd.50567. [Google Scholar]
- Gillette, D. A. , and Passi R. (1988), Modeling dust emission caused by wind erosion, J. Geophys. Res., 93, 14,233–14,242, doi:10.1029/JD093iD11p14233. [Google Scholar]
- Ginoux, P. , Chin M., Tegen I., Prospero J. M., Holben B., Dubovik O., and Lin S.‐J. (2001), Sources and distributions of dust aerosols simulated with the GOCART model, J. Geophys. Res., 106, 20,255–20,273, doi:10.1029/2000JD000053. [Google Scholar]
- Gong, S. L. , Zhang X. Y., Zhao T. L., McKendry I. G., Jaffe D. A., and Lu N. M. (2003), Characterization of soil dust aerosol in China and its transport and distribution during 2001 ACE‐Asia: 2. Model simulation and validation, J. Geophys. Res., 108(D9), 4262, doi:10.1029/2002JD002633. [Google Scholar]
- Granier, C. , et al. (2005), POET, a database of surface emissions of ozone precursors. [Available at http://eccad.sedoo.fr/eccad_extract_interface/JSF/page_login.jsf.]
- Grini, A. , Myhre G., Zender C. S., Sundet J. K., and Isaksen I. S. A. (2005), Model simulations of dust sources and transport in the global tropo‐sphere: Effects of soil erodibility and wind speed variability, J. Geophys. Res., 110, D02205, doi:10.1029/2004JD005037. [Google Scholar]
- Guenther, A. , Karl T., Harley P., Wiedinmyer C., Palmer P. I., and Geron C. (2006), Estimates of global terrestrial isoprene emissions using MEGAN (Model of Emissions of Gases and Aerosols from Nature), Atmos. Chem. Phys., 6, 3181–3210. [Google Scholar]
- Hand, J. L. , et al. (2011), IMPROVE (Interagency Monitoring of Protected Visual Environments): Spatial and seasonal patterns and temporal variability of haze and its constituents in the United States, Rep. V, Coop. Inst. for Res. in the Atmos., Fort Collins, Colo.
- Heald, C. L. , and Spracklen D. V. (2009), Atmospheric budget of primary biological aerosol particles from fungal spores, Geophys. Res. Lett., 36, L09806, doi:10.1029/2009GL037493. [Google Scholar]
- Heald, C. L. , et al. (2011), Exploring the vertical profile of atmospheric organic aerosol: Comparing 17 aircraft field campaigns with a global model, Atmos. Chem. Phys., 11, 12,673–12,696, doi:10.5194/acp-11-12673-2011. [Google Scholar]
- Henze, D. K. , and Seinfeld J. H. (2006), Global secondary organic aerosol from isoprene oxidation, Geophys. Res. Lett., 33, L09812, doi:10.1029/2006GL02597610.1029/2006GL025976. [Google Scholar]
- Henzing, J. S. , Olivié D. J. L., and van Velthoven P. F. J. (2006), A parameterization of size resolved below cloud scavenging of aerosols by rain, Atmos. Chem. Phys., 6, 3363–3375, doi:10.5194/acp-6-3363-2006. [Google Scholar]
- Hess, M. , Koepke P., and Schultz I. (1998), Optical properties of aerosols and clouds: The software Package OPAC, Bull. Am. Meteorol. Soc., 79, 831–844. [Google Scholar]
- Hodzic, A. , and Jimenez J. L. (2011), Modeling anthropogenically controlled secondary organic aerosols in a megacity: A simplified framework for global and climate models, Geosci. Model Dev., 4(4), 901–917, doi:10.5194/gmd-4-901-2011. [Google Scholar]
- Hoose, C. , Kristjansson J. E., and Burrows S. M. (2010), How important is biological ice nucleation in clouds on a global scale?, Environ. Res. Lett., 5, 024009, 2, doi:10.1088/1748-9326/5/2/024009. [Google Scholar]
- Iacono, M. J. , Delamere J. S., Mlawer E. J., Shephard M. W., Clough S. A., and Collins W. D. (2008), Radiative forcing by long‐lived greenhouse gases: Calculations with the AER radiative transfer models, J. Geophys. Res., 113, D13103, doi:10.1029/2008JD009944. [Google Scholar]
- Jacobson, M. Z. (2001), Global direct radiative forcing due to multicomponent anthropogenic and natural aerosols, J. Geophys. Res., 106, 1551–1568, doi:10.1029/2000JD900514. [Google Scholar]
- Jacobson, M. Z. , and Streets D. G. (2009), Influence of future anthropogenic emissions on climate, natural emissions, and air quality, J. Geophys. Res., 114, D08118, doi:10.1029/2008JD011476. [Google Scholar]
- Jayne, J. T. , Leard D. C., Zhang X. F., Davidovits P., Smith K. A., Kolb C. E., and Worsnop D. R. (2000), Development of an aerosol mass spectrometer for size and composition analysis of submicron particles, Aerosol Sci. Technol., 33(1–2), 49–70, doi:10.1080/027868200410840. [Google Scholar]
- Jimenez, J. L. , et al. (2003), Ambient aerosol sampling with an aerosol mass spectrometer, J. Geophys. Res., 108(D7), 8425, doi:10.1029/2001JD001213. [Google Scholar]
- Jimenez, J. L. , et al. (2009), Evolution of organic aerosols in the atmosphere, Science, 326, 1525–1529, doi:10.1126/science.1180353. [DOI] [PubMed] [Google Scholar]
- Justus, C. , Hargraves W., Mikhail A., and Graber D. (1978), Methods for estimating wind speed frequency distributions, J. Appl. Meteorol., 17, 350–353, doi:10.1175/1520-0450(1978)017<0350:MFEWSF>2.0.CO;2. [Google Scholar]
- Kahn, R. , Banerjee P., McDonald D., and Diner D. (1998), Sensitivity of multiangle imaging to aerosol optical depth, and to pure‐particle size distribution and composition over ocean, J. Geophys. Res., 103, 32,195–32,213. [Google Scholar]
- Kanakidou, M. , et al. (2005), Organic aerosol and global climate modelling: A review, Atmos. Chem. Phys., 5, 1053–1123, doi:10.5194/acp-5-1053-2005. [Google Scholar]
- Kinne, S. , et al. (2006), An AeroCom initial assessment—Optical properties in aerosol component modules of global models, Atmos. Chem. Phys., 6, 1815–1834, doi:10.5194/acp-6-1815-2006. [Google Scholar]
- Kipling, et al. (2013), Constraints on aerosol processes in climate models from vertically‐resolved aircraft observations of black carbon, Atmos. Chem. Phys., 13, 5969–5986, doi:10.5194/acp-13-5969-2013. [Google Scholar]
- Kloster, S. , Feichter J., Maier‐Reimer E., Six K. D., Stier P., and Wetzel P. (2006), DMS cycle in the marine ocean‐atmosphere system—A global model study, Biogeosciences, 3, 29–51. [Google Scholar]
- Koch, D. (2001), Transport and direct radiative forcing of carbonaceous and sulfate aerosols in the GISS GCM, J. Geophys. Res., 106, 20,311–20,332, doi:10.1029/2001JD900038. [Google Scholar]
- Koch, D. , Schulz M., Kinne S., McNaughton C., et al. (2009), Evaluation of black carbon estimations in global aerosol models, Atmos. Chem. Phys., 9, 9001–9026, doi:10.5194/acp-9-9001-2009. [Google Scholar]
- Kokkola, H. , Hommel R., Kazil J., Niemeier U., Partanen A.‐I., Feichter J., and Timmreck C. (2009), Aerosol microphysics modules in the framework of the ECHAM5 climate model—Intercomparison under stratospheric conditions, Geosci. Model Dev., 2, 97–112, doi:10.5194/gmd-2-97-2009. [Google Scholar]
- Kroll, J. H. , et al. (2011), Carbon oxidation state as a metric for describing the chemistry of atmospheric organic aerosol, Nat. Chem., 3, 133–139, doi:10.1038/nchem.948. [DOI] [PubMed] [Google Scholar]
- Kulmala, M. , and Laaksonen A. (1990), Binary nucleation of water sulfuric‐acid system—Comparison of classical‐theories with different H2SO4 saturation vapor‐pressures, J. Chem. Phys., 93, 696–701. [Google Scholar]
- Lamarque, J.‐F. , et al. (2012), CAM‐chem: Description and evaluation of interactive atmospheric chemistry in the Community Earth System Model, Geosci. Model Dev., 5, 369–411, doi:10.5194/gmd-5-369-2012. [Google Scholar]
- Lawrence, D. M. , et al. (2011), Parameterization improvements and functional and structural advances in version 4 of the Community Land Model, J. Adv. Model. Earth Syst., 3, M03001, doi:10.1029/2011MS000045. [Google Scholar]
- Lewis, E. R. , and Schwartz S. E. (2004), Introduction, in Sea Salt Aerosol Production: Mechanisms, Methods, Measurements, and Models, AGU, Washington, D. C. [Google Scholar]
- Lin, J. S. , and Tabazadeh A. (2001), A parameterization of an aerosol physical chemistry model for the NH3/H2SO4/HNO3/H2O system at cold temperatures, J. Geophys. Res., 106, 4815–4829. [Google Scholar]
- Liu, X. , and Penner J. E. (2002), Effect of Mt. Pinatubo H2SO4/H2O aerosol on ice nucleation in the upper troposphere using a global chemistry and transport model (IMPACT), J. Geophys. Res., 107(D12), 4141, doi:10.1029/2001JD000455. [Google Scholar]
- Liu, X. , Penner J. E., and Herzog M. (2005), Global modeling of aerosol dynamics: Model description, evaluation, and interactions between sulfate and nonsulfate aerosols, J. Geophys. Res., 110, D18206, doi:10.1029/2004JD005674. [Google Scholar]
- Liu, X. , et al. (2012), Toward a minimal representation of aerosols in climate models: Description and evaluation in the Community Atmosphere Model CAM5, Geosci. Model Dev., 5, 709–739, doi:10.5194/gmd-5-709-2012. [Google Scholar]
- Lohmann, U. , Rotstayn L., Storelvmo T., Jones A., Menon S., Quaas J., Ekman A. M. L., Koch D., and Ruedy R. (2010), Total aerosol effect: Radiative forcing or radiative flux perturbation?, Atmos. Chem. Phys., 10, 3235–3246, doi:10.5194/acp-10-3235-2010. [Google Scholar]
- Mann, G. W. , et al. (2012), Intercomparison of modal and sectional aerosol microphysics representations within the same 3‐D global chemical transport model, Atmos. Chem. Phys., 12, 4449–4476, doi:10.5194/acp-12-4449-2012. [Google Scholar]
- Mann, G. W. , et al. (2014), Intercomparison and evaluation of global aerosol microphysical properties among AeroCom models of a range of complexity, Atmos. Chem. Phys., 14, 4679–4713, doi:10.5194/acp-14-4679-2014. [Google Scholar]
- Marticorena, B. , and Bergametti G. (1995), Modeling the atmospheric dust cycle: 1. Design of a soil‐derived dust emission scheme, J. Geophys. Res., 100, 16,415–16,430, doi:10.1029/95JD00690. [Google Scholar]
- Matichuk, R. I. , Colarco P. R., Smith J. A., and Toon O. B. (2007), Modeling the transport and optical properties of smoke aerosols from African savanna fires during the Southern African Regional Science Initiative campaign (SAFARI 2000), J. Geophys. Res., 112, D08203, doi:10.1029/2006JD007528. [Google Scholar]
- Matichuk, R. I. , Colarco P. R., Smith J. A., and Toon O. B. (2008), Modeling the transport and optical properties of smoke plumes from South American biomass burning, J. Geophys. Res., 113, D07208, doi:10.1029/2007JD009005. [Google Scholar]
- Mills, M. , Toon O., Turco R., Kinnison D., and Garcia R. (2008), Massive global ozone loss predicted following nuclear conflict, Proc. Natl. Acad. Sci. U. S. A., 105, 5307–5312, doi:10.1073/pnas.0710058105. [DOI] [PMC free article] [PubMed] [Google Scholar]
- Mills, M. J. (1996), Stratospheric sulfate aerosol: A microphysical model, PhD thesis, Univ. of Colo., Boulder, Colo.
- Montzka, S. A. , Calvert P., Hall B. D., Elkins J. W., Conway T. J., Tans P. P., and Sweeney C. (2007), On the global distribution, seasonality, and budget of atmospheric carbonyl sulfide (COS) and some similarities to CO2 , J. Geophys. Res., 112, D09302, doi:10.1029/2006JD007665. [Google Scholar]
- Morrison, H. , and Gettelman A. (2008), A new two‐moment bulk stratiform cloud microphysics scheme in the Community Atmospheric Model (CAM3), Part I: Description and numerical tests, J. Clim., 21(15), 3642–3659. [Google Scholar]
- Murphy, D. M. , and Koop T. (2005), Review of the vapour pressures of ice and supercooled water for atmospheric applications. Q. J. R. Meteorol. Soc., 131, 1539–1565, doi:10.1256/qj.04.94. [Google Scholar]
- Murphy, D. M. , Cziczo D. J., Froyd K. D., Hudson P. K., Matthew B. M., Middlebrook A. M., Peltier R. E., Sullivan A., Thomson D. S., and Weber R. J. (2006), Single‐particle mass spectrometry of tropospheric aerosol particles, J. Geophys. Res., 111, D23S32, doi:10.1029/2006JD007340. [Google Scholar]
- Murphy, D. M. , Cziczo D. J., Hudson P. K., and Thomson D. S. (2007), Carbonaceous material in aerosol particles in the lower stratosphere and tropopause region, J. Geophys. Res., 112, D04203, doi:10.1029/2006JD007297. [Google Scholar]
- Neely, R. R., III , English J. M., Toon O. B., Solomon S., Mills M., and Thayer J. P. (2011), Implications of extinction due to meteoritic smoke in the upper stratosphere, Geophys. Res. Lett., 38, L24808, doi:10.1029/2011GL049865. [Google Scholar]
- Neely, R. R., III , et al. (2013), Recent anthropogenic increases in SO2 from Asia have minimal impact on stratospheric aerosol, Geophys. Res. Lett., 40, 999–1004, doi:10.1002/grl.50263. [Google Scholar]
- Neely, R. R., III , Yu P., Rosenlof K. H., Toon O. B., Daniel J. S., Solomon S., and Miller H. L. (2014), The contribution of anthropogenic SO2 emissions to the Asian tropopause aerosol layer, J. Geophys. Res. Atmos., 119, 1571–1579, doi:10.1002/2013JD020578. [Google Scholar]
- O'Connor, D. J. , Healy D. A., Hellebust S., Buters J. T., and Sodeau J. R. (2014), Using the WIBS‐4 (waveband integrated bioaerosol sensor) technique for the on‐line detection of pollen grains, Aerosol Sci. Technol., 48, 341–349, doi:10.1080/02786826.2013.872768. [Google Scholar]
- O'Dowd, C. D. , and Smith M. H. (1993), Physicochemical properties of aerosols over the northeast Atlantic: Evidence for wind‐speed‐related submicron sea‐salt aerosol production, J. Geophys. Res., 98, 1137–1149, doi:10.1029/92JD02302. [Google Scholar]
- O'Dowd, C. D. , Langmann B., Varghese S., Scannell C., Ceburnis D., and Facchini M. C. (2008), A combined organic‐inorganic sea‐spray source function, Geophys. Res. Lett., 35, L01801, doi:10.1029/2007GL030331. [Google Scholar]
- O'Reilly, J. E. , Maritorena S., Mitchell B. G., Siegel D. A., Carder K. L., Garver S. A., Kahru M., and McClain C. (1998), Ocean color chlorophyll algorithms for SeaWiFS, J. Geophys. Res., 103, 24,937–24,953, doi:10.1029/98JC02160. [Google Scholar]
- Odum, J. R. , Hoffmann T., Bowman F., Collins D., Flagan R. C., and Seinfeld J. H. (1996), Gas/particle partitioning and secondary organic aerosol yields, Environ. Sci. Technol., 30, 2580–2585, doi:10.1021/es950943+. [Google Scholar]
- Pankow, J. F. (1994), An absorption model of gas‐particle partitioning of organic compounds in the atmosphere, Atmos. Environ., 28(2), 185–188, doi:10.1016/1352-2310(94)90093-0. [Google Scholar]
- Pappas, V. , Hatzianastassiou N., Papadimas C., Matsoukas C., Kinne S., and Vardavas I. (2013), Evaluation of spatio‐temporal variability of Hamburg Aerosol Climatology against aerosol datasets from MODIS and CALIOP, Atmos. Chem. Phys., 13, 8381–8399, doi:10.5194/acp-13-8381-2013. [Google Scholar]
- Petters, M. D. , and Kreidenweis S. M. (2007), A single parameter representation of hygroscopic growth and cloud condensation nucleus activity, Atmos. Chem. Phys., 7, 1961–1971, doi:10.5194/acp-7-1961-2007. [Google Scholar]
- Prospero, J. M. , and Bonatti E. (1969), Continental dust in the atmosphere of the Eastern Equatorial Pacific, J. Geophys. Res., 74, 3362–3371, doi:10.1029/JC074i013p03362. [Google Scholar]
- Prospero, J. M. , Uematsu M., and Savoie D. L. (1989), Mineral aerosol transport to the Pacific Ocean, in Chemical Oceanography, vol. 10, edited by Riley J. P., pp. 187–218, Academic, N. Y. [Google Scholar]
- Pye, H. O. T. , Chan A. W. H., Barkley M. P., and Seinfeld J. H. (2010), Global modeling of organic aerosol: The importance of reactive nitrogen (NOx and NO3), Atmos. Chem. Phys., 10, 11,261–11,276, doi:10.5194/acp-10-11261-2010. [Google Scholar]
- Ramanathan, V. , and Carmichael G. (2008), Global and regional climate changes due to black carbon, Nat. Geosci., 1(4), 221–227, doi:10.1038/ngeo156. [Google Scholar]
- Rap, A. , Scott C. E., Spracklen D. V., Bellouin N., Forster P. M., Carslaw K. S., Schmidt A., and Mann G. (2013), Natural aerosol direct and indirect radiative effects, Geophys. Res. Lett., 40, 3297–3301, doi:10.1002/grl.50441. [Google Scholar]
- Rasch, P. J. , Barth M. C., Kiehl J. T., Schwartz S. E., and Benkovitz C. M. (2000), A description of the global sulfur cycle and its controlling processes in the National Center for Atmospheric Research Community Climate Model, Version 3, J. Geophys. Res., 105, 1367–1385, doi:10.1029/1999JD900777. [Google Scholar]
- Reid, J. S. , Hobbs P. V., Ferek R. J., Blake D. R., Martins J. V., Dunlap M. R., and Liousse C. (1998), Physical, chemical, and optical properties of regional hazes dominated by smoke in Brazil, J. Geophys. Res., 103, 32,059–32,080, doi:10.1029/98JD00458. [Google Scholar]
- Remer, L. A. , et al. (2008), Global aerosol climatology from the MODIS satellite sensors, J. Geophys. Res., 113, D14S07, doi:10.1029/2007JD009661. [Google Scholar]
- Reponen, T. (1995), Aerodynamic diameters and respiratory deposition estimates of viable fungal particles in mold problem dwellings, Aerosol Sci. Technol., 22, 11–23. [Google Scholar]
- Rienecker, M. M. , et al. (2011), Merra: NASA's modern‐era retrospective analysis for research and applications, J. Clim., 24, 3624–3648, doi:10.1175/JCLI-D-11-00015.1. [DOI] [PMC free article] [PubMed] [Google Scholar]
- Ross, M. , Mills M., and Toohey D. (2010), Potential climate impact of black carbon emitted by rockets, Geophys. Res. Lett., 37, L24810, doi:10.1029/2010GL044548. [Google Scholar]
- Sabban, L. , and van Hout R. (2011), Measurements of pollen grain dispersal in still air and stationary, near homogeneous, isotropic turbulence, J. Aerosol Sci., 42(12), 867–882, doi:10.1016/j.jaerosci.2011.08.001. [Google Scholar]
- Sabinina, A. L. , and Terpugow L. (1935), Die oberflachenspannung de systems schwefelsaure‐wasser, Z. Phys. Chem. A, 173, 237–241. [Google Scholar]
- Savoie, D. L. , and Prospero J. M. (1977), Aerosol concentration statistics for Northern Tropical Atlantic, J. Geophys. Res., 82, 5954–5964. [Google Scholar]
- Schwarz, J. P. , et al. (2008), Measurement of the mixing state, mass, and optical size of individual black carbon particles in urban and biomass burning emissions, Geophys. Res. Lett., 35, L13810, doi:10.1029/2008GL033968. [Google Scholar]
- Schwarz, J. P. , Spackman J. R., Gao R. S., Watts L. A., Stier P., Schulz M., Davis S. M., Wofsy S. C., and Fahey D. W. (2010), Global‐scale black carbon profiles observed in the remote atmosphere and compared to models, Geophys. Res. Lett., 37, L18812, doi:10.1029/2010GL044372. [Google Scholar]
- Schwarz, J. P. , Samset B. H., Perring A. E., Spackman J. R., Gao R. S., Stier P., Schulz M., Moore F. L., Ray E. A., and Fahey D. W. (2013), Global‐scale seasonally resolved black carbon vertical profiles over the Pacific, Geophys. Res. Lett., 40, 5542–5547, doi:10.1002/2013GL057775. [DOI] [PMC free article] [PubMed] [Google Scholar]
- Seinfeld, J. H. , and Pandis S. N. (1998), Atmospheric Chemistry and Physics: From Air Pollution to Climate Change, 1st ed., John Wiley, N. Y. [Google Scholar]
- Sesartic, A. , and Dallafior T. N. (2011), Global fungal spore emissions, review and synthesis of literature data, Biogeosciences, 8, 1181–1192, doi:10.5194/bg-8-1181-2011. [Google Scholar]
- Shindell, D. T. , et al. (2013), Radiative forcing in the ACCMIP historical and future climate simulations, Atmos. Chem. Phys., 13, 2939–2974, doi:10.5194/acp-13-2939-2013. [Google Scholar]
- Smirnov, A. , et al. (2011), Maritime aerosol network as a component of AERONET—First results and comparison with global aerosol models and satellite retrievals, Atmos. Meas. Tech., 4, 583–597, doi:10.5194/amt-4-583-2011. [Google Scholar]
- Spracklen, D. V. , Pringle K. J., Carslaw K. S., Chipperfield M. P., and Mann G. W. (2005), A global off‐line model of size‐resolved aerosol microphysics: I. Model development and prediction of aerosol properties, Atmos. Chem. Phys., 5, 2227–2252, doi:10.5194/acp-5-2227-2005. [Google Scholar]
- Stier, P. , et al. (2005), The aerosol‐climate model ECHAM5‐HAM, Atmos. Chem. Phys., 5, 1125–1156, doi:10.5194/acp-5-1125-2005. [Google Scholar]
- Stocker, T. F. , et al. (2013), Technical summary, in Climate Change 2013: The Physical Science Basis. Contribution of Working Group I to the Fifth Assessment Report of the Intergovernmental Panel on Climate Change, edited by Stocker T. F. et al., pp. 33–115, Cambridge Univ. Press, Cambridge, U. K., doi:10.1017/CBO9781107415324.005. [Google Scholar]
- Su, L. , and Toon O. B. (2009), Numerical simulations of Asian dust storms using a coupled climate‐aerosol microphysical model, J. Geophys. Res., 114, D14202, doi:10.1029/2008JD010956. [Google Scholar]
- Su, L. , and Toon O. B. (2011), Saharan and Asian dust: Similarities and differences determined by CALIPSO, AERONET, and a coupled climate‐aerosol microphysical model, Atmos. Chem. Phys., 11(7), 3263–3280, doi:10.5194/acp-11-3263-2011. [Google Scholar]
- Sutherland, W. (1893), The viscosity of gases and molecular force, Philos. Mag., 36, 507–531. [Google Scholar]
- Tabazadeh, A. , Toon O. B., Clegg S. L., and Hamill P. (1997), A new parameterization of H2SO4/H2O aerosol composition: Atmospheric implications, Geophys. Res. Lett., 24, 1931–1934. [Google Scholar]
- Tegen, I. , and Fung I. (1994), Modeling of mineral dust in the atmosphere: Sources, transport, and optical thickness, J. Geophys. Res., 99, 22,897–22,914, doi:10.1029/94JD01928. [Google Scholar]
- Toon, O. B. , and Ackerman T. P. (1981), Algorithms for the calculation of scattering by stratified spheres, Appl. Opt., 20, 3657–3660. [DOI] [PubMed] [Google Scholar]
- Toon, O. B. , Turco R. P., Westphal D., Malone R., and Liu M. S. (1988), A multidimensional model for aerosols—Description of computational analogs, J. Atmos. Sci., 45(15), 2123–2144, doi:10.1175/1520-0469(1988). [Google Scholar]
- Toon, O. B. , Turco R. P., Jordan J., Goodman J., and Ferry G. (1989), Physical processes in polar stratospheric ice clouds, J. Geophys. Res., 94, 11,359–11,380, doi:10.1029/JD094iD09p11359. [Google Scholar]
- van der Werf, G. R. , Randerson J. T., Giglio L., Collatz G. J., Kasibhatla P. S., and Arellano A. F. (2006), Interannual variability in global biomass burning emissions from 1997 to 2004, Atmos. Chem. Phys., 6, 3423–3441. [Google Scholar]
- van der Werf, G. R. , et al. (2010), Global fire emissions and the contribution of deforestation, savanna, forest, agricultural, and peat fires (1997–2009), Atmos. Chem. Phys., 10, 11,707–11,735, doi:10.5194/acp-10-11707-2010. [Google Scholar]
- Wang, M. , Penner J. E., and Liu X. (2009), Coupled IMPACT aerosol and NCAR CAM3 model: Evaluation of predicted aerosol number and size distribution, J. Geophys. Res., 114, D06302, doi:10.1029/2008JD010459. [Google Scholar]
- Wang, M. , et al. (2011), The multi‐scale aerosol‐climate model PNNL‐MMF: Model description and evaluation, Geosci. Model Dev., 4, 137–168, doi:10.5194/gmd-4-137-2011. [Google Scholar]
- Wang, H. , Easter R. C., Rasch P. J., Wang M., Liu X., et al. (2013), Sensitivity of remote aerosol distributions to representation of cloud–aerosol interactions in a global climate model, Geosci. Model Dev., 6, 765–782, doi:10.5194/gmd-6-765-2013. [Google Scholar]
- Weisenstein, D. K. , Penner J. E., Herzog M., and Liu X. (2007), Global 2‐D intercomparison of sectional and modal aerosol modules, Atmos. Chem. Phys., 7(9), 2339–2355. [Google Scholar]
- Westphal, D. L. , and Toon O. B. (1991), Simulations of microphysical, radiative, and dynamical processes in a continental‐scale forest fire smoke plume, J. Geophys. Res., 96, 22,379–22,400, doi:10.1029/91JD01956. [Google Scholar]
- Yu, F. (2011), A secondary organic aerosol formation model considering successive oxidation aging and kinetic condensation of organic compounds: Global scale implications, Atmos. Chem. Phys., 11, 1083–1099, doi:10.5194/acp-11-1083-2011. [Google Scholar]
- Yu, F. , and G. Luo (2009), Simulation of particle size distribution with a global aerosol model: Contribution of nucleation to aerosol and CCN number concentrations, Atmos. Chem. Phys., 9, 7691–7710, doi:10.5194/acp-9-7691-2009. [Google Scholar]
- Yu, P. , Toon O. B., Neely R. R., Martinsson B. G., and Brenninkmeijer C. A. M. (2015), Composition and physical properties of the Asian Tropopause Aerosol Layer and the North American Tropospheric Aerosol Layer, Geophys. Res. Lett., 42, 2540–2546, doi:10.1002/2015GL063181. [DOI] [PMC free article] [PubMed] [Google Scholar]
- Zhang, L. , Gong, J. Padro , and L., Barrie (2001), A size‐segregated particle dry deposition scheme for an atmospheric aerosol module, Atmos. Environ., 35, 549–560, doi:10.1016/S1352-2310(00)00326-5. [Google Scholar]
- Zhang, Q. , Worsnop D. R., Canagaratna M. R., and Jimenez J. L. (2006), Hydrocarbon‐like and oxygenated organic aerosols in Pittsburgh: Insights into sources and processes of organic aerosols, Atmos. Chem. Phys., 5, 3289–3311, doi:10.5194/acp-5-3289-2005. [Google Scholar]
- Zhang, Q. , et al. (2007), Ubiquity and dominance of oxygenated species in organic aerosols in anthropogenically‐influenced Northern Hemisphere midlatitudes, Geophys. Res. Lett., 34, L13801, doi:10.1029/2007GL029979. [Google Scholar]
- Zhang, X. Y. , Wang Y. Q., Zhang X. C., Guo W., and Gong S. L. (2009), Carbonaceous aerosol composition over various regions of China during 2006, J. Geophys. Res., 113, D14111, doi:10.1029/2007JD009525. [Google Scholar]
- Zhao, J. , and Turco R. P. (1995), Nucleation simulations in the wake of a jet aircraft in stratospheric flight, J. Aerosol Sci., 26, 779–795. [Google Scholar]


