Abstract
Treatment outcomes for acute myeloid leukemia and myelodysplastic syndromes (MDS) remain unsatisfactory despite progress in various types of chemotherapy and hematopoietic stem cell transplantation. Therefore, there is a need for the development of new treatment options. We investigated the growth‐suppressive effects of withaferin A (WA), a natural plant steroidal lactone, on myelodysplasia and leukemia cell lines. WA exhibited growth‐suppressive effects on the cell lines, MDS‐L, HL‐60, THP‐1, Jurkat and Ramos, and induction of cell cycle arrest at G2/M phase at relatively low doses. Evaluation by annexin V/PI also confirmed the induction of partial apoptosis. Gene expression profiling and subsequent gene set enrichment analysis revealed increased expression of heme oxygenase‐1 (HMOX1). HMOX1 is known to induce autophagy during anticancer chemotherapy and is considered to be involved in the treatment resistance. Our study indicated increased HMOX1 protein levels and simultaneous increases in the autophagy‐related protein LC3A/B in MDS‐L cells treated with WA, suggesting increased autophagy. Combined use of WA with chloroquine, an autophagy inhibitor, enhanced early apoptosis and growth suppression. Together with the knowledge that WA had no apparent suppressive effect on the growth of human normal bone marrow CD34‐positive cells in the short‐term culture, this drug may have a potential for a novel therapeutic approach to the treatment of leukemia or MDS.
Keywords: Acute myeloid leukemia, gene set enrichment analysis, heme oxygenase‐1, myelodysplastic syndromes, withaferin A
Despite recent progress in various types of chemotherapy and in the wide indication of hematopoietic stem cell transplantation, treatment outcomes for acute myeloid leukemia (AML) and myelodysplastic syndromes (MDS) remain unsatisfactory from the perspective of achieving disease‐free status or complete cure.1, 2 There is, therefore, a need for the development of a new therapeutic strategy.
Withaferin A (WA), one of the steroidal lactones, is a bioactive constituent of the Indian herb Withania somnifera (commonly known as Ashwagandha or Indian winter cherry), a wild plant that is widely distributed across the South Asian field,3, 4 and is a traditional medicine for various diseases, such as inflammatory diseases, autoimmune diseases and malignant tumors.5
The anticancer activity of WA was reported for the first time in 19676 and several investigations have since been performed to determine its potential as an anticancer agent. Previous reports have demonstrated that WA affects microtubules or vimentin intermediate filaments and, subsequently, exerts cytotoxicity or inhibition of the epithelial–mesenchymal transition.7, 8, 9, 10 WA is reported to induce cell cycle arrest at G2/M phase, resulting in apoptosis.8, 11, 12, 13, 14, 15 Nonetheless, the detailed mechanisms of action remain to be determined and may be different depending on the cells, tissues or experimental systems.
In the present study, we investigated the growth‐suppressive effect of WA on human myeloid and lymphoid cell lines. We found that WA exhibits growth‐suppressive effects on these cell lines and induces cell cycle arrest at G2/M phase at relatively low doses. We also found the upregulation of heme oxygenase‐1 (HMOX1) and enhanced autophagy. WA has a unique growth‐suppressive effect on leukemic cells and may serve as a novel therapeutic approach to the treatment of hematological malignancies.
Materials and Methods
Reagents
Withaferin A was purchased from ChromaDex (Irvine, CA, USA). It was dissolved in dimethylsulfoxide and stored at −20°C. Chloroquine (CQ) was obtained from Cell Signaling Technology (Danvers, MA, USA). It was dissolved in distilled water and stored at 4°C.
Cell lines and primary cells
A myelodysplastic cell line, MDS92, was established from the bone marrow of a patient with MDS.16 This cell line proliferated in the presence of interleukin‐3 (IL‐3) with a tendency to gradual maturation. Therefore, we isolated the CD34‐positive fraction from MDS92 cells by the magnetic beads method with anti‐CD34 monoclonal antibody for a comparative study with the other cell lines. MDS‐L cell line, a blastic subline originated from MDS92, was mainly used in this study.17, 18, 19, 20, 21 Both MDS92 and MDS‐L cells were maintained in RPMI1640 medium supplemented with 10% FBS, 50 μM 2‐mercaptoethanol, 2.0 mM l‐glutamine and 100 U/ml IL‐3. HL‐60 and THP‐1 (both human myeloid leukemia cell lines), Jurkat (a T‐acute lymphoblastic leukemia cell line) and Ramos (a Burkitt lymphoma cell line) were also used in this study.
Five human normal bone marrow CD34‐positive progenitor cells were purchased from LONZA Group (Basel, Switzerland) and cultured with a serum‐free medium with recombinant cytokines for myelopoiesis of hematopoietic progenitor cells, STEM ALPHA, AG (STEM ALPHA SA, Saint Genis L'Argentière, France). Primary leukemic cells were obtained from a patient with AML at Kawasaki Medical School Hospital after informed consent. The usage of patient samples was approved by the Ethical Committee of Kawasaki Medical School. The mononuclear cell fraction was isolated from the bone marrow sample using the Ficoll–Hypaque density centrifugation method.
Cell growth assay and MTT assay
The morphological assessment was performed with May–Gruenwald–Giemsa stained cytospin slides. Cell growth was assessed by counting the number of living cells after trypan blue dye staining. Cell suspensions were plated into 96‐well plates in the presence of the drug or solvent alone, incubated as above at 37°C for 1–3 days, and analyzed using the MTT assay.
Cell cycle analysis
Cells were fixed with 70% methanol for 30 min and treated with 2 mg/mL ribonuclease A (Nacalai Tesque, Kyoto, Japan) for 30 min at 37°C, then with 50 μg/mL propidium iodide (PI; Sigma, St Louis, MO, USA) for a further 20 min at room temperature. Samples were analyzed with BD FACS Aria III and Diva software (Becton Dickinson, Franklin Lakes, NJ, USA).
Apoptosis assay
Apoptosis was examined using the AnnexinV Apoptosis Detection Kit (BD Pharmingen, San Diego, CA, USA) and all samples were analyzed with BD FACS Aria III and Diva software (Becton Dickinson).
Autophagy assay
Autophagy assay was performed using the CYTO‐ID Autophagy Detection Kit (Enzo Life Sciences, Farmingdale, NY, USA). The cells were stained by the dedicated reagent covered from light for 30 min at 37°C and analyzed with BD FACS Aria III with Diva software (Becton Dickinson).
Immunoblotting analysis
Cell lysates were prepared in Laemmli Sample Buffer (BIO‐RAD, Hercules, CA, USA) containing 2‐mercaptoethanol and heated for 5 min at 95°C. Cell lysates were separated in sodium dodecyl sulfate‐polyacrylamide gel electrophoresis (SDS‐PAGE) and transferred to a polyvinylidene difluoride membrane (Millipore, Bedford, MA, USA). The membrane was blocked with 5% skim milk in T‐PBS for 60 min at room temperature. Then the membrane was incubated with the appropriate antibodies overnight. The membrane was washed three times with T‐PBS and incubated with HRP‐conjugated goat anti‐rabbit antibodies for 30 min, and specific proteins were detected using an enhanced chemiluminescence detection system.
Primary antibodies were obtained from Cell Signaling Technology Tokyo, Japan (HMOX1[HO‐1], C‐PARP, LC3A/B, β‐actin). HRP‐conjugated rabbit secondary antibody was purchased from GE Healthcare Life Sciences (Piscataway, NJ, USA)
Gene expression profiling and gene set enrichment analysis
Gene expression profiling of MDS‐L cells were analyzed in three independent experiments. Treated cells were harvested after 12 h treatment with 1 μM of WA. Total RNA was extracted with an RNeasy Mini Kit (Qiagen, Germantown, MD, USA), converted to cDNA and amplified with a GeneChip WT Terminal Labeling and Controls Kit (Affymetrix, Santa Clara, CA, USA). The fragmentation, the labeling and the hybridization of cDNA were treated with a GeneChip Hybridization, Wash, and Stain Kit (Affymetrix). Chips were scanned with a GeneChip Scanner 3000 7G System (Affymetrix).
The gene set enrichment analysis (GSEA Broad Institute, Cambridge, MA, USA) was performed using the gene expression profiling data and the GSEA software. Detailed information regarding these experiments can be found in Subramanian et al. and from the GSEA website (http://www.broadinstitute.org/gsea/index.jsp).22
Immunofluorescence staining
Cells were centrifuged onto cytospin slides and fixed for 15 min in 100% methanol at −20°C, then blocked with blocking buffer including 5% FBS and 0.3% Triton X‐100 in PBS (pH 8.0) for 60 min. Immunofluorescence staining was performed using rabbit monoclonal anti‐LC3A/B to detect autophagosomes, and AlexaFluor488‐conjugated anti‐IgG antibodies (Molecular Probes, Eugene, OR, USA) as secondary antibodies. The nucleus was stained with DAPI (Dojindo, Kumamoto, Japan). Cells were observed under an Olympus BX51 fluorescence microscope (Tokyo, Japan).
Statistical analyses
Most data were expressed as mean ± SD. Comparisons between the groups were done using one‐way ANOVA. Differences were considered statistically significant if P‐values were <0.05. Data analysis was performed using the Prism software (GraphPad, La Jolla, CA, USA).
Results
Withaferin A inhibits the proliferation of myelodysplasia and leukemia cell lines
To investigate the growth‐suppressive effects of WA, we treated MDS‐L, HL‐60, THP‐1, Jurkat and Ramos cell lines with WA, and assessed their proliferation at 24, 48 and 72 h by MTT assay. As shown in Figure 1, WA exhibited a concentration‐dependent growth‐suppressive effect on all cell lines, with the half‐maximal inhibitory concentration (IC50) values of 171 ± 13 nM at 24 h, 90 ± 18 nM at 48 h, and 105 ± 19 nM at 72 h in MDS‐L cells. The IC50 values for the other cell lines are presented in Figure 1b. Cell counting by trypan blue dye exclusion assay displayed the same trends (data not shown).
Figure 1.
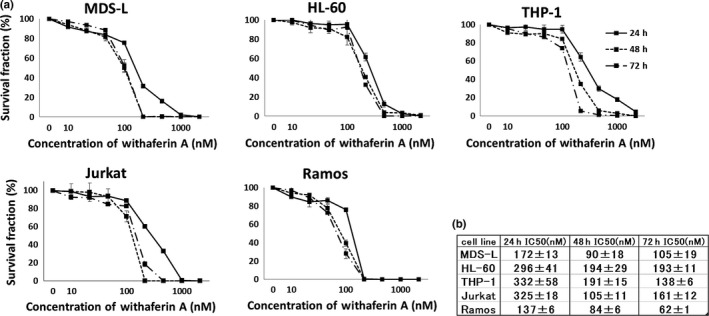
Withaferin A (WA) suppresses the growth of myelodysplasia and leukemia cell lines. (a) MDS‐L, HL‐60, THP‐1, Jurkat and Ramos cells were treated with the indicated concentrations of WA (0–5000 nM) for indicated times, and cell count was assessed by MTT assay. The data represent the mean values with SD from five independent experiments. (b) The IC50 values of WA for each cell line are shown.
Withaferin A induces cell cycle arrest at G2/M phase
The cell lines were treated with WA, and evaluation of cell morphology by May–Gruenwald–Giemsa staining demonstrated an increased number of mitotic cells (Fig. 2a). The cell cycle analysis by PI staining of the cells after WA treatment revealed an increased proportion of the cells at G2/M phase in a dose‐dependent manner (Fig. 2b,c) and confirmed the induction of G2/M arrest in the five cell lines.
Figure 2.
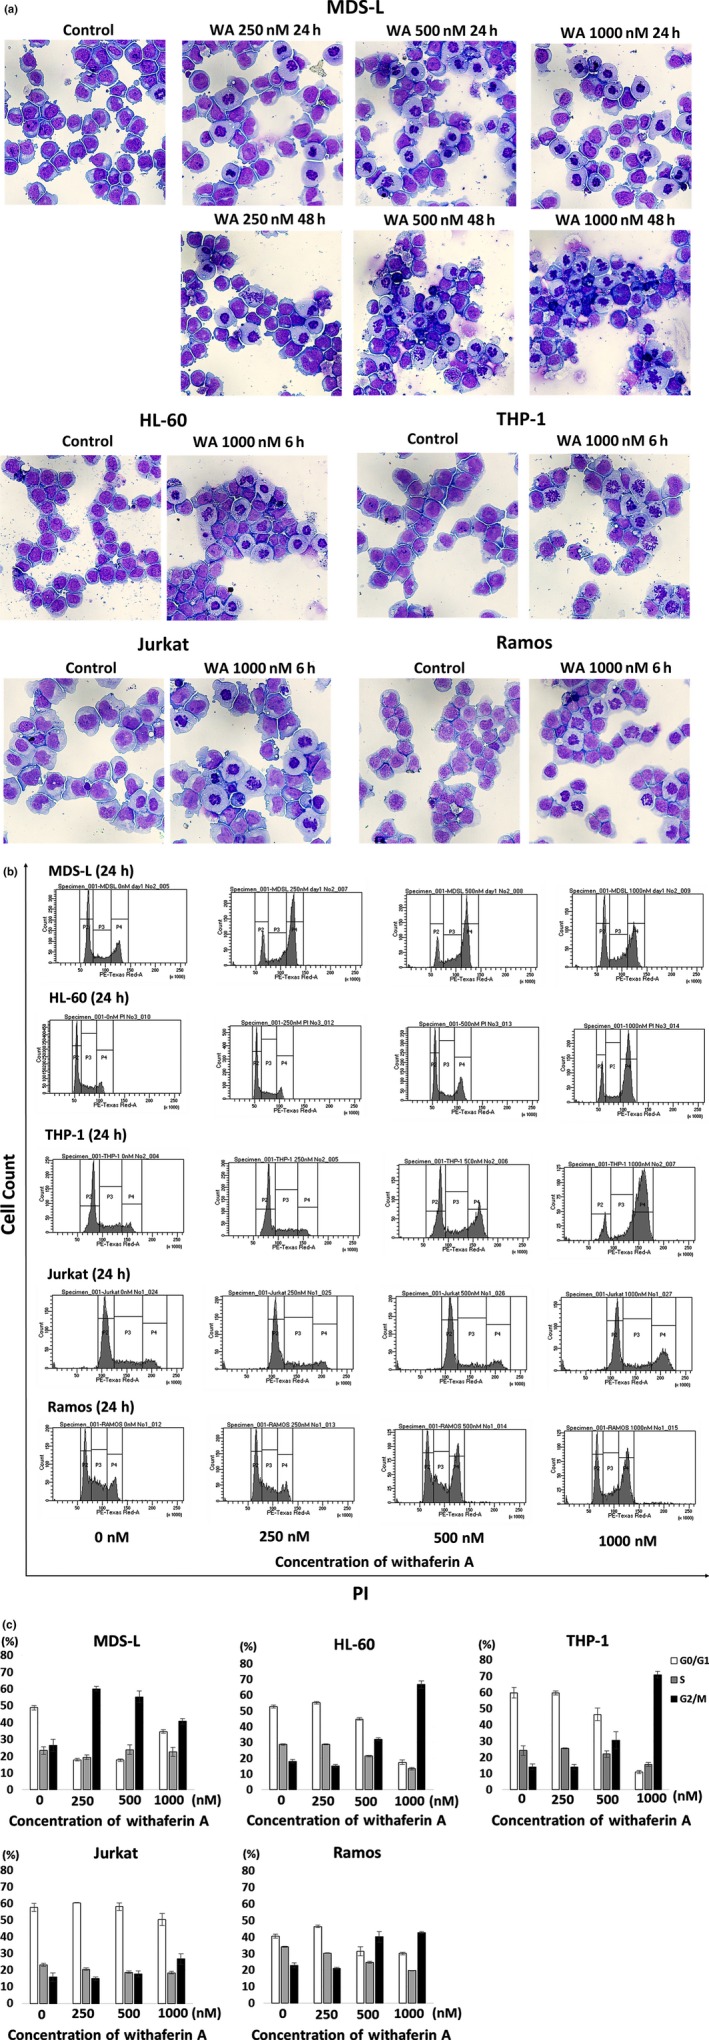
Effects of withaferin A (WA) on the morphology and cell cycle of myelodysplasia and leukemia cell lines. (a) MDS‐L cells were cultured without treatment (control) or treated with 250, 500 and 1000 nM WA for 24 and 48 h. HL60, THP‐1, Jurkat and Ramos cells were cultured without treatment (control) or treated with 1000 nM WA for 6 h. Cytospin preparations were stained by May‐Gruenwald‐Giemsa (original magnification x400). Representative images by each treatment are shown. (b) The cell cycle analyses by propidium iodide (PI) staining are shown. MDS‐L, HL‐60, THP‐1, Jurkat and Ramos cells were treated with indicated concentrations of WA for 24 h, and the cells were stained with PI and analyzed by flow cytometry. Representative histogram patterns by each treatment are shown. (c) The cell fractions at G1, S and G2⁄M phase are presented by white, gray and black bars, respectively. The data represent the mean values with SD from three independent experiments.
Withaferin A partially induces apoptosis
As WA ultimately led the cell lines to cell death after inducing G2/M arrest, we investigated whether WA induces apoptosis. Annexin V/PI dual staining confirmed the presence of apoptotic cells (Fig. 3a). Immunoblotting analysis also revealed that WA treatment resulted in increased expression of the apoptosis‐related protein, C‐PARP, confirming that WA induces apoptosis (Fig. 3b).
Figure 3.
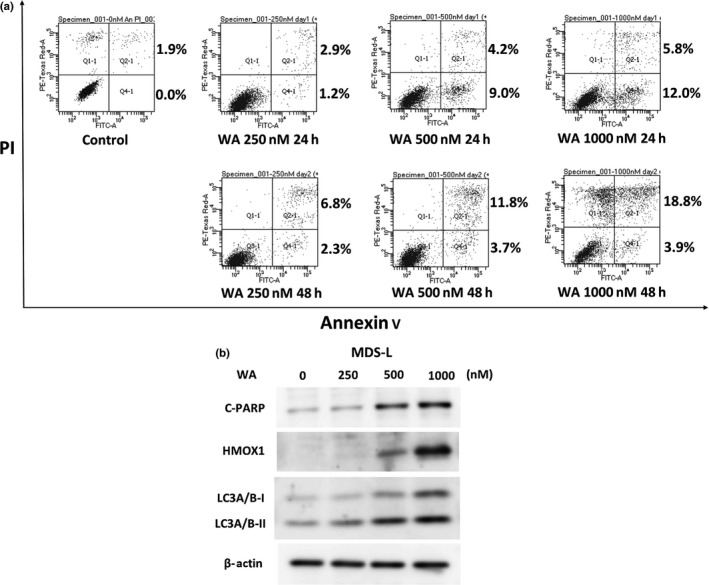
Withaferin A (WA) induces apoptosis partially in MDS‐L cells. (a) MDS‐L cells were treated with different concentrations of WA (0, 250, 500 and 1000 nM) for 24 and 48 h. Appearance of apoptotic cells was assessed by flow cytometry using annexin V/propiodium iodide (PI) staining. The single‐positive fraction for annexin V implies early apoptosis, and the double‐positive fraction for annexin V/PI implies late apoptosis. The values of the lower right area and the upper right area indicate the percentage of the cells in early apoptosis and late apoptosis, respectively. (b) MDS‐L cells were treated with indicated concentrations of WA for 24 h, and the protein lysates were analyzed by immunoblotting analysis for the detection of cleaved PARP (C‐PARP), heme oxygenase‐1 (HMOX1), LC3A/B‐I and LC3A/B‐II, with each antibody described in the Materials and Methods. The amount of beta‐actin is shown as a loading control.
Gene enrichment analysis revealed upregulation of the heme oxygenase‐1 (HMOX‐1) gene after treatment with WA
Previous reports in the literature suggested that the effects of WA on cultured cells are multifaceted. Hence, we investigated the effects of WA on gene expression in MDS‐L cells by microarray gene expression profiling and assessed the data by GSEA. As shown in Figure 4a, WA treatment resulted in significantly increased expression of the transcription factor gene set, V$USF_Q6_01 (FDR q‐value 0.036; FWER P‐value 0.00). The expression of HMOX1 was most significantly increased among the genes in the set (Fig. 4b). WA‐induced HMOX1 upregulation was also confirmed by immunoblotting analyses (Figs 3b,5a).
Figure 4.
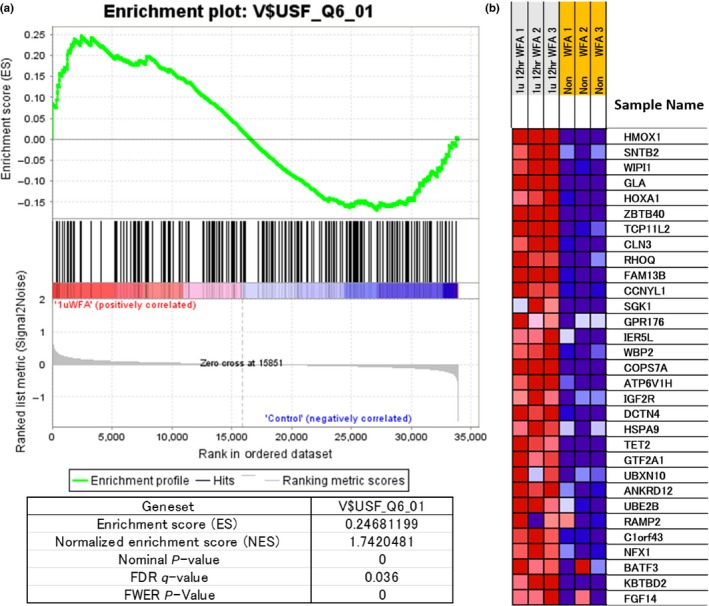
Expression of the gene set “V$USF_Q6_01” in withaferin A (WA)‐treated MDS‐L cells by the gene enrichment analysis (GSEA). (a) WA (1000 nM)‐treated (WFA) or untreated MDS‐L cells were harvested at 12 h. Gene expression profiling of MDS‐L cells was examined in triplicate experiments and obtained data were used for GSEA by handling the GSEA software and the Molecular Signatures Database according to the references.22 The gene set “V$USF_Q6_01” was strongly upregulated by WA treatment and several statistical values are also presented. (b) The heat map presentation of the top 31 activated genes out of 218 genes included in the gene set is shown in the triplicate experiments (WFA, WA‐treated; non‐WFA, untreated). In (b), this gene set contains HMOX1 as the most activated gene and further indicates the upregulation of an autophagy‐related molecule WIPI1 by WA treatment.
Figure 5.
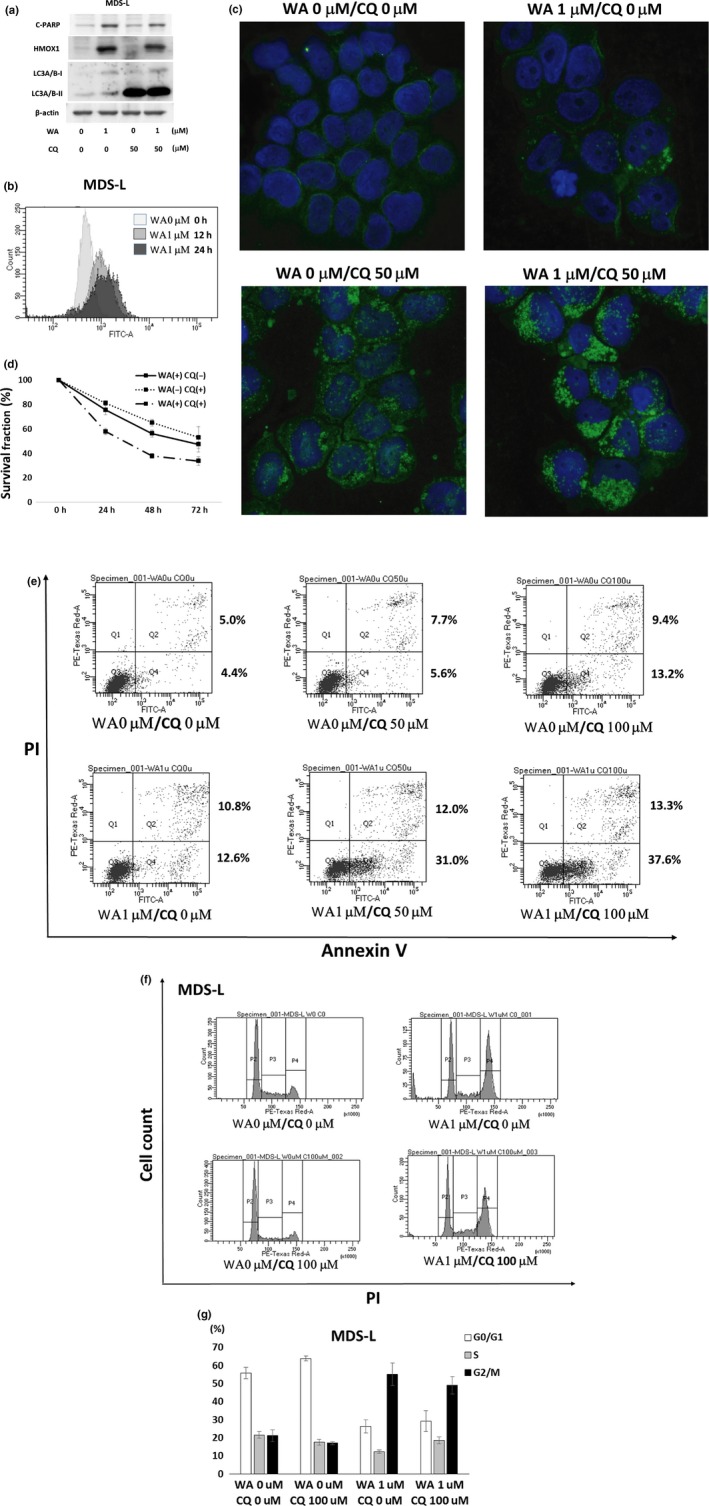
Cooperative effects of chloroquine (CQ) on withaferin A (WA)‐treated MDS‐L cells. (a) MDS‐L cells were treated with indicated concentrations of WA and CQ for 24 h, respectively. The protein lysates were analyzed by immunoblotting analysis for the detection of cleaved PARP (C‐PARP), heme oxygenase‐1 (HMOX1), LC3A/B‐I and LC3A/B‐II, with each antibody described in the Materials and methods. The amount of beta‐actin was shown as a loading control. (b) MDS‐L cells were treated with 1 μM WA for 12 or 24 h, and the degree of autophagy was evaluated by CYTO‐ID Autophagy Detection Kit and flow cytometry. (c) MDS‐L cells were treated with indicated concentrations of WA and CQ for 24 h, and harvested for cytospin preparations. The cells were immunostained by anti‐LC3A/B antibody followed by Alexa Fluor488 (green)‐conjugated secondary antibody and DAPI (blue) (original magnification ×1000). Representative images by each treatment are shown. (d) MDS‐L cells were treated with the combined doses of WA (0 and 100 nM) and CQ (0 and 25 μM) for indicated times, and cell count was assessed by MTT assay. The cell counts with no treatment were adjusted as 100% at each time point, and the data represent the mean values with SD from five independent experiments. (e) MDS‐L cells were treated with the combined doses of WA (0 and 1 μM) and CQ (0, 50 and 100 μM) for 24 h. Appearance of apoptotic cells was assessed by flow cytometry using annexin V/PI staining. The values of the lower right area and the upper right area indicate the percentage of the cells in early apoptosis and late apoptosis, respectively. (f) The cell cycle analyses by PI staining are shown. MDS‐L cells were treated with indicated concentrations of WA and CQ for 24 h, and the cells were stained with PI and analyzed by flow cytometry. Representative histogram patterns by each treatment are shown. (g) The cell fractions at G1, S and G2⁄M phase are presented by white, gray and black bars, respectively. The data represent the mean values with SD from three independent experiments.
In contrast, microarray analyses did not show increased expression of HMOX1 after the addition of decitabine, lenalidomide and rigosertib (these are the drugs with promising anticancer effects on MDS) to MDS‐L cells (data not shown).
Chloroquine inhibits autophagy and enhances Withaferin A‐induced apoptosis
As GSEA demonstrated the upregulation of autophagy‐related molecules such as HMOX1 and WIPI1 during WA treatment (Fig. 4b), we investigated LC3 expression at the cellular level, and confirmed that WA treatment resulted in increased levels of LC3A/B (Figs 3b,5a). Using a flowcytometric method, WA‐induced autophagy was detected on most of the cells (Fig. 5b).
Chloroquine is known to suppress autophagy by inhibiting lysosome‐autophagosome fusion.23 CQ treatment by itself caused marked accumulation of LC3A/B‐II (Fig. 5a). Hence, we assessed LC3A/B accumulation by the combined use of WA and CQ. Immunoblotting analysis revealed no apparent changes (Fig. 5a), but LC3A/B showed increased cytoplasmic accumulation on immunostaining (Fig. 5c) by co‐treatment with WA and CQ. Although MDS‐L cell growth was moderately suppressed by treatment with CQ alone, the combined treatment with WA and CQ increased the growth‐suppressive effect (Fig. 5d). While the combined use of the two drugs did not result in any apparent changes in C‐PARP (Fig. 5a), annexin V/PI staining showed an increase in the fraction of early apoptosis (annexin V‐positive and PI‐negative fraction shown in Fig. 5e). In regards to the cell cycle, CQ did not affect the pattern of the cell cycle with the single administration nor in combination with WA (Fig. 5f,g).
Normal bone marrow CD34‐positive cells are less susceptible to Withaferin A than leukemic cell lines
To assess the effects of WA on normal hematopoietic cells, normal bone marrow CD34‐positive cells were treated with WA for 48 h, and the cell growth, morphology and cell cycle were evaluated. Unlike MDS‐L cells, normal CD34‐positive cells revealed no apparent growth‐suppressive effect (Fig. 6a), no increase in mitotic cells (Fig. 6b) and no apparent change of the cell cycle pattern in the short‐term culture (Fig. 6c,d).
Figure 6.
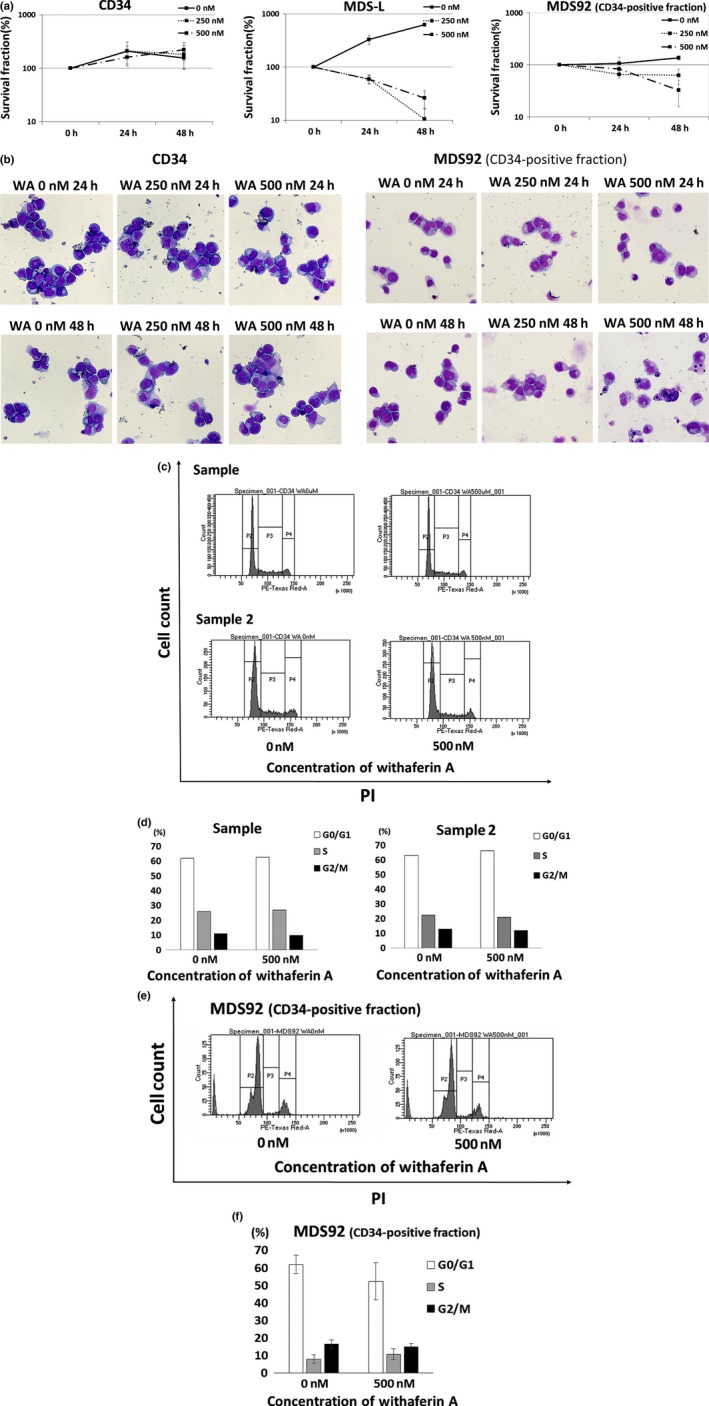
Withaferin A (WA) has no apparent suppressive effect on the growth of normal bone marrow CD34‐positive cells in the short‐term culture. (a) Normal human bone marrow CD34‐positive cells (n = 3), MDS‐L and MDS92 (CD34‐positive fraction) cells were treated with the indicated concentrations of WA for 24 and 48 h, and cell count was assessed by trypan blue dye exclusion assay. The data represent the mean values with SD from three independent experiments. (b) Normal human bone marrow CD34‐positive cells (n = 3) and MDS92 (CD34‐positive fraction) cells were treated with the indicated concentrations of WA for 24 and 48 h, and cytospin preparations were stained by May–Gruenwald–Giemsa (original magnification ×400). Representative images for each treatment are shown. (c, e) The cell cycle analyses by PI staining are shown. Human normal bone marrow CD34‐positive cells (sample 1 and sample 2) and MDS92 (CD34‐positive fraction) cells were treated with indicated concentrations of WA for 24 h, and the cells were stained with PI and analyzed by flow cytometry. Representative histogram patterns for each treatment are shown. (d) From the data of two normal CD34‐positive cells shown in (c), the cell fractions at G1, S and G2⁄M phase are presented by white, gray and black bars, respectively. (f) From the data of MDS92 cells shown in (e), the cell fractions at G1, S and G2⁄M phase are presented by white, gray and black bars, respectively. The data represent the mean values with SD from three independent experiments.
We further investigated the effects of WA on a pathological but less aggressive cell line MDS92, the parental cell line of MDS‐L. The CD34‐positive fraction of MDS92 (comparable to blastic MDS‐L cells) proliferated more slowly than MDS‐L (the doubling time of MDS92 and MDS‐L was over 60 h and <24 h, respectively). As compared with MDS‐L cells, the CD34‐positive fraction of MDS92 cells revealed weaker growth suppression (Fig. 6a), no increase in mitotic cells (Fig. 6b) and no apparent change of the cell cycle pattern (Fig. 6e,f) than MDS‐L cells.
Aiming at clinical application of WA to AML, we examined the effects of WA on the bone marrow leukemic cells of an untreated AML patient and found that WA exerted a subtle toxicity on primary leukemic cells with no apparent effects on morphology and cell cycle pattern (Figs S1–S4).
Discussion
Despite several reports of the potential of WA as an anticancer agent, no clinical applications have been reported, and the precise mechanisms of action are largely unknown. In this study, we investigated the in vitro effects of WA on myelodysplasia and leukemia cell lines to ascertain the potential utility of WA for the treatment of leukemia and MDS. Concentration‐dependent growth‐suppressive effects were confirmed in all cell lines studied, and the IC50 values ranged from 60 to 200 nM at 72 h (Fig. 1), which are lower than the range of IC50 values reported for other cancer cell lines (300 to 1000 nM at 72 h),14, 24 suggesting that human leukemia cell lines are comparatively highly susceptible to WA. WA treatment also resulted in an increased number of mitotic cells, and the cell cycle analysis showed that WA induces G2/M arrest (Fig. 2). We further indicated that WA treatment induces apoptosis, although it might be limited to the partial or early apoptotic phase.
As WA presumably has multifaceted mechanisms of action, the effects on gene expression were explored by microarray gene expression profiling and GSEA. After 12 h of WA treatment, the activation of the V$USF_Q6_01 gene set was found to be the most significant (Fig. 4a). Although this set is composed of genes with promoter regions (−2 kb–+2 kb) around the transcription start site containing the motif (NRCCACGTGASN), the implication of this motif is not clear at present (see http://www.broadinstitute.org/gsea/index.jsp). Detailed analysis of the genes in the set confirmed that HMOX1 was rated the top of the genes by GSEA (Fig. 4b). Increased HMOX1 expression was also confirmed at the protein level (Figs 3b,5a).
HMOX1 is the rate‐limiting enzyme during the degradation of heme into carbon monoxide (CO), biliverdin and ferrous iron, and its activity is crucial for tissue homeostasis such as mediation of oxidative stress, attenuation of inflammatory response, regulation of apoptosis, and acceleration of autophagy.25, 26, 27, 28 Previous reports indicated that antitumor drug administration results in an increase in HMOX1 expression in tumor cells, which might be a pro‐survival mechanism linked to the induction of autophagy.25, 29 This suggests that autophagy is induced in tumor cells treated with antitumor drugs and is, thereby, involved in acquired resistance to chemotherapy.30
Our data suggest that both apoptosis and autophagy occurred coincidentally after WA treatment in MDS‐L cells (Figs 3a,b,5a,b). It is likely that WA triggered multiple and apparently opposite signals related to cell survival or death. The viable cell count might express the result of net balance between apoptosis and autophagy (anti‐apoptosis). Our hypothesis is that WA‐induced autophagy renders the cells resistant to some degree to apoptosis induced simultaneously by WA, and that CQ releases suppression of apoptosis by unlocking autophagy and, consequently, accelerates apoptosis. In fact, combined treatment with WA and an autophagy inhibitor CQ resulted in enhanced apoptosis (Fig. 5d,e).
It has been reported that therapeutic efficacy is enhanced by the inhibition of autophagy activated during anticancer chemotherapy.31, 32 On this basis, a phase 1 clinical study was conducted on bortezomib in combination with an autophagy inhibitor, hydroxychloroquine, for the treatment of multiple myeloma.33 CQ and hydroxychloroquine have been used as autophagy inhibitors in several studies.23, 32, 33, 34
Our data seem to be inconsistent with a previous report using breast cancer cells that autophagy did not affect WA‐mediated cell death.3 Valid explanation is difficult at present, but it might depend on the difference of cell types used in the experiments, and particularly high sensitivity of leukemia/lymphoma cells to WA might be related to cell death accelerated by autophagy inhibition. Although there is no informative literature on whether autophagy induction by WA is related to its cytocidal effect,3, 35 our study suggests that the combination of WA and autophagy inhibitors is a potential treatment option.
To the best of our knowledge, only a few reports indicate that WA has no significant effect on normal tissue,4, 12 and there are no reports describing its effects on normal hematopoietic cells. We therefore compared the growth‐suppressive effects of WA among human normal bone marrow CD34‐positive cells, MDS‐L cells and MDS92 cells. Unlike MDS‐L cells, normal CD34‐positive cells revealed neither an apparent growth‐suppressive effect nor an apparent change of the cell cycle pattern (Fig. 6). In contrast, MDS92 cells (CD34‐positive fraction) revealed a slight but less growth‐suppressive effect than MDS‐L cells. Taken together, the results suggest that more aggressive or malignant cell populations tend to show more damage with short‐term exposure to WA. However, longer treatment with WA should be attempted to assess the cytotoxic effects on the normal hematopoietic system more precisely.
In addition to studies using normal hematopoietic cells, the in vitro effects of WA on primary leukemic cells should be checked before clinical trials are planned. In the present study, we examined only one AML case and found a subtle toxicity of WA on cell growth with no apparent effects on morphology and cell cycle pattern (Fig. S1). Unlike the cell lines used in this study, primary leukemic cells are composed of a large number of indolent cells and only small proliferating populations, and, therefore, more sensitive experiments such as colony formation assay would be necessary to evaluate the effects of WA on primary cells with longer treatment with WA.
This study showed that WA has a unique growth‐suppressive effect on leukemia/lymphoma cell lines but also suggested that the antitumor effect of WA itself is limited. Its use in combination with autophagy inhibitors or the other agents with different mechanisms of action may provide a basis for a novel therapeutic approach to the treatment of leukemia and MDS.
Disclosure Statement
The authors have no conflict of interest to declare.
Supporting information
Fig. S1. The evaluation of primary leukemia cells treated with withaferin A (WA) by trypan blue.
Fig. S2. The morphological assessment of primary leukemia cells treated with withaferin A (WA) by May–Gruenwald–Giemsa staining.
Fig. S3. The cell cycle analyses by PI staining in primary leukemic cells treated with withaferin A (WA).
Fig. S4. Effect of withaferin A (WA) on apoptosis in primary leukemic cells.
Acknowledgments
This work was supported in part by a Grant‐in‐Aid for Scientific Research from the Japan Society for the Promotion of Science, and in part by a Kawasaki Medical School project grant. The authors thank Professor Takashi Sugihara and Professor Hideho Wada, a Division of Hematology, Department of Internal Medicine, Kawasaki Medical School for providing the patient samples, and Ms. Aki Kuyama for editorial assistance.
Cancer Sci 107 (2016) 1302–1314
Funding Information
Japan Society for the Promotion of Science; Kawasaki Medical School Project Grant.
References
- 1. Ohtake S, Miyawaki S, Fujita H et al Randomized study of induction therapy comparing standard‐dose idarubicin with high‐dose daunorubicin in adult patients with previously untreated acute myeloid leukemia: The JALSG AML201 Study. Blood 2011; 117: 2358–65. [DOI] [PubMed] [Google Scholar]
- 2. Stein EM. Molecularly targeted therapies for acute myeloid leukemia. Hematology Am Soc Hematol Educ Program 2015; 2015: 579–83. [DOI] [PubMed] [Google Scholar]
- 3. Hahm ER, Singh SV. Autophagy fails to alter withaferin A‐mediated lethality in human breast cancer cells. Curr Cancer Drug Targets 2013; 13: 640–50. [DOI] [PMC free article] [PubMed] [Google Scholar]
- 4. Nishikawa Y, Okuzaki D, Fukushima K et al Withaferin A induces cell death selectively in androgen‐independent prostate cancer cells but not in normal fibroblast cells. PLoS ONE 2015; 10: e0134137. [DOI] [PMC free article] [PubMed] [Google Scholar]
- 5. Rai M, Jogee PS, Agarkar G, Santos CA. Anticancer activities of Withania somnifera: Current research, formulations, and future perspectives. Pharm Biol 2016; 54: 189–97. [DOI] [PubMed] [Google Scholar]
- 6. Shohat B, Gitter S, Abraham A, Lavie D. Antitumor activity of withaferin A (NSC‐101088). Cancer Chemother Rep 1967; 51: 271–6. [PubMed] [Google Scholar]
- 7. Lee J, Hahm ER, Marcus AI, Singh SV. Withaferin A inhibits experimental epithelial–mesenchymal transition in MCF‐10A cells and suppresses vimentin protein level in vivo in breast tumors. Mol Carcinog 2015; 54: 417–29. [DOI] [PMC free article] [PubMed] [Google Scholar]
- 8. Roy RV, Suman S, Das TP, Luevano JE, Damodaran C. Withaferin A, a steroidal lactone from Withania somnifera, induces mitotic catastrophe and growth arrest in prostate cancer cells. J Nat Prod 2013; 76: 1909–15. [DOI] [PMC free article] [PubMed] [Google Scholar]
- 9. Antony ML, Lee J, Hahm ER et al Growth arrest by the antitumor steroidal lactone withaferin A in human breast cancer cells is associated with down‐regulation and covalent binding at cysteine 303 of β‐tubulin. J Biol Chem 2014; 289: 1852–65. [DOI] [PMC free article] [PubMed] [Google Scholar]
- 10. Bargagna‐Mohan P, Hamza A, Kim YE et al The tumor inhibitor and antiangiogenic agent withaferin A targets the intermediate filament protein vimentin. Chem Biol 2007; 14: 623–34. [DOI] [PMC free article] [PubMed] [Google Scholar]
- 11. Stan SD, Zeng Y, Singh SV. Ayurvedic medicine constituent withaferin a causes G2 and M phase cell cycle arrest in human breast cancer cells. Nutr Cancer 2008; 60(Suppl 1): 51–60. [DOI] [PMC free article] [PubMed] [Google Scholar]
- 12. McKenna MK, Gachuki BW, Alhakeem SS et al Anti‐cancer activity of withaferin A in B‐cell lymphoma. Cancer Biol Ther 2015; 16: 1088–98. [DOI] [PMC free article] [PubMed] [Google Scholar]
- 13. Oh JH, Lee TJ, Kim SH et al Induction of apoptosis by withaferin A in human leukemia U937 cells through down‐regulation of Akt phosphorylation. Apoptosis 2008; 13: 1494–504. [DOI] [PubMed] [Google Scholar]
- 14. Grogan PT, Sarkaria JN, Timmermann BN, Cohen MS. Oxidative cytotoxic agent withaferin A resensitizes temozolomide‐resistant glioblastomas via MGMT depletion and induces apoptosis through Akt/mTOR pathway inhibitory modulation. Invest New Drugs 2014; 32: 604–17. [DOI] [PMC free article] [PubMed] [Google Scholar]
- 15. Lv TZ, Wang GS. Antiproliferation potential of withaferin A on human osteosarcoma cells via the inhibition of G2/M checkpoint proteins. Exp Ther Med 2015; 10: 323–9. [DOI] [PMC free article] [PubMed] [Google Scholar]
- 16. Tohyama K, Tsutani H, Ueda T, Nakamura T, Yoshida Y. Establishment and characterization of a novel myeloid cell line from the bone marrow of a patient with the myelodysplastic syndrome. Br J Haematol 1994; 87: 235–42. [DOI] [PubMed] [Google Scholar]
- 17. Tsujioka T, Yokoi A, Uesugi M et al Effects of DNA methyltransferase inhibitors (DNMTIs) on MDS‐derived cell lines. Exp Hematol 2013; 41: 189–97. [DOI] [PubMed] [Google Scholar]
- 18. Matsuoka A, Tochigi A, Kishimoto M et al Lenalidomide induces cell death in an MDS‐derived cell line with deletion of chromosome 5q by inhibition of cytokinesis. Leukemia 2010; 24: 748–55. [DOI] [PubMed] [Google Scholar]
- 19. Drexler HG, Dirks WG, Macleod RA. Many are called MDS cell lines: One is chosen. Leuk Res 2009; 33: 1011–6. [DOI] [PubMed] [Google Scholar]
- 20. Hyoda T, Tsujioka T, Nakahara T et al Rigosertib induces cell death of a myelodysplastic syndrome‐derived cell line by DNA damage‐induced G2/M arrest. Cancer Sci 2015; 106: 287–93. [DOI] [PMC free article] [PubMed] [Google Scholar]
- 21. Tsujioka T, Yokoi A, Itano Y et al Five‐aza‐2′‐deoxycytidine‐induced hypomethylation of cholesterol 25‐hydroxylase gene is responsible for cell death of myelodysplasia/leukemia cells. Sci Rep 2015; 5: 16709. [DOI] [PMC free article] [PubMed] [Google Scholar]
- 22. Subramanian A, Tamayo P, Mootha VK et al Gene set enrichment analysis: A knowledge‐based approach for interpreting genome‐wide expression profiles. Proc Natl Acad Sci USA 2005; 102: 15545–50. [DOI] [PMC free article] [PubMed] [Google Scholar]
- 23. Maclean KH, Dorsey FC, Cleveland JL, Kastan MB. Targeting lysosomal degradation induces p53‐dependent cell death and prevents cancer in mouse models of lymphomagenesis. J Clin Invest 2008; 118: 79–88. [DOI] [PMC free article] [PubMed] [Google Scholar]
- 24. Szarc vel Szic K, Op de Beeck K, Ratman D et al Pharmacological levels of Withaferin A (Withania somnifera) trigger clinically relevant anticancer effects specific to triple negative breast cancer cells. PLoS ONE 2014; 9: e87850. [DOI] [PMC free article] [PubMed] [Google Scholar]
- 25. Jozkowicz A, Was H, Dulak J. Heme oxygenase‐1 in tumors: Is it a false friend? Antioxid Redox Signal 2007; 9: 2099–117. [DOI] [PMC free article] [PubMed] [Google Scholar]
- 26. Was H, Dulak J, Jozkowicz A. Heme oxygenase‐1 in tumor biology and therapy. Curr Drug Targets 2010; 11: 1551–70. [DOI] [PubMed] [Google Scholar]
- 27. Dong C, Zheng H, Huang S et al Heme oxygenase‐1 enhances autophagy in podocytes as a protective mechanism against high glucose‐induced apoptosis. Exp Cell Res 2015; 337: 146–59. [DOI] [PubMed] [Google Scholar]
- 28. Zhao Y, Zhang L, Qiao Y et al Heme oxygenase‐1 prevents cardiac dysfunction in streptozotocin‐diabetic mice by reducing inflammation, oxidative stress, apoptosis and enhancing autophagy. PLoS ONE 2013; 8: e75927. [DOI] [PMC free article] [PubMed] [Google Scholar]
- 29. Tan Q, Wang H, Hu Y et al Src/STAT3‐dependent heme oxygenase‐1 induction mediates chemoresistance of breast cancer cells to doxorubicin by promoting autophagy. Cancer Sci 2015; 106: 1023–32. [DOI] [PMC free article] [PubMed] [Google Scholar]
- 30. Huang Z, Zhou L, Chen Z, Nice EC, Huang C. Stress management by autophagy: implications for chemoresistance. Int J Cancer 2016; 139: 23–32. [DOI] [PubMed] [Google Scholar]
- 31. Yao F, Wang G, Wei W, Tu Y, Tong H, Sun S. An autophagy inhibitor enhances the inhibition of cell proliferation induced by a proteasome inhibitor in MCF‐7 cells. Mol Med Rep 2012; 5: 84–8. [DOI] [PubMed] [Google Scholar]
- 32. Rosich L, Xargay‐Torrent S, López‐Guerra M, Campo E, Colomer D, Roué G. Counteracting autophagy overcomes resistance to everolimus in mantle cell lymphoma. Clin Cancer Res 2012; 18: 5278–89. [DOI] [PubMed] [Google Scholar]
- 33. Vogl DT, Stadtmauer EA, Tan KS et al Combined autophagy and proteasome inhibition: A phase 1 trial of hydroxychloroquine and bortezomib in patients with relapsed/refractory myeloma. Autophagy 2014; 10: 1380–90. [DOI] [PMC free article] [PubMed] [Google Scholar]
- 34. Altman JK, Szilard A, Goussetis DJ et al Autophagy is a survival mechanism of acute myelogenous leukemia precursors during dual mTORC2/mTORC1 targeting. Clin Cancer Res 2014; 20: 2400–9. [DOI] [PMC free article] [PubMed] [Google Scholar]
- 35. Vyas AR, Singh SV. Molecular targets and mechanisms of cancer prevention and treatment by withaferin a, a naturally occurring steroidal lactone. AAPS J 2014; 16: 1–10. [DOI] [PMC free article] [PubMed] [Google Scholar]
Associated Data
This section collects any data citations, data availability statements, or supplementary materials included in this article.
Supplementary Materials
Fig. S1. The evaluation of primary leukemia cells treated with withaferin A (WA) by trypan blue.
Fig. S2. The morphological assessment of primary leukemia cells treated with withaferin A (WA) by May–Gruenwald–Giemsa staining.
Fig. S3. The cell cycle analyses by PI staining in primary leukemic cells treated with withaferin A (WA).
Fig. S4. Effect of withaferin A (WA) on apoptosis in primary leukemic cells.


