Abstract
Endometrioid carcinoma (EC) is one of the most common malignancies of the female genital system. Although the behavior of EC ranges from an excellent prognosis to aggressive disease with a poor outcome, the factors that determine its diversity have not been determined. Here, we show that S100A4, a calcium‐binding protein of the EF‐hand type, is correlated with the proliferation and invasion ability of EC. We demonstrated previously that EC cells with high aldehyde dehydrogenase (ALDH) activity were more tumorigenic than ALDH‐lo cells. Screening by shotgun proteomics demonstrated that the expression level of S100A4 in ALDH‐hi EC cells was significantly higher than that in ALDH‐lo cells. S100A4‐knockout cells generated by the CRISPR/Cas9 system showed reduced proliferation and invasion. These cells showed impaired AKT phosphorylation and matrix metalloproteinase‐2 activation, accounting for their impaired proliferation and invasion, respectively. Furthermore, in clinical EC samples, elevated expression of S100A4 was highly related to myometrial and lymphatic invasion in well to moderately differentiated EC. Notably, strong and diffuse expression of S100A4 was observed in tumor tissues with a microcystic, elongated and fragmented (“MELF”) pattern, which is associated with a highly invasive EC phenotype. Collectively, our results demonstrate not only that high expression of S100A4 contributes to an aggressive phenotype of EC, but also that its elevated expression is closely related to the MELF histopathological pattern.
Keywords: AKT, endometrioid carcinoma, MELF, MMP2, S100A4
Endometrioid carcinoma (EC) is one of the most common malignancies of the female genital system. The International Federation of Gynecology and Obstetrics (FIGO) classifies EC histologically into three groups: carcinomas having 5% or less solid growth are designated as grade 1 (G1), those with 6–50% solid growth as grade 2 (G2), and those with more than 50% solid growth as grade 3 (G3). In our previous study, we revealed that aldehyde dehydrogenase 1 (ALDH1), a predominant isoform of the ALDH family in mammals and a potential marker of normal and malignant stem cells,1 was related to tumorigenic potential in EC;2 ALDH1‐expressing (ALDH‐hi) EC cells were more tumorigenic, invasive and resistant to anticancer agents than ALDH‐lo cells.2
The S100 protein family is the largest subfamily of calcium‐binding proteins of the EF‐hand type, which function both as intracellular Ca2+ sensors and as extracellular factors, and contribute to the fine‐tuning of cellular responses.3 S100A4, also known as mts1, p9Ka, FSP1, CAPL, calvasculin, pEL98, metastasin, 18A2 and 42A, is a member of the S100 protein family and is a marker of the progression and metastatic potential of various types of cancers, such as prostatic cancer, hepatocellular carcinoma and endometrial cancer.3 Examining the cellular functions of S100A4, Naaman et al.4 used S100A4‐knockout mice to reveal that depletion of S100A4 results in functional destabilization of the p53 tumor suppressor gene. Zhang et al.5 report that S100A4 enhances migration and invasion by hepatocellular carcinoma cells via NF‐kappa B‐dependent matrix metalloproteinase (MMP)‐9 signaling. Saleem et al.6 demonstrate that S100A4 accelerates tumorigenesis and invasion of human prostate cancer through transcriptional regulation of MMP9. Regarding EC, Xie et al.7 performed immunohistochemistry and quantitative real‐time RT‐PCR, and showed that S100A4 is overexpressed in G3 EC, whereas its expression in G1 and G2 EC is comparable to that of normal endometrium (i.e. low). They also indicated that suppression of the S100A4 gene by shRNA reduces migration and invasion of the EC cell line HEC‐1A.8 Thus, the functional importance of S100A4 has been suggested in various types of cancer, including EC. However, whether S100A4 correlates with histopathological findings such as the presence of specific morphological patterns remains unclear.
In this study, we reveal that S100A4 expression promotes the proliferation and invasion of EC using S100A4‐knockout cells generated by the CRISPR/Cas9 system. Notably, immunohistochemistry using clinical EC samples revealed that high expression levels of S100A4 were correlated with the presence of myometrial and lymphatic invasion. It is also noteworthy that S100A4 was highly expressed in the microcystic, elongated and fragmented (MELF) histological pattern, which is associated with an invasive phenotype of EC.9, 10
Materials and Methods
Cell lines and sorting of the high aldehyde dehydrogenase population
The human endometrioid carcinoma (EC) cell line HEC‐1 (HEC‐1B) was purchased from the Health Science Research Resources Bank of Osaka, Japan. Cells were cultured in DMEM (Wako, Osaka, Japan) containing 10% FBS (Nippon Bio‐Supply Center, Tokyo, Japan). To isolate the population with high ALDH1 activity, we used the ALDEFLUOR Kit (Stem Cell Technologies, Vancouver, BC, Canada) following the manufacturer's instructions. We divided HEC‐1B cells into ALDH‐hi cells and ALDH‐lo cells by means of FACSAria Flow Cytometry (BD Biosciences, San Jose, CA, USA).
Shotgun proteomics
We compared the levels of various proteins in ALDH‐hi cells and ALDH‐lo cells using shotgun proteomics, which is based on multidimensional liquid chromatography‐tandem mass spectrometry (LC‐MS/MS). Sorted ALDH‐hi cells and ALDH‐lo cells were solubilized and digested. LC‐MS/MS analysis was performed on an UltiMate 3000 Nano LC system (Thermo Fisher Scientific, Waltham, MA, USA) coupled to a Q‐Exactive hybrid quadrupole‐Orbitrap mass spectrometer (Thermo Fisher Scientific) with a nano‐electrospray ionization source.
Generation of S100A4‐knockout HEC‐1B cells using the CRISPR/Cas9 system
Target sequences for single‐guide RNA (Fig. S1) were cloned into the pX330‐U6‐Chimeric_BB‐CBh‐hSpCas9 vector, which was purchased from Addgene (Plasmid #42230). We carefully selected target RNA sequences with minimal homology to other genes using NCBI nucleotide BLAST to minimize the off‐target effect. We transfected these targeting vectors into HEC‐1B cells using Lipofectamine 3000 reagent (Thermo Fisher Scientific), and constructed stable S100A4‐knockout (KO1 and KO2) cell lines by drug selection using a linear hygromycin marker (Clontech, Mountain View, CA, USA). Similarly, we transfected the pX330‐U6‐Chimeric_BB‐CBh‐hSpCas9 empty vector into HEC‐1B cells with a linear hygromycin marker and constructed a stable cell line, which was used as a control (empty vector, EV).
Antibodies
An antibody against S100A4 (D9F9D, number 13018; Cell Signaling Technology, Danvers, MA, USA) was used for immunoblotting (1:1000), immunocytochemistry (1:800) and immunohistochemistry (1:800). An antibody against phospho‐AKT (Ser473) (number 4060; Cell Signaling Technology) was used for immunoblotting (1:2000) and immunohistochemistry (1:50). Antibodies against AKT (1:1000) (number 4691), extracellular signal‐regulated protein kinases 1 and 2 (ERK1/2) (1:1000) (number 4695) and phospho‐ERK1/2 (Thr202/Tyr204) (1:2000) (number 4370) were obtained from Cell Signaling Technology. The antibody against podoplanin (1:100) (D2‐40, number 916602) was purchased from BioLegend (San Diego, CA, USA). The antibody against pan‐cytokeratin (prediluted) (AE1/AE3, number IR053) was obtained from Dako Japan (Tokyo, Japan). The antibody against β‐actin (1:1000) (13E5, HRP conjugate, number 5125), which was used as a loading control for immunoblotting, was purchased from Cell Signaling Technology.
Immunoblotting
Cells were lysed in buffer containing 10 mM HEPES, 10 mM KCl, 1 mM EDTA, 1 mM dithiothreitol and 0.1% Nonidet P‐40. Electrophoresis was performed in 10% sodium dodecyl sulfate–polyacrylamide gels (ATTO, Tokyo, Japan), and proteins were transferred to polyvinylidene fluoride membranes (Millipore, Billerica, MA, USA). Primary antibodies were detected using HRP‐conjugated anti‐rabbit IgG (H+L chain) (MBL, Nagoya, Japan, dilution at 1:5000). We quantified the results using ImageJ (https://imagej.nih.gov/ij/).
Immunocytochemistry
Cells were cultured in a chamber slide (Lab‐Tek, Campbell, CA, USA) and then fixed with 10% formalin. After treatment with peroxidase blocking solution (DAKO), cells were incubated with an anti‐S100A4 antibody. Cells were then treated with the ChemMate EnVision Kit (DAKO), and DAB (DAKO) was used as a chromogen.
Proliferation assay
To evaluate cellular proliferation, cells were seeded at a density of 1 × 10⁵ per well in 6‐well culture plates (Greiner Bio‐One, Frickenhausen, Germany) and cultured for 4 days at 37°C with 5% CO2. Cell numbers were counted at days 2 and 4 using a Muse Cell Analyzer (Millipore).
Scratch assay
Confluent S100A4‐knockout cells (KO1 and KO2) and control cells (EV) were wounded using sterilized pipette tips and incubated in culture medium for 10 h at 37°C with 5% CO2. Migration distance was calculated by subtracting the width of the wound at 10 h from that at 0 h. The distance of migration of EV is expressed as 100%. The relative migration distance with KO1 and KO2 is expressed as a percentage of EV.
Matrigel invasion assay
Tumor cell invasion was examined using a Corning BioCoat Matrigel Invasion Chamber (Corning Inc., Corning, NY, USA). Tumor cells were placed into the upper chamber in DMEM without FBS and incubated at 37°C for 6 days. The lower chamber contained DMEM with 10% FBS. Invasive cells, which migrated to the lower side of the upper chamber, were stained with Diff‐Quik (Sysmex, Hyogo, Japan). The number of invasive cells was counted in five random fields per chamber at high magnification.
Effects of the anticancer drug
To evaluate the effect of anticancer drugs, 1 × 10⁴ cells were seeded into 96‐well culture plates and incubated for 24 h at 37°C with 5% CO2. We subsequently added cisplatin (Sigma‐Aldrich, St. Louis, MO, USA) (0, 25, 50, 100, 200 or 400 μM) or carboplatin (Sigma‐Aldrich) (0, 31.25, 62.5, 125, 250 or 500 μM). After 72 h (cisplatin) or 48 h (carboplatin) of incubation, 10 μL of Premix WST‐1 reagent (Takara Bio, Kyoto, Japan) were added to each well. After 1 h incubation, absorbance was measured. The absorbance at 450 nm was subtracted from the background absorbance (690 nm).
Gelatin zymography
Cells were seeded and cultured in DMEM without 10% FBS for 12 h. Then, the supernatant was collected, concentrated using Vivaspin (GE, Fairfield, CT, USA), and subjected to gelatin zymography using a Gelatin‐Zymography Kit (Cosmo Bio, Tokyo, Japan) according to the vendor's protocol. To verify cell number equality, cells were subjected to immunoblotting using an anti‐β‐actin antibody after collecting the supernatant. We quantified the results using ImageJ.
Patients
We examined 105 patients undergoing surgery for EC of the uterine corpus at Osaka University Hospital from 2011 to 2014. Resected specimens were fixed in 10% formalin and processed for paraffin embedding. Specimens were stored at room temperature in a dark room. Specimens for evaluation were sectioned at 4‐μm thickness and stained with HE. Tumors were classified according to histological grade (G1, G2 or G3), myometrial invasion, lymphatic invasion and FIGO stage. The study was approved by the Ethical Review Board of the Graduate School of Medicine, Osaka University (No. 15234).
Immunohistochemistry
Immunohistochemical staining was performed using a Roche Ventana BenchMark GX autostainer (Ventana Medical Systems, Tucson, AZ, USA) according to the manufacturer's instructions. Staining intensity (0, 1+, 2+ or 3+) was determined for each sample independently by two pathologists (S.T. and K.O.). Histological score (H‐score) was calculated using the following formula: [1× (% tumor cells of 1+) + 2× (% tumor cells of 2+) + 3× (% tumor cells of 3+)].11, 12
Statistical analysis
Results are shown as the means ± standard error (SE). Differences in results were determined using Student's t‐test. P‐values < 0.05 were considered to indicate statistical significance.
Results
High expression of S100A4 in high aldehyde dehydrogenase cells
To identify factors that regulate the progression of EC, we analyzed the protein expression profiles of ALDH‐hi and ALDH‐lo HEC‐1B human EC cells using shotgun proteomics, which is based on LC‐MS/MS (Fig. 1a). As shown in Table 1, S100A4, a calcium‐binding protein of the EF‐hand type and a marker of the progression and metastatic potential of various types of cancer, was more highly expressed in ALDH‐hi cells compared to ALDH‐lo cells. Indeed, ALDH‐hi cells showed significantly higher expression levels of S100A4 than ALDH‐lo cells (Fig. 1b). These findings suggest that S100A4 expression is involved in the malignant potential of EC.
Figure 1.
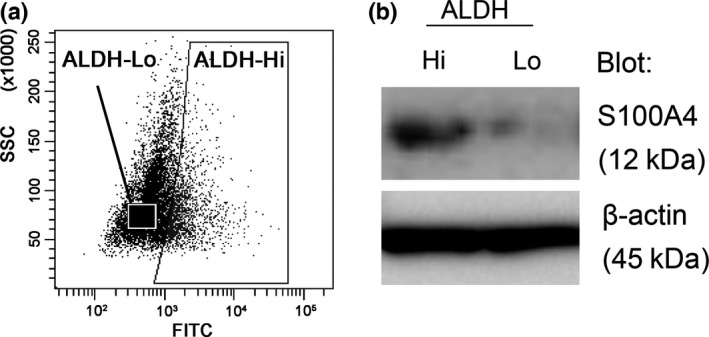
Screening of key molecules related to high aldehyde dehydrogenase 1 (ALDH1) activity. (a) Sorting strategy for the isolation of ALDH‐hi cells and ALDH‐lo cells. HEC‐1B cells were stained with ALDEFLUOR reagent, followed by cell sorting by flow cytometry. (b) S100A4 protein levels in ALDH‐hi and ALDH‐lo cells were determined by immunoblotting. Equal cell loading was confirmed by quantifying β‐actin (input control).
Table 1.
List of proteins identified by shotgun proteomics
| Protein name | Accession number | Ratioa |
|---|---|---|
| ALDH1A1 | IPI00218914 | 3.512 |
| Neural cell adhesion molecule 1 | IPI00435020 (+1) | 2.925 |
| Serum deprivation‐response protein | IPI00005809 | 2.899 |
| Histone H2B type 1‐L | IPI00018534 (+11) | 2.766 |
| Nicotinamide N‐methyltransferase | IPI00027681 | 2.591 |
| Alkaline phosphatase, tissue‐nonspecific isozyme | IPI00419916 | 2.405 |
| Tripartite motif‐containing protein 72 | IPI00301028 | 2.349 |
| Transcriptional activator protein Pur‐beta | IPI00045051 | 1.951 |
| Isoform 1 of Filamin‐C | IPI00178352 | 1.908 |
| S100A4 b | IPI00032313 | 1.901 |
| Tubulin beta‐2A chain | IPI00013475 | 1.885 |
| Argininosuccinate synthase | IPI00020632 | 1.879 |
| Adenylosuccinate lyase | IPI00942092 | 1.729 |
| Alpha‐2‐macroglobulin | IPI00478003 (+1) | 1.726 |
| Ectonucleotide pyrophosphatase/phosphodiesterase family member 1 | IPI00184311 | 1.712 |
Ratio was obtained by dividing the value of protein of ALDH‐hi cells by that of ALDH‐lo cells.
S100A4 was bolded.
Involvement of S100A4 in the proliferation and invasion of endometrioid carcinoma cells
Cong et al.13 introduced a novel genome engineering method termed the CRISPR/Cas9 system, which enables manipulation of the genome of target cells in a relatively easy, rapid and precise manner. We constructed an S100A4‐knockout HEC‐1B cell line using the CRISPR/Cas9 system and determined the functional importance of S100A4. We targeted the S100A4 gene (Fig. S1) and successfully established S100A4‐knockout HEC‐1B cells, which showed no marked changes in shape (Fig. 2a,b). We next examined the effect of S100A4 deficiency on proliferation, and found that S100A4‐knockout cells showed significantly impaired proliferation (Fig. 3a). Although a scratch assay revealed that the migration of S100A4‐knockout cells was not affected (Fig. 3b), invasion of S100A4‐knockout cells was remarkably attenuated in a Matrigel invasion assay (Fig. 3c). This finding suggests that S100A4 is required for the invasion ability of EC cells. Furthermore, we evaluated the anticancer drug resistance of S100A4‐knockout cells using cisplatin and carboplatin, which are commonly used for the clinical treatment of EC. S100A4‐knockout cells did not show marked changes in drug resistance (Fig. 3d). Thus, S100A4 is involved in the proliferation and invasion, but not migration or drug resistance, of EC cells.
Figure 2.
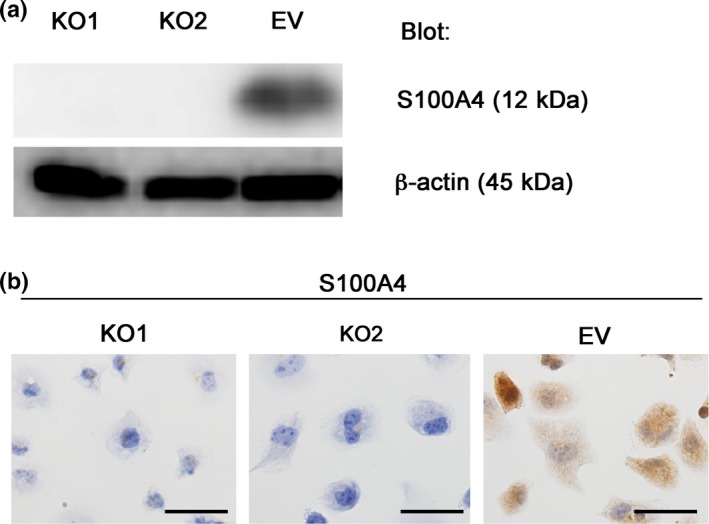
Generation of S100A4‐knockout HEC‐1B cells using the CRISPR/Cas9 system. (a) Confirmation of loss of S100A4 expression in S100A4‐knockout cells by immunoblotting. Equal cell loading was confirmed by quantifying β‐actin (input control). (b) Immunocytochemistry for S100A4. S100A4‐knockout cells (KO1 and KO2) were not stained with the anti‐S100A4 antibody, whereas the cytoplasm of control cells (EV) was stained. Scale bars: 50 μm.
Figure 3.
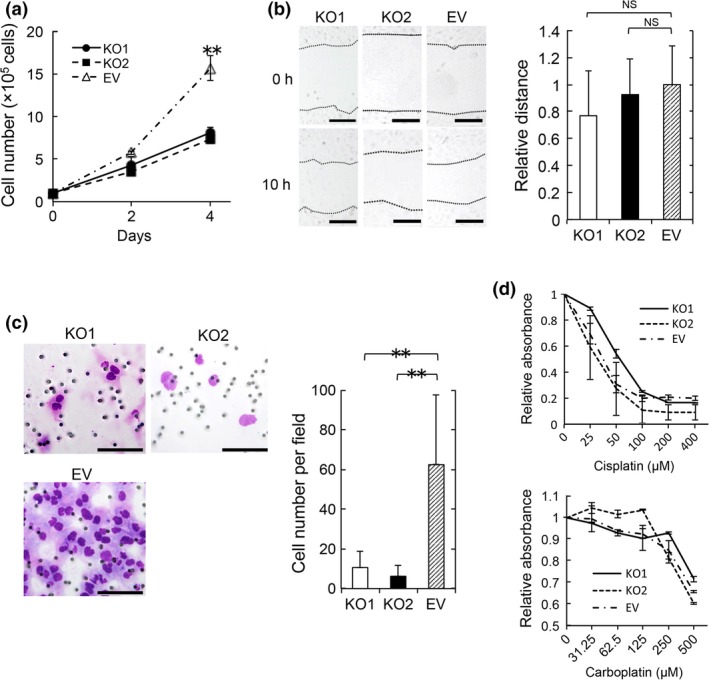
S100A4 is required for the proliferation and invasion of endometrioid carcinoma (EC). (a) Proliferation assay by enumerating cells. Cells were seeded at a density of 1 × 10⁵ per well in 6‐well plates and cultured for 4 days. Cells were enumerated on days 2 and 4. Data are representative of three independent experiments. (b) Scratch assay. S100A4‐knockout cells (KO1 and KO2) and control cells (EV) were wounded with a pipette tip, and migration toward the wounded area was observed and measured. The distance of migration was calculated by subtracting the width of the wound at 10 h from that at 0 h. The distance of migration of EV cells is expressed as 1. The relative migration distance of KO1 and KO2 cells is presented as the ratio to that of EV cells. Scale bars: 200 μm. NS, not significant. Data are representative of three independent experiments. (c) Matrigel invasion assay. Representative images of KO1, KO2 and EV cells that invaded through Matrigel are shown. Scale bars: 100 μm. Invasive cells were enumerated in five random fields per well at high magnification. Results are shown as the mean ± SE. Statistical analysis was determined using Student's t‐test. **P < 0.01. Data are representative of three independent experiments. (d) KO1, KO2 and EV cell viability was compared in the presence of various concentrations of cisplatin or carboplatin. Cells were seeded at a density of 1 × 10⁴ per well in 96‐well plates. Cisplatin and carboplatin were added after 24h incubation. After 72 h (cisplatin) or 48 h (carboplatin), 10 μL of Premix WST‐1 reagent were added. After 1 h incubation, absorbance was measured. The value of 0 μM is expressed as 1. The relative values of various concentrations of cisplatin (25, 50, 100, 200 or 400 μM) and carboplatin (31.25, 62.5, 125, 250 or 500 μM) are presented as ratios to that of 0 μM. Data are representative of two independent experiments.
Involvement of S100A4 in the activation of AKT‐dependent signaling
The serine/threonine kinase AKT plays a critical role in regulating diverse cellular functions, including proliferation, and ERK1/2 are members of the mitogen‐activated protein kinase superfamily, which mediate cell proliferation. Inappropriate activation of the AKT and ERK1/2 signal transduction pathways correlates with an aggressive phenotype of many types of cancer. Therefore, we hypothesized that S100A4 promotes EC proliferation through activation of these signaling pathways.
Immunoblotting with phosphospecific antibodies against AKT or ERK1/2 demonstrated that S100A4‐knockout cells showed significantly lower levels of AKT phosphorylation (Fig. 4a), whereas these cells did not show a marked change in ERK1/2 phosphorylation. These results indicate that S100A4 enhances proliferation through AKT phosphorylation. We confirmed the correlation between S100A4 and phospho‐AKT by immunohistochemical analysis in clinical samples of EC (Fig. S2).
Figure 4.
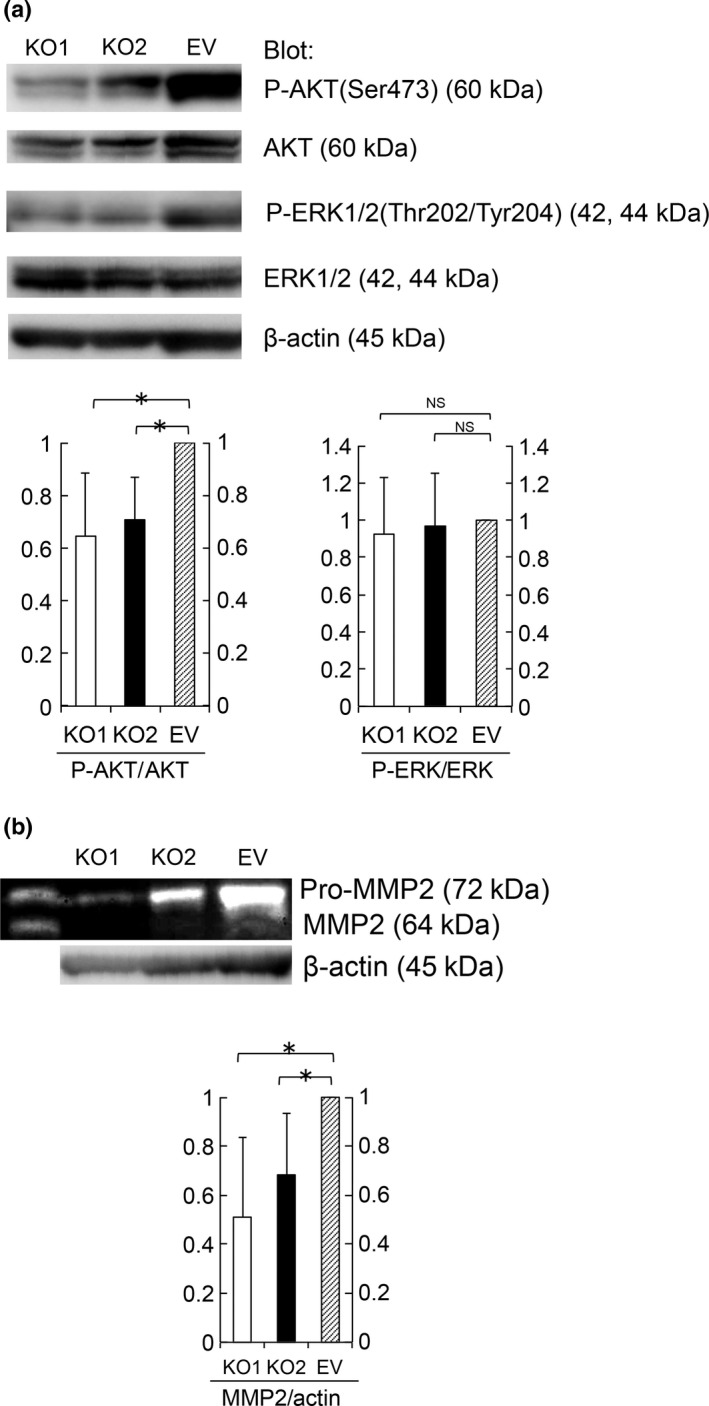
S100A4 expression enhanced AKT phosphorylation and pro‐MMP2 activation. (a) AKT, P‐AKT, ERK1/2 and P‐ERK1/2 protein levels in KO1, KO2 and EV cell lysates were determined by immunoblotting. Equal cell loading was confirmed by quantifying β‐actin (input control). Data are representative of three independent experiments. We quantified the results using ImageJ. P‐AKT/AKT and P‐ERK/ERK quotient of EV cells is expressed as 1. The relative quotient of KO1 and KO2 cells is presented as the ratio to that of EV cells. Results are shown as the mean ± SE. Statistical analysis was determined using Student's t‐test. *P < 0.05. (b) Amount of pro‐MMP2 (72 kDa) and MMP2 (64 kDa) in supernatant from KO1, KO2 and EV cells was evaluated by a gelatin zymography assay. Equal cell loading was confirmed by quantifying via immunoblotting β‐actin in cell lysates (input control). Data are representative of three independent experiments. We quantified the results using ImageJ. MMP2/actin quotient of EV cells is expressed as 1. The relative quotient of KO1 and KO2 cells is presented as the ratio to that of EV cells. Results are shown as the mean ± SE. Statistical analysis was determined using Student's t‐test. *P < 0.05.
Effect of S100A4 on MMP2
Next, we explored the molecular mechanisms by which S100A4 promotes the invasion of EC cells. MMPs are a multigene family of zinc‐dependent endopeptidases that share a similar structure and can degrade virtually any component of the extracellular matrix.14 Among these MMPs, gelatinases including MMP2 (gelatinase A) and MMP9 (gelatinase B) are key for cancer progression.15 Therefore, we hypothesized that S100A4 enhances EC invasion through the activation of MMP2 and/or MMP9.
In a gelatin zymography assay, the amount of MMP2 in supernatants secreted from S100A4‐knockout cells was significantly lower than that of control cells (Fig. 4b). These findings suggest that S100A4 promotes EC invasion via MMP2.
Elevated expression of S100A4 in the invasive histological type
Finally, to assess the relationship between S100A4 expression and proliferative and invasive phenotypes of EC in clinical cases, we performed immunohistochemical analysis using paraffin‐embedded tissue sections from EC patients (Table 2, Fig. 5a). Regarding histological grade, S100A4 was strongly and broadly positive in G1‐G2 cases, whereas it was weakly and focally positive in G3 cases (Fig. 5b), suggesting that S100A4 is expressed mainly in well‐ to moderately‐differentiated EC, and that S100A4 expression tends to be downregulated in poorly‐differentiated EC. Therefore, we selected G1 cases and statistically examined the correlation between S100A4 expression levels and histological prognostic factors (Table 3). Interestingly, the presence of myometrial invasion (invading half or more of the myometrium) and lymphatic invasion was significantly correlated with the H‐score of S100A4 (Fig. 5c,d). Thus, high expression of S100A4 contributes to the invasion ability of EC in clinical cases.
Table 2.
Correlation between H‐score of S100A4 and clinicopathological features
| Number of cases | H‐score | P‐value | |
|---|---|---|---|
| Age | |||
| ≦60 | 63 | 70.6 | 0.226 |
| >60 | 42 | 82.5 | |
| Histological grade | |||
| G1 | 60 | 83.7 | <0.05* |
| G2 | 28 | 79.8 | |
| G3 | 17 | 38.5 | |
| FIGO stage | |||
| I | 79 | 71.5 | 0.473** |
| II | 10 | 103.5 | |
| III | 14 | 80.7 | |
| IV | 2 | 47.5 | |
*P < 0.05 when compared between G1–G2 and G3. **P‐value when compared between FIGO‐I, FIGO‐II and FIGO‐III, FIGO‐IV.
Figure 5.
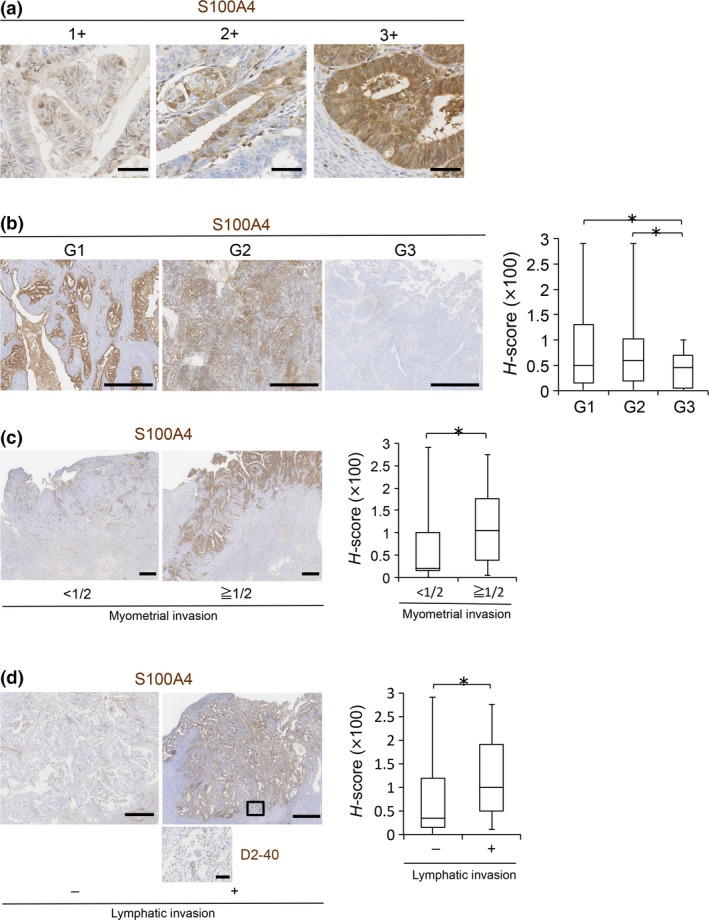
Immunohistochemistry of S100A4 in clinical samples of endometrioid carcinoma (EC). (a) Representative immunohistochemistry images of S100A4 with intensity scores of 1+, 2+ and 3+, respectively. Scale bars: 50 μm. (b) S100A4 protein levels in EC cases according to histological grade (G1: n = 60, G2: n = 28, G3: n = 17) were evaluated by calculating H‐scores. Scale bars: 1 mm. (c) S100A4 protein levels in G1 cases with (≥1/2, n = 22) or without (<1/2, n = 38) one‐half or more tumor invasion to the myometrium were compared by calculating H‐scores. Scale bars: 2 mm. (d) S100A4 protein levels in G1 cases with (n = 13) or without (n = 47) lymphatic invasion were compared by calculating H‐scores. The boxed area, which indicates lymphatic invasion, is enlarged in the bottom panel (immunostaining of lymphatic marker D2‐40). Scale bars: 1 mm (S100A4) and 50 μm (D2‐40). Data are shown as the means ± SE. *P < 0.05 (b, c and d).
Table 3.
Correlation between H‐score of S100A4 and histopathological findings in G1 cases
| Number of cases | H‐score | P‐value | |
|---|---|---|---|
| Myometrial invasion | |||
| <1/2 | 38 | 67.2 | <0.05 |
| ≧1/2 | 22 | 112.0 | |
| Lymphatic invasion | |||
| − | 47 | 74.0 | <0.05 |
| + | 13 | 118.5 | |
| MELF pattern invasion | |||
| − | 45 | 56.9 | <0.01 |
| + | 15 | 164.0 | |
The MELF histological pattern was recently described.9 The MELF pattern of myometrial invasion is associated with lymph node metastasis.10 In our study, 25% of G1 cases had a component with MELF pattern invasion (15/60 G1 cases) (Fig. 6a, Table 3). Notably, the H‐score of S100A4 in the cases with MELF pattern invasion was significantly higher than that of other cases (Fig. 6b, Table 3), suggesting that high S100A4 expression is a good indicator of EC cases with the MELF pattern.
Figure 6.
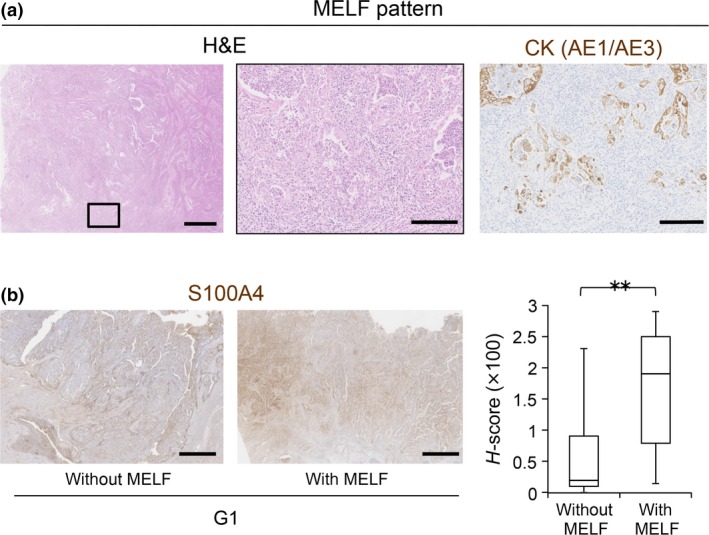
Correlation between S100A4 expression and MELF pattern invasion. (a) Representative HE‐stained images of endometrioid carcinoma (EC) with MELF pattern invasion. The boxed area in the left image is enlarged in the middle image. Representative image of immunohistochemistry for pan‐cytokeratin (AE1/AE3) is shown at the right. Scale bars: 1 mm (left) and 200 μm (middle and right). (b) S100A4 protein levels in G1 cases with (n = 15) or without (n = 45) MELF pattern invasion were compared by calculating H‐scores. Scale bars: 2 mm. Data are shown as the means ± SE. **P < 0.01.
Discussion
In this study, we showed that S100A4 plays important roles in the proliferation and invasion of EC cells by means of functional assays using S100A4‐knockout cells generated by the CRISPR/Cas9 system. Depletion of S100A4 resulted in impaired proliferation and invasive capacity, suggesting the importance of S100A4 in progressive phenotypes of EC.
Regarding the significance of S100A4 expression in EC, Xie et al.8 report that shRNA‐mediated stable S100A4‐knockdown HEC‐1A cell lines showed significantly decreased invasion, consistent with our results. However, S100A4‐knockdown clones did not show inhibited proliferation, which is inconsistent with our finding that depletion of S100A4 in HEC‐1B cells resulted in decreased proliferation. We speculate that this might be due to the difference between knockout and knockdown. In S100A4‐knockout cells generated by the CRISPR/Cas9 system, the S100A4 gene is completely disrupted, whereas in shRNA‐mediated S100A4‐knockdown cells, S100A4 transcription is severely attenuated but not completely deficient. Alternatively, the difference in proliferation may be due to the use of different cell lines (HEC‐1A vs HEC‐1B).
We showed that AKT phosphorylation was defective in S100A4‐knockout cells. AKT is activated by phosphorylation at Ser473 and Thr308,16 which leads to cell cycle progression. The defective proliferation in S100A4‐knockout cells may be due to the lack of AKT activation. S100A4 appears to regulate cancer proliferation via the AKT‐dependent pathway. Further research is required to investigate the underlying mechanisms by which S100A4 regulates the phosphorylation of AKT.
We observed that the amount of MMP2 secreted from S100A4‐knockout cells was significantly lower than that of control cells. This finding suggests that S100A4 controls the amount of secreted MMP2. This is a possible explanation for the reduced invasive capacity of S100A4‐knockout cells. Bjornland et al.17 report that in the clones of osteosarcoma cells transfected with an anti‐S100A4 ribozyme and most prominently downregulated of S100A4, the mRNA level of MMP2 was significantly reduced. This suggests that S100A4 is involved in the transcription of MMP2. Moreover, Mathisen et al.18 report that S100A4 is involved in the regulation of pro‐MMP2 activation, most likely through regulation of the TIMP‐2 and the MT1‐MMP levels. These reports suggest that S100A4 appears to regulate MMP2 in both transcriptional and post‐translational levels. Further investigation is necessary to detect the regulatory mechanism of MMP2 by S100A4 in EC.
The expression level of S100A4 was higher in well‐ to moderately‐differentiated EC (G1‐G2) than in poorly‐differentiated EC (G3) in patient‐derived EC tissues. However, Xie et al.7 report that S100A4 expression was greater in poorly‐differentiated EC than in well‐ to moderately‐differentiated EC, which is inconsistent with our data. This might be due to the difference in the number of cases (60 G1‐G2 and 27 G3 cases vs 88 G1‐G2 and 17 G3 cases) or in the antibody used for immunohistochemistry. Further careful investigation is necessary to confirm the relationship between the expression of S100A4 and histological grade.
Moreover, we observed that elevated expression of S100A4 was closely related to the presence of myometrial invasion and lymphatic invasion. In particular, strong and diffuse staining of S100A4 was detected in tissues with the MELF histological pattern, which is associated with a highly invasive histological phenotype.9, 10 These findings are consistent with the defective invasive ability in S100A4‐knockout cells. S100A4 could, thus, serve as a useful marker for invasive phenotypes of EC.
Collectively, our findings reveal that S100A4 contributes to the proliferation and invasion of EC by means of both in vitro and immunohistochemical assays on clinical samples. This is, to our knowledge, the first report that S100A4 is related to the MELF histological pattern.
Disclosure Statement
The authors have no conflict of interest to declare.
Supporting information
Fig. S1. S100A4 knockout in HEC‐1B cells using the CRISPR/Cas9 system. (a) Schematic of the single‐guide (sg) RNA‐targeting sites in the human S100A4 gene. Two targeting sequences were used in this study: sgRNA1 and sgRNA2. Protospacer adjacent motifs (PAM) are indicated by the box. (b) Genomic sequence alignment of the wild‐type S100A4 gene and the disrupted alleles from S100A4‐knockout clones KO1 and KO2. Del X, deletion of X nucleotides; ins X, insertion of X nucleotides.
Fig. S2. Correlation between S100A4 and P‐AKT expression. Representative image of immunohistochemistry for S100A4 and P‐AKT. Scale bars: 100 μm.
Acknowledgments
We thank Ms Yoko Tsuruta, Ms Etsuko Maeno, Ms Takako Sawamura and Mr Masaharu Kohara for their technical assistance. We also thank Dr Kazuaki Takafuji and Professor Seiji Takashima for performing shotgun proteomics.
Cancer Sci 107 (2016) 1345–1352
Funding Information
This work was supported in part by the Ministry of Education, Culture, Sports, Science and Technology, Japan (T264604700, T254604350, T15K084230 and T15K083630).
References
- 1. Ginestier C, Hur MH, Charafe‐Jauffret E et al ALDH1 is a marker of normal and malignant human mammary stem cells and a predictor of poor clinical outcome. Cell Stem Cell 2007; 1: 555–67. [DOI] [PMC free article] [PubMed] [Google Scholar]
- 2. Rahadiani N, Ikeda J, Mamat S et al Expression of aldehyde dehydrogenase 1 (ALDH1) in endometrioid adenocarcinoma and its clinical implications. Cancer Sci 2011; 102: 903–8. [DOI] [PubMed] [Google Scholar]
- 3. Boye K, Maelandsmo GM. S100A4 and metastasis: a small actor playing many roles. Am J Pathol 2010; 176: 528–35. [DOI] [PMC free article] [PubMed] [Google Scholar]
- 4. EL Naaman C, Grum‐Schwensen B, Mansouri A et al Cancer predisposition in mice deficient for the metastasis‐associated Mts1 (S100A4) gene. Oncogene 2004; 23: 3670–80. [DOI] [PubMed] [Google Scholar]
- 5. Zhang J, Zhang DL, Jiao XL et al S100A4 regulates migration and invasion in hepatocellular carcinoma HepG2 cells via NF‐kappaB‐dependent MMP‐9 signal. Eur Rev Med Pharmacol Sci 2013; 17: 2372–82. [PubMed] [Google Scholar]
- 6. Saleem M, Kweon MH, Johnson JJ et al S100A4 accelerates tumorigenesis and invasion of human prostate cancer through the transcriptional regulation of matrix metalloproteinase 9. Proc Natl Acad Sci USA 2006; 103: 14825–30. [DOI] [PMC free article] [PubMed] [Google Scholar]
- 7. Xie R, Loose DS, Shipley GL et al Hypomethylation‐induced expression of S100A4 in endometrial carcinoma. Mod Pathol 2007; 20: 1045–54. [DOI] [PubMed] [Google Scholar]
- 8. Xie R, Schlumbrecht MP, Shipley GL et al S100A4 mediates endometrial cancer invasion and is a target of TGF‐beta1 signaling. Lab Invest 2009; 89: 937–47. [DOI] [PMC free article] [PubMed] [Google Scholar]
- 9. Murray SK, Young RH, Scully RE. Unusual epithelial and stromal changes in myoinvasive endometrioid adenocarcinoma: a study of their frequency, associated diagnostic problems, and prognostic significance. Int J Gynecol Pathol 2003; 22: 324–33. [DOI] [PubMed] [Google Scholar]
- 10. Pavlakis K, Messini I, Vrekoussis T et al MELF invasion in endometrial cancer as a risk factor for lymph node metastasis. Histopathology 2011; 58: 966–73. [DOI] [PubMed] [Google Scholar]
- 11. Hirsch FR, Varella‐Garcia M, Bunn PA et al Epidermal growth factor receptor in non‐small‐cell lung carcinomas: correlation between gene copy number and protein expression and impact on prognosis. J Clin Oncol 2003; 21: 3798–807. [DOI] [PubMed] [Google Scholar]
- 12. John T, Liu G, Tsao MS. Overview of molecular testing in non‐small‐cell lung cancer: mutational analysis, gene copy number, protein expression and other biomarkers of EGFR for the prediction of response to tyrosine kinase inhibitors. Oncogene 2009; 28(Suppl. 1): S14–23. [DOI] [PubMed] [Google Scholar]
- 13. Cong L, Ran FA, Cox D et al Multiplex genome engineering using CRISPR/Cas systems. Science 2013; 339: 819–23. [DOI] [PMC free article] [PubMed] [Google Scholar]
- 14. Roy R, Yang J, Moses MA. Matrix metalloproteinases as novel biomarkers and potential therapeutic targets in human cancer. J Clin Oncol 2009; 27: 5287–97. [DOI] [PMC free article] [PubMed] [Google Scholar]
- 15. Toth M, Sohail A, Fridman R. Assessment of gelatinases (MMP‐2 and MMP‐9) by gelatin zymography. Methods Mol Biol 2012; 878: 121–35. [DOI] [PubMed] [Google Scholar]
- 16. Franke TF, Yang SI, Chan TO et al The protein kinase encoded by the Akt proto‐oncogene is a target of the PDGF‐activated phosphatidylinositol 3‐kinase. Cell 1995; 81: 727–36. [DOI] [PubMed] [Google Scholar]
- 17. Bjornland K, Winberg JO, Odegaard OT et al S100A4 involvement in metastasis: deregulation of matrix metalloproteinases and tissue inhibitors of matrix metalloproteinases in osteosarcoma cells transfected with an anti‐S100A4 ribozyme. Cancer Res 1999; 59: 4702–8. [PubMed] [Google Scholar]
- 18. Mathisen B, Lindstad RI, Hansen J et al S100A4 regulates membrane induced activation of matrix metalloproteinase‐2 in osteosarcoma cells. Clin Exp Metastasis 2003; 20: 701–11. [DOI] [PubMed] [Google Scholar]
Associated Data
This section collects any data citations, data availability statements, or supplementary materials included in this article.
Supplementary Materials
Fig. S1. S100A4 knockout in HEC‐1B cells using the CRISPR/Cas9 system. (a) Schematic of the single‐guide (sg) RNA‐targeting sites in the human S100A4 gene. Two targeting sequences were used in this study: sgRNA1 and sgRNA2. Protospacer adjacent motifs (PAM) are indicated by the box. (b) Genomic sequence alignment of the wild‐type S100A4 gene and the disrupted alleles from S100A4‐knockout clones KO1 and KO2. Del X, deletion of X nucleotides; ins X, insertion of X nucleotides.
Fig. S2. Correlation between S100A4 and P‐AKT expression. Representative image of immunohistochemistry for S100A4 and P‐AKT. Scale bars: 100 μm.


