

Abstract
Objective
To examine the relationship between endogenous serum estradiol and vitamin D–binding protein (DBP) and total, free, and bioavailable 25-hydroxyvitamin D (25OHD) concentrations in pre- and postmenopausal women.
Methods
In 165 healthy women (ages, 26 to 75 years) not taking any form of exogenous estrogen, the serum concentrations of estradiol, 25OHD, DBP, parathyroid hormone, and albumin were measured. Free and bioavailable 25OHD (free + albumin-bound) levels were calculated from total 25OHD, DBP, and serum albumin levels.
Results
Premenopausal women had higher serum 25OHD (31.5 ± 7.9 ng/mL), DBP (45.3 ± 6.2 mg/dL), and estradiol (52.8 ± 35.0 pg/mL) levels than postmenopausal women (26.5 ± 4.9 ng/mL, 41.7 ± 5.7 mg/dL, and 12.9 ± 4.9 pg/mL), respectively. In addition, the calculated free and bioavailable 25OHD levels were higher in pre- than postmenopausal women (P<.05). Serum estradiol correlated with DBP (r = 0.22; P<.01) and total 25OHD (r = 0.27; P<.01). In multivariate regression models (with or without serum 25OHD), estradiol was independently associated with DBP (P<.05).
Conclusion
Lower estradiol level is one of the factors that contribute to lower DBP levels in older women. Our data indicate that besides well-known factors such as age, gender, and race, serum estradiol concentrations are also a physiologic predictor of DBP concentration.
INTRODUCTION
Vitamin D deficiency is common in the general population (1,2). Main causes are represented by insufficient dietary intake and variations in sun exposure (3,4). Age, body weight, ethnicity (5,6), genetic polymorphisms (7), and vitamin D–binding protein (DBP) levels (8) also influence vitamin D status. Serum 25-hydroxyvitamin D (25OHD) concentrations are a good estimate to assess vitamin D status due to the relatively long plasma half-life (approximately 15 days) of 25OHD and lack of hormonal control of hepatic 25-hydroxylase (9).
However, serum DBP concentrations and the free fraction of 25OHD may also help in assessing vitamin D status. The free hormone hypothesis states that protein-bound hormones are relatively inactive, whereas hormones not bound to binding proteins are available to exert biologic activity (10). DBP binds 85 to 90% of 25OHD in the circulation, whereas albumin binds 10 to 15%, and only a very small fraction (<0.1%) circulates in its free form (8). DBP protects vitamin D metabolites from hydroxylase-mediated catabolism, affects their cellular uptake, and modulates their biologic activity. It is assumed that serum DBP concentrations (much higher than that of its ligands) and binding properties would affect serum free metabolite concentrations (11).
Hepatic synthesis and circulating concentrations of other steroid hormone–binding globulins, such as sex hormone–binding globulin (SHBG) or thyroxine-binding globulin, increase with estrogenic therapy, including hormone replacement therapy or oral contraceptive use (12,13). Similarly, the use of exogenous estrogen increases hepatic DBP synthesis and raises serum concentrations (14,15). In addition, there are high serum DBP concentrations in pregnancy, attributed to an estrogen-mediated increase in synthesis (16,17). There are also higher serum DBP concentrations in obese compared to normal-weight premenopausal women, and although it has been speculated that this may be due to elevated serum estrogen levels, it was not measured in this study (18). The higher serum DBP levels in women compared to men also underscore a role for estrogen in regulating serum DBP concentrations (19). Besides pregnancy, no other physiologic condition associated with changes in estrogen levels has been shown to affect circulating DBP. In this study, we examined whether estrogen concentration in pre- and postmenopausal women influences the relationship between DBP, total 25OHD, and calculated free and bioavailable 25OHD concentrations.
METHODS
Subjects
A retrospective cross-sectional analysis was conducted in healthy, pre- and postmenopausal women (body mass index [BMI] range, 22 to 35 kg/m2; age range, 26 to 75 years). Subjects were recruited at Rutgers University following local newspaper, electronic, and radio station advertisements during winter months. Women who were taking medication or had a disease state known to influence bone metabolism (i.e., cancer or diabetes) were excluded. In addition, premenopausal women were included if they had a history of a regular menstrual cycle, did not use oral contraceptives, and were not pregnant or lactating within the previous year. Postmenopausal women who were at least 2 years since menopause and not on hormone replacement therapy were included. Subjects had to be weight-stable (±5% of body weight) for the previous 3 months prior to the study. The protocols were approved by the Institutional Review Board of Rutgers University (New Brunswick, NJ), and all subjects provided written informed consent before any study procedure was performed.
Study Design
Volunteers underwent a multistep screening process including telephone, biochemical, and physical screening to ensure they met eligibility criteria. After passing all of the screening steps, participants were asked to stop taking any dietary supplements for at least 4 weeks before the measurements were conducted and were given a standard daily multivitamin/mineral supplement containing 200 mg calcium and 400 IU of vitamin D. In addition, calcium intake (dietary plus supplements) was adjusted to meet the recommendations of 1,000 to 1,200 mg/day.
Laboratory Analyses
After a 12-hour overnight fast, venous blood was taken from each participant in the study. Serum samples were analyzed in duplicate for the following hormones: 25OHD (radioimmunoassay, RIA; DiaSorin, Stillwater, MN; coefficient of variation [CV], <12.5%), intact parathyroid hormone (PTH) (immunoradioassay, IRMA; Scantibodies, Santee, CA; CV, <6.8%), and ultrasensitive estradiol (E2) (RIA; DSL, Webster, TX; CV, <8.9%). The laboratory uses both internal and external standards and also participates in the international Vitamin D External Quality Assessment Scheme to ensure quality and accuracy of 25OHD analyses. Calcium and albumin concentrations were measured using colorimetric assays on an automated analyzer. Concentrations of serum DBP were determined using a commercial enzyme-linked immunosorbent assay kit (ALPCO, Salem, NH). Concentrations of DBP were interpolated from a standard curve after measuring absorbance on an Elx808 plate reader using Gen5 data analysis software (BioTek Instruments, Inc). The intra- and interassay CVs for this assay were 5.0 and 12.7%, respectively. The published normal reference range for DBP concentrations (7) is 300 to 600 μg/mL (30 to 60 mg/dL).
Calculations
Free, bioavailable, and DBP-bound 25OHD concentrations were calculated using an adapted algorithm previously described (20). This algorithm has been validated for calculation of free and bioavailable testosterone based on measured amounts of serum total testosterone, SHBG, and albumin and application of the known binding-affinity constants of testosterone for albumin and SHBG. The method defines bioavailable hormone as the fraction that is both free and albumin-bound, that is, the fraction not bound to circulating binding proteins, such as DBP. In this study, the equations were adapted by replacing the variables for testosterone, SHBG, and albumin and their respective binding constants with those of 25OHD, DBP, and albumin (8,21). The formulas used to calculate free and bioavailable 25OHD are shown below:
[Total] = concentration of 25OHD in g/mole ÷ 400.5 g/mole
[Alb] = serum albumin concentration in g/L ÷ 66,430 g/mole
[Total DBP] = concentration of serum DBP in g/L ÷ 58,000 g/mole
[D] = {[Total] – (Kalb · [Alb] +1) · [D]} ÷ KDBP ÷ ([Total DBP] – {[Total] – (Kalb · [Alb] +1) · [D]})
[Bio] = [D] + [Dalb] = (Kalb · [Alb] + 1) · [D], where
[Total] = Total 25OHD; [D] = free vitamin D; [Bio] = bioavailable vitamin D; Kalb = affinity constant between vitamin D and albumin = 6 × 10⁵ M−1; KDBP = affinity constant between vitamin D and DBP = 0.7 × 10⁹ M−1.
Statistical Analysis
Analyses were conducted using the SAS statistical package (SAS Institute, Cary, NC; v 9.3). Differences between groups were examined with one-way analysis of variance (ANOVA). Race distribution between groups was examined with chi-square analysis. Pearson’s correlation coefficients were used to assess relationships between variables. To determine if serum 25OHD concentrations and menopausal status (pre- and postmenopausal) influence the relationship between estrogen and DBP, participants were stratified into 2 serum-25OHD groups: below (<27 ng/mL) and above (≥27 ng/mL) the median. A two-way ANOVA testing the interaction between 25OHD group and menopausal status on serum markers was conducted. When the F ratio was significant, Tukey’s post-hoc analysis was performed. The association between various factors and serum DBP and 25OHD concentrations was tested using multiple regression models. Due to the strong association between age and estrogen levels, their influence on the variation of DBP was tested in separate regression models. Values are reported as mean and SD, and significance was considered at a P value of less than .05.
RESULTS
Characteristics of study participants are shown in Table 1. A total of 165 women were included in the study, and 149 (90%) of the women were Caucasian. Serum DBP concentrations ranged from 20.4 to 54.6 mg/dL, with mean of 42.8 ± 6.1 mg/dL, and values were lower in post- than in premenopausal women (P<.001). Serum 25OHD concentrations ranged from 15.0 to 53.6 ng/mL, with mean of 27.2±6.7 ng/mL and were lower in post- than in premenopausal women (P<.001). In addition, postmenopausal women had lower calculated free and bioavailable 25OHD concentrations when compared to premenopausal women (P<.05). There was a trend for the 25OHD:DBP ratio to be lower in the post- than premenopausal women (P<.08). As expected, bioavailable 25OHD concentrations were approximately 250-fold higher than free 25OHD concentrations in the entire sample. Also as expected, serum estradiol concentrations were lower in postmenopausal than premenopausal women (P<.001) (Table 1). BMI, race, and serum PTH and calcium concentrations were similar between the groups.
Table 1.
Baseline Characteristics of Study Participants (N = 165)a
| Premenopausal n = 49 |
Postmenopausal n = 116 |
P value | |
|---|---|---|---|
| Age (years) | 39.2 ± 6.1 | 59.2 ± 5.8 | <.001 |
| Body mass index (kg/m2) | 28.0 ± 2.1 | 28.6 ± 2.6 | NS |
| Race: Caucasian/non-Caucasian (%) | 7/42 (86%) | 9/107 (92%) | NS |
| Vitamin D binding protein (mg/dL) | 45.3 ± 6.2 | 41.6 ± 5.7 | <.001 |
| Albumin (g/dL) | 4.5 ± 0.2 | 4.5 ± 0.2 | NS |
| Calcium (mg/dL) | 9.5 ± 0.3 | 9.4 ± 0.5 | NS |
| PTH (pg/mL) | 36.8 ± 19.4 | 35.9 ± 14.6 | NS |
| Estradiol (pg/mL) | 52.8 ± 40.7 | 12.9 ± 4.9 | <.001 |
| Total 25OHD (ng/mL) | 31.5 ± 7.9 | 26.5 ± 4.9 | <.001 |
| DBP-bound 25OHD (ng/dL) | 29.5 ± 7.5 | 24.7 ± 4.5 | <.001 |
| Albumin-bound 25OHD (ng/dL) | 1.9 ± 0.4 | 1.7 ± 0.4 | .026 |
| Free 25OHD (pg/dL) | 4.8 ± 1.2 | 4.4 ± 1.1 | .048 |
| Bioavailable 25OHD (ng/dL) | 1.9 ± 0.5 | 1.7 ± 0.4 | .025 |
| 25OHD/DBP | 0.7 ± 0.2 | 0.6 ± 0.1 | .079 |
Abbreviations: 25OHD = 25-hydroxyvitamin D; BMI = body mass index; DBP = vitamin D–binding protein; PTH = parathyroid hormone.
All values are mean ± SD. One-way analysis of variance was performed for differences between groups.
Age correlated with serum DBP concentrations (r = −0.29; P<.0001); however, there was no correlation observed between BMI and serum DBP concentrations. Total 25OHD concentrations were positively correlated with DBP concentrations (r = 0.30, P<.0001). An inverse relationship between PTH concentration and total 25OHD, free 25OHD, and bioavailable 25OHD (P<.01) was observed. Serum estradiol was positively correlated with total 25OHD concentration and DBP concentration (P<.05) (Table 2).
Table 2.
Pearson’s Correlations Between Vitamin D–Binding Protein, 25-Hydroxyvitamin D, and Other Variables (n = 165)a
| Variable | BMI | Estradiol | 25OHD | DBP | Free 25OHD | Bioavailable 25OHD |
|---|---|---|---|---|---|---|
| Age | 0.149b | −0.478d | −0.221d | −0.276d | NSe | NS |
| BMI | – | NS | NS | NS | NS | NS |
| Albumin | NS | NS | NS | 0.131b | NS | NS |
| Calcium | NS | NS | NS | NS | NS | |
| Estradiol | – | 0.273d | 0.222d | NS | 0.126b | |
| PTH | −0.205d | NS | −0.163c | −0.167c | ||
| 25OHD | – | −0.302d | 0.753d | 0.769d | ||
| DBP | – | −0.387d | −0.350d | |||
| Free 25OHD | – | 0.984d |
Abbreviations: 25OHD = 25-hydroxyvitamin D; BMI = body mass index; DBP = vitamin D–binding protein; PTH = parathyroid hormone.
Data are presented as r.
P<.08.
P<.05.
P<.01.
NS, P>.10.
Multivariate linear regression models were constructed to assess factors associated with serum 25OHD and DBP concentrations. A model including E2, 25OHD, PTH, and BMI (model 1), explained 10% (model R2) of the variation in serum DBP concentration. When age was used in a second model (model 2), it explained 13% of the variation in serum DBP concentration (Table 3).
Table 3.
Factors Associated With Serum DBP Concentrations Examined by Multiple Linear Regressions (n = 165)
| Serum DBP concentrations | β | P value | Partial R2 |
|---|---|---|---|
| Model 1 | |||
| E2 | 0.156 | .047 | 0.02 |
| 25OHD | 0.239 | .003 | 0.08 |
| PTH | 0.010 | NS | 0.00 |
| Model 2 | |||
| Age | −0.220 | .004 | 0.08 |
| BMI | −0.032 | NS | 0.001 |
| 25OHD | 0.233 | .002 | 0.05 |
Abbreviations: 25OHD = 25-hydroxyvitamin D; BMI = body mass index; DBP = vitamin D–binding protein; E2 = estradiol; PTH = parathyroid hormone.
The mean serum 25OHD concentration in women below the median was 23.3 ± 2.6 ng/mL, compared to 32.8 ± 5.4 ng/mL in women above the median (P<.001). In premenopausal women, serum DBP and estradiol concentrations were higher in women above the median for 25OHD compared to those below (P<.01) (Fig. 1). Serum DBP and estradiol did not differ significantly between the two 25OHD groups in postmenopausal women (Fig. 1).
Fig. 1.
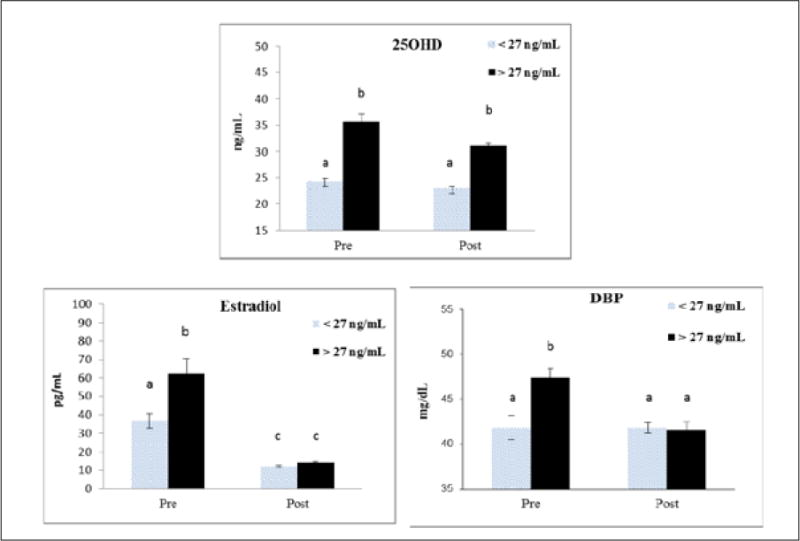
Serum 25-hydroxyvitamin D (25OHD), vitamin D–binding protein (DBP), and estradiol concentrations grouped above and below the median of 25OHD (27 ng/mL) for the entire population. Groups include premenopausal (<27 ng/mL, n = 18; >27 ng/mL, n = 31) and postmenopausal (<27 ng/mL, n = 65; >27 ng/mL, n = 51) women. Different superscripts indicate means differ significantly, P<.05.
DISCUSSION
Vitamin D deficiency or insufficiency and related diseases are prevalent in postmenopausal women (1). Vitamin D status in older women is influenced by a decline of renal function with aging, greater adiposity, poor sunlight exposure, and/or lower dietary vitamin D intake (2–4). In addition, availability of serum 25OHD and its metabolites are regulated by DBP (11). Studies have reported a positive correlation between serum 25OHD concentrations and DBP levels (19,22). Furthermore, serum 25OHD concentrations are higher in women on oral contraceptives and women who receive hormone replacement therapy (23–25). Our study shows that there is a positive correlation between DBP and serum total, free, and bioavailable 25OHD concentrations and that endogenous estrogen concentration is a predictor of serum DBP concentration. Additionally, these vitamin D metabolites were lower in postmenopausal women compared to premenopausal women. However, most agree that DBP concentrations do not seem to be influenced by vitamin D sterols or other calciotropic hormones (26) and that other factors are involved.
The serum 25OHD concentration was 18% lower in postmenopausal women, yet the free 25OHD concentration was only a 9% lower, and this might represent an adjustment to ensure there is adequate free or bioavailable hormone for target cells. The free metabolite may more closely reflect the biologic activity, as it is available to bind to the receptor, and only the free 25OHD is converted to active 1,25-dihydroxyvitamin D (1,25[OH]2D) (17). Physiologic changes that may influence circulating DBP, such as decreased estrogen production during menopause, could therefore be influencing the relationship between total and free 25OHD.
In this study, we show that serum DBP concentrations are lower in post- than premenopausal women. Others have shown that DBP concentrations are lower in males than in females (27), which could potentially be attributed to differences in estrogen status. In addition, high estrogen status, such as during hormonal replacement therapy, oral contraceptive use, and pregnancy (14–16), is associated with high serum DBP concentrations. The higher DBP in pregnancy may be associated with lower binding affinity to its metabolites so that free metabolite concentrations remain stable (28). Similarly, the concomitant decrease in serum DBP and 25OHD concentrations with estrogen deficiency might reflect a physiologic adaptation to maintain free 25OHD concentrations. Alternatively, lower 25OHD may act as compensatory mechanism to lower DBP synthesis in the liver and maintain free concentrations of 25OHD and other vitamin D metabolites in the serum of postmenopausal women. However, there is no feedback mechanism for DBP, and large increases in serum 25OHD due to vitamin D supplementation do not alter DBP levels (29). Our findings suggest that higher estradiol concentrations predict higher DBP. Not all women with higher 25OHD showed higher DBP, and only premenopausal women with higher estradiol showed an elevated serum DBP. This may suggest that the interaction between estrogen and 25OHD concentrations on DBP concentrations is menopausal-status dependent. However, a more likely explanation is that serum estradiol above a certain concentration, or threshold, is needed to influence DBP concentration, whereas age might be an independent factor affecting DBP. This could explain why DBP concentrations were not higher in pre- than postmenopausal women when serum estradiol was below 40 pg/mL (Fig. 1). The influence of higher serum estradiol concentrations needed to raise DBP is supported by estrogen administration studies and during pregnancy (14,24,25,30).
We did not find a relationship between BMI and DBP concentration in this study, and this is consistent with the findings of others (19,31); however, concentrations of DBP have been reported to be higher in obese compared to normal-weight subjects (18,32). Because the relationship between fat mass and serum DBP concentration was not consistent in these studies, it suggests that other factors may explain higher DBP concentrations in the obese. Among those factors, polymorphisms within the GC gene (which encodes for DBP) may play a role in DBP concentrations at higher body weights (33). Also, racial differences in GC gene polymorphisms account for a greater proportion of the variation in total 25OHD concentrations than most factors known to be associated with 25OHD concentrations (21). However, in our primarily Caucasian population, there was no difference in race distribution between pre- and postmenopausal women, and these types of large genetic differences are unlikely to have played a role in the lower serum 25OHD and DBP concentrations in the estrogen-deficient women.
In this population, age correlated with 25OHD and DBP concentrations, supporting a strong body of evidence indicating there is a decline in total 25OHD concentration with aging. However, in studies that examined aging from early to late menopause over a few decades, there was no change in DBP concentration, despite a decrease in free 1,25(OH)2D (34). These data would suggest that when there is no change in endogenous estrogen level, serum DBP concentrations might remain stable with aging.
This study showed that serum PTH was not associated with DBP concentrations in healthy women. This is not surprising, as in our previous study, only those women with hyperparathyroidism showed a lower DBP as compared to healthy women (35). As expected, there was an inverse association between PTH and total 25OHD. In addition, there was a weak inverse relationship between PTH and both free and bioavailable 25OHD, as has been shown by others (36). Also, a recent report showed a relationship between directly measured free 25OHD concentrations and PTH but not between calculated free 25OHD and PTH (17).
The potential limitations of the study are the relatively small sample size and that we did not examine additional estrogen and vitamin D metabolites that might further establish the influence of DBP. Moreover, calculated free serum 25OHD levels may vary from direct 25OHD measurements (17). Also, differences in DBP binding affinity may be influenced by estrogen levels, which would contribute to estimation errors of free 25OHD. Genetic variation within the GC gene may also be differentially regulated by estrogen levels and because the population examined was primarily Caucasian, these findings should be addressed in other racial groups.
CONCLUSION
In conclusion, serum 25OHD, DBP, and DBP-bound 25OHD concentrations were lower in postmenopausal women compared to premenopausal women. The lower estrogen level in postmenopausal women is one of the contributing factors to the low DBP concentrations in these women. Estrogen concentrations also affect circulating DBP concentrations in premenopausal women and could therefore be influencing the relationship between total and free 25OHD independent of menopausal status or age.
Acknowledgments
We thank Elhaam Bandali for her assistance with data management. Funding was provided by the National Institutes of Health-AG12161 and in part by N.J.A.E.S.-0153866 to S.A.S.
Abbreviations
- 25OHD
25-hydroxyvitamin D
- BMI
body mass index
- CV
coefficient of variation
- DBP
vitamin D–binding protein
- PTH
parathyroid hormone
- SHBG
sex hormone–binding globulin
Footnotes
DISCLOSURE
The authors have no multiplicity of interest to disclose.
References
- 1.Looker AC, Johnson CL, Lacher DA, Pfeiffer CM, Schleicher RL, Sempos CT. Vitamin D status: United States, 2001–2006. NCHS Data Brief. 2011;59:1–8. [PubMed] [Google Scholar]
- 2.Rosen CJ. Clinical practice. Vitamin D insufficiency. N Engl J Med. 2011;364:248–254. doi: 10.1056/NEJMcp1009570. [DOI] [PubMed] [Google Scholar]
- 3.Ross AC, Manson JE, Abrams SA, et al. The 2011 report on dietary reference intakes for calcium and vitamin D from the Institute of Medicine: what clinicians need to know. J Clin Endocrinol Metab. 2011;96:53–58. doi: 10.1210/jc.2010-2704. [DOI] [PMC free article] [PubMed] [Google Scholar]
- 4.Holick MF. Sunlight, ultraviolet radiation, vitamin D and skin cancer: how much sunlight do we need? Adv Exp Med Biol. 2014;810:1–16. [PubMed] [Google Scholar]
- 5.Snijder MB, van Dam RM, Visser M, et al. Adiposity in relation to vitamin D status and parathyroid hormone levels: a population-based study in older men and women. J Clin Endocrinol Metab. 2005;90:4119–4123. doi: 10.1210/jc.2005-0216. [DOI] [PubMed] [Google Scholar]
- 6.Chan J, Jaceldo-Siegl K, Fraser GE. Determinants of serum 25 hydroxyvitamin D levels in a nationwide cohort of blacks and non-Hispanic whites. Cancer Causes Control. 2010;21:501–511. doi: 10.1007/s10552-009-9481-1. [DOI] [PMC free article] [PubMed] [Google Scholar]
- 7.Ahn J, Yu K, Stolzenberg-Solomon R, et al. Genome-wide association study of circulating vitamin D levels. Hum Mol Genet. 2010;19:2739–2745. doi: 10.1093/hmg/ddq155. [DOI] [PMC free article] [PubMed] [Google Scholar]
- 8.Bikle DD, Gee E, Halloran B, Kowalski MA, Ryzen E, Haddad JG. Assessment of the free fraction of 25-hydroxyvitamin D in serum and its regulation by albumin and the vitamin D-binding protein. J Clin Endocrinol Metab. 1986;63:954–959. doi: 10.1210/jcem-63-4-954. [DOI] [PubMed] [Google Scholar]
- 9.Jones KS, Assar S, Harnpanich D, et al. 25(OH)D2 half-life is shorter than 25(OH)D3 half-life and is influenced by DBP concentration and genotype. J Clin Endocrinol Metab. 2014;99:3373–3381. doi: 10.1210/jc.2014-1714. [DOI] [PMC free article] [PubMed] [Google Scholar]
- 10.Mendel CM. The free hormone hypothesis: a physiologically based mathematical model. Endocr Rev. 1989;10:232–274. doi: 10.1210/edrv-10-3-232. [DOI] [PubMed] [Google Scholar]
- 11.Bouillon R. The vitamin D binding protein DBP. In: Feldman D, Pike JW, Adams JS, editors. Vitamin D. 3rd. San Diego, CA: Academic Press; 2011. pp. 57–72. [Google Scholar]
- 12.Wu F, Ames R, Evans MC, France JT, Reid IR. Determinants of sex hormone-binding globulin in normal postmenopausal women. Clin Endocrinol (Oxf) 2001;54:81–87. doi: 10.1046/j.1365-2265.2001.01183.x. [DOI] [PubMed] [Google Scholar]
- 13.Utiger RD. Estrogen, thyroxine binding in serum, and thyroxine therapy. N Engl J Med. 2001;344:1784–1785. doi: 10.1056/NEJM200106073442310. [DOI] [PubMed] [Google Scholar]
- 14.Rejnmark L, Lauridsen AL, Brot C, et al. Vitamin D and its binding protein Gc: long-term variability in peri-and postmenopausal women with and without hormone replacement therapy. Scand J Clin Lab Invest. 2006;66:227–238. doi: 10.1080/00365510600570623. [DOI] [PubMed] [Google Scholar]
- 15.Møller UK, Streym SV, Jensen LT. Increased plasma concentrations of vitamin D metabolites and vitamin D binding protein in women using hormonal contraceptives: a cross-sectional study. Nutrients. 2013;5:3470–3480. doi: 10.3390/nu5093470. [DOI] [PMC free article] [PubMed] [Google Scholar]
- 16.Hoogenboezem T, Degenhart HJ, de Muinck Keizer-Schrama SM, et al. Vitamin D metabolism in breast-fed infants and their mothers. Pediatr Res. 1989;25:623–628. doi: 10.1203/00006450-198906000-00014. [DOI] [PubMed] [Google Scholar]
- 17.Schwartz JB, Lai J, Lizaola B, et al. A comparison of measured and calculated free 25(OH) vitamin D levels in clinical populations. J Clin Endocrinol Metab. 2014;99:1631–1637. doi: 10.1210/jc.2013-3874. [DOI] [PMC free article] [PubMed] [Google Scholar]
- 18.Karlsson T, Osmancevic A, Jansson N, Hulthén L, Holmäng A, Larsson I. Increased vitamin D-binding protein and decreased free 25(OH)D in obese women of reproductive age. Eur J Nutr. 2014;53:259–267. doi: 10.1007/s00394-013-0524-8. [DOI] [PubMed] [Google Scholar]
- 19.Bolland MJ, Grey AB, Ames RW, et al. Age-, gender-, and weight-related effects on concentrations of 25-hydroxyvitamin D are not mediated by vitamin D binding protein. Clin Endocrinol. 2007;67:259–264. doi: 10.1111/j.1365-2265.2007.02873.x. [DOI] [PubMed] [Google Scholar]
- 20.Vermeulen A, Verdonck L, Kaufman JM. A critical evaluation of simple methods for the estimation of free testosterone in serum. J Clin Endocrinol Metab. 1999;84:3666–3672. doi: 10.1210/jcem.84.10.6079. [DOI] [PubMed] [Google Scholar]
- 21.Powe CE, Evans MK, Wenger J, et al. Vitamin D-binding protein and vitamin D status of black Americans and white Americans. N Engl J Med. 2013;369:1991–2000. doi: 10.1056/NEJMoa1306357. [DOI] [PMC free article] [PubMed] [Google Scholar]
- 22.Saadi HF, Nagelkerke N, Benedict S, et al. Predictors and relationships of serum 25 hydroxyvitamin D concentration with bone turnover markers, bone mineral density, and vitamin D receptor genotype in Emirati women. Bone. 2006;39:1136–1143. doi: 10.1016/j.bone.2006.05.010. [DOI] [PubMed] [Google Scholar]
- 23.Dick IM, Prince RL, Kelly JJ, Ho KK. Oestrogen effects on calcitriol levels in post-menopausal women: a comparison of oral versus transdermal administration. Clin Endocrinol (Oxf) 1995;43:219–224. doi: 10.1111/j.1365-2265.1995.tb01918.x. [DOI] [PubMed] [Google Scholar]
- 24.Harris SS, Dawson-Hughes B. The association of oral contraceptive use with plasma 25-hydroxyvitamin D levels. J Am Coll of Nutr. 1998;17:282–284. doi: 10.1080/07315724.1998.10718760. [DOI] [PubMed] [Google Scholar]
- 25.Cheema C, Grant BF, Marcus R. Effects of estrogen on circulating “free” and total 1,25-dihydroxtvitamin D and on the parathyroid-vitamin D axis in postmenopausal women. J Clin Invest. 1989;83:537–542. doi: 10.1172/JCI113915. [DOI] [PMC free article] [PubMed] [Google Scholar]
- 26.Speeckaert M, Huang G, Delanghe JR, Taes YE. Biological and clinical aspects of the vitamin D binding protein (Gc-globulin) and its polymorphism. Clin Chim Acta. 2006;372:33–42. doi: 10.1016/j.cca.2006.03.011. [DOI] [PubMed] [Google Scholar]
- 27.Blanton D, Han Z, Bierschenk L, et al. Reduced serum vitamin D-binding protein levels are associated with type 1 diabetes. Diabetes. 2011;60:2566–2570. doi: 10.2337/db11-0576. [DOI] [PMC free article] [PubMed] [Google Scholar]
- 28.Bikle DD, Gee E, Halloran B, Haddad JG. Free 1,25-dihydroxyvitamin D levels in serum from normal subjects, pregnant subjects, and subjects with liver disease. J Clin Invest. 1984;74:1966–1971. doi: 10.1172/JCI111617. [DOI] [PMC free article] [PubMed] [Google Scholar]
- 29.Ponda MP, McGee D, Breslow JL. Vitamin D-binding protein levels do not influence the effect of vitamin D repletion on serum PTH and calcium: data from a randomized, controlled trial. J Clin Endocrinol Metab. 2014;99:2494–2499. doi: 10.1210/jc.2014-1181. [DOI] [PMC free article] [PubMed] [Google Scholar]
- 30.Bouillon R, Van Assche FA, Van Baelen H, Heyns W, De Moor P. Influence of the vitamin D-binding protein on the serum concentration of 1,25-dihydroxyvitamin D3. Significance of the free 1,25-dihydroxyvitamin D3 concentration. J Clin Invest. 1981;67:589–596. doi: 10.1172/JCI110072. [DOI] [PMC free article] [PubMed] [Google Scholar]
- 31.Winters SJ, Chennubhatla R, Wang C, Miller JJ. Influence of obesity on vitamin D-binding protein and 25-hydroxy vitamin D levels in African American and white women. Metabolism. 2009;58:438–442. doi: 10.1016/j.metabol.2008.10.017. [DOI] [PubMed] [Google Scholar]
- 32.Taes YE, Goemaere S, Huang G, et al. Vitamin D binding protein, bone status and body composition in community-dwelling elderly men. Bone. 2006;38:701–707. doi: 10.1016/j.bone.2005.10.006. [DOI] [PubMed] [Google Scholar]
- 33.Jiang H, Xiong DH, Guo YF, et al. Association analysis of vitamin D-binding protein gene polymorphisms with variations of obesity-related traits in Caucasian nuclear families. Int J Obes (Lond) 2007;31:1319–1324. doi: 10.1038/sj.ijo.0803583. [DOI] [PubMed] [Google Scholar]
- 34.Prince RL, Dick I, Devine A, et al. The effects of menopause and age on calcitropic hormones: a cross-sectional study of 655 healthy women aged 35 to 90. J Bone Miner Res. 1995;10:835–842. doi: 10.1002/jbmr.5650100602. [DOI] [PubMed] [Google Scholar]
- 35.Wang X, Shapses SA, Wei S, Sukumar D, Ghosh J. Vitamin D binding protein concentrations in female patients with primary hyperparathyroidism. Endocr Pract. 2013;19:609–613. doi: 10.4158/EP12371.OR. [DOI] [PubMed] [Google Scholar]
- 36.Dastani Z, Berger C, Langsetmo L, et al. In healthy adults, biological activity of vitamin D, as assessed by serum PTH, is largely independent of DBP concentrations. J Bone Miner Res. 2014;29:494–499. doi: 10.1002/jbmr.2042. [DOI] [PubMed] [Google Scholar]