

Abstract
Aim
The goal of this study was to identify progressing periodontal sites by applying linear mixed models (LMM) to longitudinal measurements of clinical attachment loss (CAL).
Methods
Ninety‐three periodontally healthy and 236 periodontitis subjects had their CAL measured bi‐monthly for 12 months. The proportions of sites demonstrating increases in CAL from baseline above specified thresholds were calculated for each visit. The proportions of sites reversing from the progressing state were also computed. LMM were fitted for each tooth site and the predicted CAL levels used to categorize sites regarding progression or regression. The threshold for progression was established based on the model‐estimated error in predictions.
Results
Over 12 months, 21.2%, 2.8% and 0.3% of sites progressed, according to thresholds of 1, 2 and 3 mm of CAL increase. However, on average, 42.0%, 64.4% and 77.7% of progressing sites for the different thresholds reversed in subsequent visits. Conversely, 97.1%, 76.9% and 23.1% of sites classified as progressing using LMM had observed CAL increases above 1, 2 and 3 mm after 12 months, whereas mean rates of reversal were 10.6%, 30.2% and 53.0% respectively.
Conclusion
LMM accounted for several sources of error in longitudinal CAL measurement, providing an improved method for classifying progressing sites.
Keywords: clinical attachment loss, disease progression, linear mixed models, periodontal disease
For many years it was generally believed that periodontal diseases progressed linearly, i.e. with a constant, relatively slow rate of increase in clinical attachment loss (CAL). This assumption was challenged when data from longitudinal studies on untreated subjects suggested the possibility of abrupt changes in CAL, leading to the competing “burst hypothesis” of progression (Goodson et al. 1982, Haffajee et al. 1983, Socransky et al. 1984). Since then, researchers and clinicians have pursued different approaches to identify sites that are undergoing or will undergo periodontal disease progression, motivated in part by the belief that sudden changes in observed CAL data could be artefacts resulting from measurement error (Haffajee et al. 1983, Aeppli & Pihlstrom 1989, Machtei et al. 1993, Breen et al. 1999b).
Several methods have been proposed that account for CAL measurement error. Among such approaches, the tolerance method described by Haffajee et al. (1983) accounted for cross‐sectional variance in CAL measurement at the site, subject and population levels and required data from only two time points. However, a recent examination of the reproducibility of CAL measurements (Corraini et al. 2013) indicated that measurement error frequencies were too high to permit the reliable detection of CAL changes using data from only two visits, thus questioning the validity of the tolerance method. Another limitation of the tolerance method was that it did not take into account the reversibility of changes in CAL (Goodson et al. 1982, Harley et al. 1987, Jeffcoat & Reddy 1991, Breen et al. 1999a).
Studies on the reliability of longitudinal CAL measurements indicated that the cross‐sectional characterization of reproducibility of CAL may not fully account for all sources of variation in measurements of CAL over time (Espeland et al. 1991). Although methods such as linear regression analysis; running median (Haffajee et al. 1983); the cumulative sum method (Aeppli & Pihlstrom 1989); and an individualized multi‐threshold approach (Machtei et al. 1993) use data from multiple visits, they use measurements only from the subject's site to classify progression ignoring information from other sites or subjects. Thereby, they fail to take into consideration the full impact of multiple sources of variation in CAL measurements in the diagnosis of periodontal disease progression.
The goal of this study was to classify sites regarding progression of periodontal diseases by applying linear mixed models (LMM) (Laird & Ware 1982, Cnaan et al. 1997) to longitudinal CAL measurements in a population of adults with different stages of disease. LMMs are a type of linear regression model for repeated measures (i.e. CAL) that include both fixed effects (e.g. time, gender) and random effects, the latter specific to subjects and sites.
The rationale was that LMMs account for multiple sources of variation in CAL measurements and should therefore provide more accurate classification than methods that do not leverage this information.
Material and Methods
Study design
The data presented here were obtained from an ongoing prospective multicentre clinical study to search for biomarkers of periodontal disease progression. A consecutive sample of 329 participants was recruited between January 2012 and April 2015 at four centres in the United States: The Forsyth Institute (Cambridge, MA), New York University College of Dentistry (New York, NY), Southern Illinois University School of Dental Medicine (Alton, IL), and the University at Buffalo, State University of New York (Amherst, NY). Participants were examined clinically by calibrated examiners every 2 months for 12 months to monitor for periodontal disease progression based on CAL measurements. The study was approved by the Institutional Review Board at each centre prior to initiation.
Study population
The inclusion and exclusion criteria can be found in the online supporting information, further details can be obtained at ClinicalTrials.gov (https://clinicaltrials.gov/ct2/home) under the identifier NCT01489839.
Standard deviations of duplicate measures of CAL and intra‐examiner reproducibility
From 29,189 replicate site‐specific CAL measurements from the 329 participants’ baseline data, we computed the average standard deviation (SD) of CAL within each subject and across subjects. Data obtained from 16 clinical examiners based on 318,237 replicate measures across all visits were used to calculate intra‐examiner agreement.
Clinical examination
Periodontal assessments performed on each subject included up to 168 sites per subject (6 sites per tooth – mesiobuccal, buccal, distobuccal, mesiolingual, lingual and distolingual – for up to 28 teeth excluding third molars) and included: presence or absence of gingival redness and plaque; probing depth (PD); measurement of distance from the cementoenamel junction to the free gingival margin (B measure) (in case of recession, a negative value was assigned); CAL (calculated by subtracting the B measure from the PD); presence or absence of plaque, gingival redness, BOP and suppuration. PD and the B measure were measured using a North Carolina manual periodontal probe (PCPUNC 15 Hu‐Friedy Co, Chicago, IL), rounding down to the nearest millimetre and at pre‐molars and the first and second molars these variables were measured twice. CAL was calculated for each pass by the electronic data capturing (EDC) system. If the difference between the 2 measurements was ≥2 mm, the examiner was prompted by the EDC to obtain PD and the B measure a third time. The median CAL among the 2 or 3 passes was used for analysis.
Rescue therapy
Subjects with ≥6 sites with cumulative loss of attachment ≥2 mm from baseline during monitoring phase had their monitoring interrupted, and proceeded to treatment. Participants displaying ≥4 mm of CAL increase at a given site received periodontal rescue therapy at such sites and continued with monitoring. After the monitoring phase, periodontally healthy subjects received professional dental prophylaxis and exited the study, whereas participants with periodontal disease received non‐surgical mechanical periodontal therapy.
Subjects and sites included in analyses
The dataset used in this report consisted of participants who had enrolled in the study up until April 12, 2015. Participants that had their monitoring interrupted due to rescue therapy were excluded. If a subject received rescue therapy in some but not all sites, data for such sites were removed from the analysis and the subject was otherwise retained in the analysis for any remaining sites. In addition, sites with extreme variations in CAL (i.e. a difference between the minimum CAL and maximum CAL >5 mm) were also excluded.
Data analyses
The analyses proceeded in three stages: we (i) calculated the observed proportion of sites with progression and regression according to different thresholds; (ii) performed an alternating logistic regressions (ALR) implementation of the generalized estimating equations (GEE) procedure to assess whether the proportion of progressing sites changes over time and (iii) applied LMMs to predict subject‐specific trends in CAL for each site and from which classifications of progression and regression were made. Statistical significance was defined as p < 0.05 throughout. All statistical analyses were conducted using SAS® software.
Stage 1 – The observed proportion of sites with changes in CAL from the baseline values greater or equal to 1, 2 and 3 mm, respectively, were summarized for every visit in each clinical group separately. In addition, we also summarized the proportion of progressed sites with reversals at the subsequent visit (i.e. being progressed a visit j, and then not‐progressed at visit j + 1). For these calculations, missing data points in the observed CAL measurements were imputed by LOCF (last‐observation‐carried‐forward) from the previous visit. In contrast, all LMMs and the GEE analysis described below were conducted without imputation of missing data points.
Stage 2 – The ALR (Carey et al. 1993) implementation of GEE for population‐averaged modelling was performed using all the sites simultaneously to assess whether the population‐averaged proportions of observed CAL increases ≥1 mm from baseline to 2, 4, 6, 8, 10 and 12 months changed over time, while adjusting for disease cohort (healthy, mild, severe). For additional details on this model refer to the online supplementary appendix.
Stage 3 – For each of the 168 tooth sites, a separate linear mixed effects model (Laird & Ware 1982, Holditch‐Davis et al. 1998) with a cubic polynomial for time (months) was fitted to quantify the course of progression within individuals. Specifically, the model for CALit, the value of attachment loss from the ith subject at time = t (for t = 0, 2, 4, 6, 8, 10 or 12 months) is
The model includes fixed effects for age, gender (with males as the reference group), time, time‐squared and time‐cubed, the two‐way interactions age by time and gender by time, mean baseline CAL for the subject (bCALi) and its square, as well as the interaction of bCALi and (linear) time. The fixed effects and their parameters β 0,…,β 10, define the population‐averaged regression. This is a fairly rich model for fixed effects with respect to inclusion of polynomial and interaction terms. The rationale was to account for between‐subject variability and thereby reduce error in the prediction of subject‐specific trends, which in turn should improve accuracy of classification of within‐subject change. To this end, the model additionally includes random effects b0i, b1i and b2i for subjects, time and time‐squared respectively; these and the random error term ε ij, are independent and normally distributed with unknown variances. The random effects component for each subject is the difference between the subject's regression and the population‐averaged regression (the latter determined from fixed effects). This random effects component is a measure of how progression of periodontal disease at the site for each subject systematically differs from the typical course of progression in the whole population after accounting for age, gender and baseline CAL. Furthermore, each tooth site of each subject has his or her own regression curve for CAL given by the sum of the fixed effects and random effects components. From the subject‐specific curves generated from the regression models (one model per site), predicted values of CAL were computed at baseline and at 2, 4, 6, 8, 10 and 12 months for each site and person. Model assessment was based on the Predicted Residual Error Sum of Squares (PRESS) residual e(i)t, which is the difference between observed and predicted CAL from the i‐th subject at the t‐th visit based on the fit of the model that leaves out that subject. The prediction accuracy of the LMM for each site was calculated using two summaries of PRESS residuals, the PRESS statistic (Liu et al. 1999) and the Sum of Absolute Predicted Residual Errors, each divided by the total number of observations across all subjects and visits for the site. These statistics enable identification of sites where prediction of CAL is best and where it is poorest (for additional details, see online supplementary material).
We developed a threshold for progression empirically based on the prediction standard errors from a second series of LMMs (again, one per site) fitted to ΔCALit, which is the change in CAL value from baseline to time = t (for t = 2, 4, 6, 8, 10 or 12 months) for subject i. These models are identical to the models described above, except that the outcome is ΔCALij. The threshold for change was based on the 75th percentile of the distribution of the standard errors for subject‐specific predicted ΔCALij. Sites were then classified as progressing based on the predictions from the first series of LMMs using the threshold established from the second series. In particular, considering that the half‐width of a 95% prediction interval for predicted ∆CAL is 1.96Q75 (mm), we grouped sites based on changes in pCAL (ΔpCAL) into: (i) regressing sites (ΔpCAL <−2Q75); (ii) stable sites (−2Q75 ≤ΔpCAL ≤2Q75 mm); (iii) intermediate sites (2Q75 <ΔpCAL <4Q75 mm) and (iv) progressing sites (ΔpCAL ≥4Q75) (for additional details on this model, see online supplementary material). The high threshold of 4Q75 for progression was motivated by the desire for high specificity in the classification of progression of periodontitis potentially at the expense of lower sensitivity.
To show the effect of classification of sites based upon LMM prediction, the mean observed and predicted CAL values were calculated at each visit across all sites and subjects within each category of disease progression. In addition, the observed proportion of sites with changes in observed CAL from the baseline values greater or equal to 1, 2 and 3 mm, respectively, were summarized for every visit in each site category of progression. We also summarized the proportion of progressed sites with reversals at the subsequent visit. To illustrate further the fluctuation of CAL over time for individual sites and the smoothing effect of the LMM on the profile of longitudinal changes in CAL measurements, we selected a participant (subject X) with a large number of sites (n = 30) with increase in CAL ≥2 mm from baseline to 12 months. The observed and estimated values for CAL over time and the longitudinal changes in CAL were then plotted for every progressing site.
Results
Out of the 533 participants who attended a baseline visit, 51 subjects had their monitoring interrupted due to rescue therapy, whereas 350 had already completed the 12‐month monitoring (Fig. 1). Out of these, 21 were excluded because of a change in examiner, resulting in 329 participants in the final analysis. Periodontally healthy subjects tended to be younger, more likely to be female, and to have fewer missing teeth than subjects with mild or severe periodontal loss (Table 1). One can also observe that subjects in the Healthy category presented less plaque, gingival redness, BOP and suppuration than the periodontitis groups. However, subjects classified as “periodontally healthy” were not necessarily periodontally intact and had an average CAL of 1.2 mm. This was the result of our inclusion criteria, which allowed for the presence of recessions, with the intent of allowing for the recruitment of older subjects in this category. Among these participants, 48 sites were excluded due to a fluctuation in CAL greater than 5 mm and 107 sites were excluded due to rescue therapy for a final number of 52,441 sites included in analyses.
Figure 1.
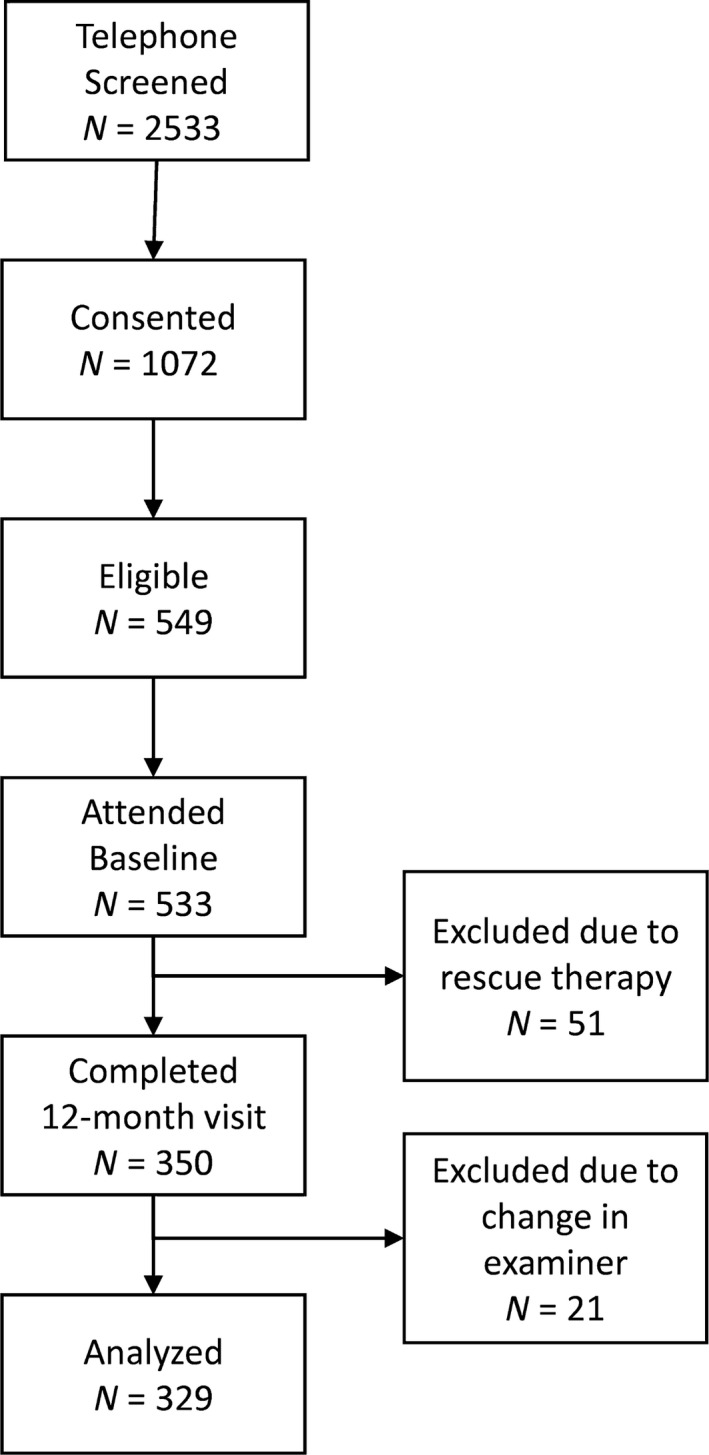
Flow chart of subject recruitment for the study: 2,533 subjects were telephone screened for this study; 1,072 subjects were enrolled (consented) in the study; 549 enrolled subjects were deemed eligible for the study after clinical screening; and 533 subjects attended a baseline visit. Of those, 51 subjects were moved to the treatment phase due to rescue therapy and 350 subjects completed their 12‐month visit by April 12, 2015. Twenty‐one of these individuals were excluded due to change in the examiner during the monitoring phase, resulting in 329 subjects (93 periodontally healthy; 113 with mild periodontal loss and 123 with severe periodontal loss).
Table 1.
Demographic and clinical parameters of study subjects in the three clinical categories: periodontally healthy subjects, subjects with mild periodontal loss and subjects with severe periodontal loss
| Clinical Groups | Total | |||
|---|---|---|---|---|
| Healthy | Mild | Severe | ||
| N of subjects (sites) | 93 (15,260) | 113 (17,822) | 123 (19,359) | 329 (52,441) |
| No Male/Female | 24/69 | 46/67 | 61/62 | 131/198 |
| Age (years; mean ± SD) | 38 ± 13 | 52 ± 12 | 49 ± 12 | 47 ± 13 |
| No AA/C/Other/ND | 17/51/23/2 | 20/72/12/9 | 50/64/4/5 | 87/187/39/16 |
| No of Missing Teeth (mean ± SD) | 0.6 ± 1.2 | 1.5 ± 1.5 | 1.5 ± 1.6 | 1.3 ± 1.5 |
| Pocket depth (mm; mean ± SD) | 1.7 ± 0.3 | 2.3 ± 0.3 | 2.8 ± 0.5 | 2.3 ± 0.6 |
| Clinical attachment level (mm; mean ± SD) | 1.2 ± 0.4 | 2.2 ± 0.5 | 2.6 ± 0.7 | 2.1 ± 0.8 |
| Percentage of sites per subject with: | ||||
| Plaque (mean ± SD) | 50 ± 23 | 64 ± 22 | 71 ± 21 | 63 ± 25 |
| Gingival redness (mean ± SD) | 27 ± 22 | 52 ± 26 | 65 ± 24 | 50 ± 28 |
| Bleeding on probing (mean ± SD) | 19 ± 20 | 34 ± 20 | 54 ± 24 | 37 ± 26 |
| Suppuration (mean ± SD) | 0.03 ± 0.15 | 0.01 ± 0.07 | 0.12 ± 0.34 | 0.05 ± 0.23 |
| No of sites/subject | ||||
| <4 mm (mean ± SD) | 164 ± 8 | 141 ± 12 | 120 ± 21 | 140 ± 23 |
| 4–6 mm (mean ± SD) | 0.5 ± 1.2 | 16 ± 9 | 34 ± 15 | 18 ± 17 |
| >6 mm (mean ± SD) | 0 | 0.7 ± 1.8 | 2.7 ± 4.4 | 1.3 ± 3.1 |
AA, African American; C, Caucasian; ND, Not disclosed.
Standard deviations of duplicate measures of CAL and intra‐examiner reproducibility
The subject‐level mean SD of duplicate measures was 0.26 mm (range 0 to 0.79 mm). The intra‐examiner agreement for the 16 clinical examiners was: exact agreement (±SD) – 66.2% (±6.6%) of the time; and agreement within 1 mm – 95.9% (±2.3%).
Proportion of sites with progression and reversals
A total of 2,192 sites (4.2%) that had missing CAL data points had data carried forward from the previous visit in the first (descriptive) stage of the analysis. Within 12 months, overall, 21.2, 2.8 and 0.3% of sites progressed according to the thresholds of 1, 2 and 3 mm respectively. The proportion of sites that progressed according to simple thresholds increased over time, with a high proportion of reversals, irrespective of the diagnostic threshold and the clinical group (Table 2). The data indicate a higher proportion of progressing sites in the periodontal disease groups compared to healthy subjects for all three thresholds. The proportion of sites reversing was relatively independent of the duration of follow‐up, though the proportion of sites classified as reversing within a given time period increased greatly as the progression threshold increased.
Table 2.
Observed percentage of sites with progression and percentage of progressed sites with reversals at the subsequent visit (i.e. no longer being in the state of progression) based on changes in CAL from baseline greater than or equal to 1, 2 and 3 mm at each visit; data for all subjects and stratified for the three clinical groups
| Cohort | Visit | Threshold of change in CAL | |||||
|---|---|---|---|---|---|---|---|
| 1 mm | 2 mm | 3 mm | |||||
| Progression | Reversal | Progression | Reversal | Progression | Reversal | ||
| Overall | 2 months | 14.4% | – | 1.5% | – | 0.1% | – |
| 4 months | 17.6% | 45.6% | 1.9% | 67.0% | 0.2% | 72.0% | |
| 6 months | 17.7% | 44.4% | 2.2% | 64.9% | 0.2% | 83.9% | |
| 8 months | 18.6% | 42.5% | 2.1% | 68.6% | 0.2% | 80.9% | |
| 10 months | 19.9% | 39.3% | 2.6% | 59.8% | 0.3% | 69.3% | |
| 12 months | 21.2% | 38.3% | 2.8% | 61.7% | 0.3% | 82.2% | |
| Mean: | 18.2% | 42.0% | 2.2% | 64.4% | 0.2% | 77.7% | |
| Healthy | 2 months | 10.6% | – | 0.4% | – | 0.01% | – |
| 4 months | 13.2% | 49.0% | 0.5% | 67.0% | 0.02% | 100.0% | |
| 6 months | 15.5% | 37.0% | 0.8% | 66.0% | 0.04% | 100.0% | |
| 8 months | 15.6% | 42.0% | 0.7% | 69.0% | 0.02% | 100.0% | |
| 10 months | 16.3% | 38.0% | 0.9% | 62.0% | 0.01% | 67.0% | |
| 12 months | 17.9% | 36.0% | 1.1% | 63.0% | 0.01% | 100.0% | |
| Mean: | 14.9% | 40.4% | 0.7% | 65.4% | 0.02% | 93.4% | |
| Mild | 2 months | 15.0% | – | 1.8% | – | 0.2% | – |
| 4 months | 18.7% | 43.0% | 2.2% | 67.0% | 0.3% | 59.0% | |
| 6 months | 18.2% | 46.0% | 2.6% | 63.0% | 0.3% | 84.0% | |
| 8 months | 19.4% | 42.0% | 2.6% | 67.0% | 0.3% | 86.0% | |
| 10 months | 20.6% | 38.0% | 3.1% | 55.0% | 0.3% | 69.0% | |
| 12 months | 22.7% | 37.0% | 3.4% | 56.0% | 0.4% | 80.0% | |
| Mean: | 19.1% | 41.2% | 2.6% | 61.6% | 0.3% | 75.6% | |
| Severe | 2 months | 16.8% | – | 2.1% | – | 0.2% | – |
| 4 months | 20.0% | 46.0% | 2.8% | 67.0% | 0.4% | 78.0% | |
| 6 months | 19.0% | 47.0% | 2.9% | 66.0% | 0.3% | 83.0% | |
| 8 months | 20.3% | 43.0% | 2.8% | 70.0% | 0.3% | 75.0% | |
| 10 months | 22.0% | 41.0% | 3.6% | 64.0% | 0.4% | 70.0% | |
| 12 months | 22.5% | 41.0% | 3.6% | 66.0% | 0.5% | 83.0% | |
| Mean: | 20.1% | 43.6% | 3.0% | 66.6% | 0.4% | 77.8% | |
Alternating logistic regressions
All three groups – healthy, mild and severe periodontal disease – experienced a statistically significant increase in progression of periodontitis over time (Fig. 2). Additional results and interpretations are presented in the online supporting information.
Figure 2.
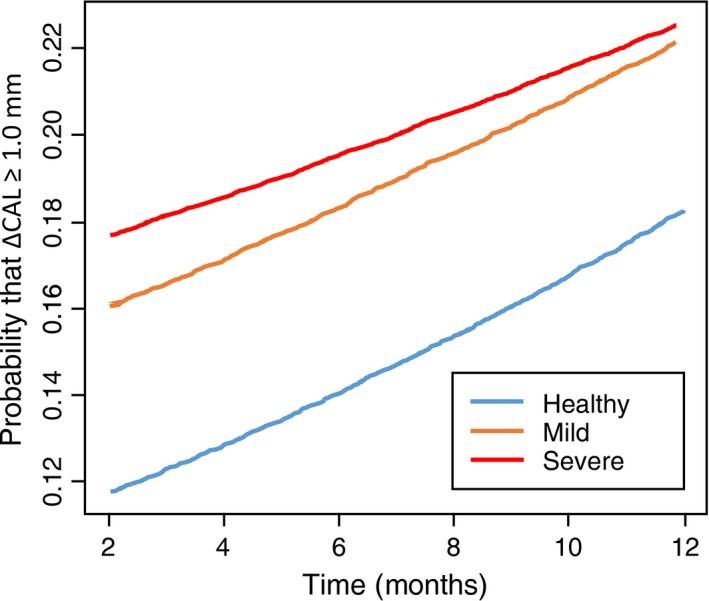
Plots of probabilities that clinical attachment loss (∆CAL) ≥ 1 mm against time for the three disease categories: periodontally healthy, mild periodontal loss and severe periodontal loss, calculated using alternating logistic regression.
Linear mixed models for CAL measurements
The distribution of mean values (i.e. minimum, 25th quartile, median, 75th quartile and maximum) for the PRESS statistics and absolute value of PRESS residuals for each of the 168 sites measured were: 0.51; 0.79; 0.95; 1.22; 2.12 and 0.53; 0.64; 0.71; 0.79; 1.06 respectively. The latter set of results indicate that for the site with the best prediction, site 445, the average absolute PRESS residual was 0.53 mm. For the site with the worst prediction, site 273, the mean lack of fit was 1.06 mm (see online supplementary material for additional details).
From the LMM for changes in CAL, the 75th percentile for the standard errors of prediction was 0.238 and the width of the 95% prediction interval for predicted ∆CAL 0.47 mm (see online supplementary material). Using this threshold to classify sites according to their progressing state, progression occurred in 0.2%, 0.9% and 0.7% of the sites for healthy, mild and severe subjects (Table 3). Line plots of mean observed and predicted ∆CAL (±SD) for sites in the four categories of progression illustrate how the classification scheme resulted in distinguishable patterns of changes in CAL for both observed and predicted values of CAL (Fig. 3). The proportion of progressing and reversing sites based on observed CAL measurements, stratified for the 4 categories of progression, revealed that progressing sites had the highest proportions of sites crossing the thresholds for CAL change and the lowest percentages of reversal from the progressing state (Table 4). One can also observe that for the 1 and 2 mm thresholds, the rates of reversals decreased over time in progressing sites.
Table 3.
Number of subjects and number and percentage of sites (in parenthesis) for each of the four categories of progression from baseline to month 12 with classifications based on linear mixed model predictions of CAL for subjects in the three distinct clinical groups
| Categories of Progression | ||||||||||
|---|---|---|---|---|---|---|---|---|---|---|
| Cohort | Regressing | Stable | Intermediate | Progressing | Total | |||||
| Healthy | 35 | (85; 0.6%) | 93 | (14,149; 92.7%) | 89 | (992; 6.5%) | 20 | (34; 0.2%) | 93 | (15,260; 100%) |
| Mild | 89 | (616; 3.5%) | 113 | (15,817; 88.8%) | 109 | (1,237; 6.9%) | 62 | (152; 0.9%) | 113 | (17,822; 100%) |
| Severe | 114 | (1,217; 6.3%) | 123 | (16,695; 86.2%) | 121 | (1,306; 6.8%) | 65 | (141; 0.7%) | 123 | (19,359; 100%) |
| Total | 238 | (1,918; 3.7%) | 329 | (46,661; 89.0%) | 319 | (3,535; 6.7%) | 147 | (327; 0.6%) | 329 | (52,441; 100%) |
Thresholds for categories of progression: (i) regressing sites (ΔpCAL <−0.47 mm); (ii) stable sites (−0.47 mm ≤ΔpCAL ≤0.47 mm); (iii) intermediate sites (0.47 mm <ΔpCAL <0.94 mm); and (iv) progressing sites (ΔpCAL ≥0.94 mm).
Figure 3.

Line plots of mean changes in clinical attachment loss (ΔCAL) for observed and predicted values over time for sites grouped in the four categories of progression based in the linear mixed models: Regressing – 1,918 sites from 238 subjects; Stable – 46,661 sites from 329 subjects; Intermediate – 3,535 sites from 319 subjects; and Progressing – 327 sites from 147 subjects. Whiskers indicate standard deviation.
Table 4.
Observed percentage of sites with progression and percentage of progressed sites with reversals at the subsequent visit (i.e. no longer being in the state of progression) based on changes in CAL from baseline greater than or equal to 1, 2 and 3 mm at each visit and stratified for the four site categories of progression
| Progression Category | Visit | Threshold of change in CAL | |||||
|---|---|---|---|---|---|---|---|
| 1 mm | 2 mm | 3 mm | |||||
| Progression | Reversal | Progression | Reversal | Progression | Reversal | ||
| Regressing | 2 months | 9.5% | – | 1.9% | – | 0.2% | – |
| 4 months | 6.0% | 69.0% | 0.8% | 72.0% | 0.2% | 75.0% | |
| 6 months | 3.1% | 76.0% | 0.6% | 71.0% | 0.1% | 100.0% | |
| 8 months | 1.0% | 90.0% | 0.1% | 100.0% | 0.1% | 100.0% | |
| 10 months | 0.3% | 100.0% | 0.0% | 100.0% | 0.0% | 100.0% | |
| 12 months | 0.0% | 100.0% | 0.0% | a | 0.0% | a | |
| Mean: | 3.3% | 87.0% | 0.6% | 85.8% | 0.1% | 93.8% | |
| Stable | 2 months | 13.7% | – | 1.2% | – | 0.1% | – |
| 4 months | 15.7% | 48.0% | 1.4% | 73.0% | 0.1% | 85.0% | |
| 6 months | 15.0% | 50.0% | 1.3% | 75.0% | 0.1% | 92.0% | |
| 8 months | 15.0% | 51.0% | 1.0% | 84.0% | 0.1% | 100.0% | |
| 10 months | 15.7% | 50.0% | 1.1% | 84.0% | 0.1% | 96.0% | |
| 12 months | 16.8% | 50.0% | 0.9% | 89.0% | 0.0% | 95.0% | |
| Mean: | 15.3% | 49.8% | 1.2% | 81.0% | 0.1% | 93.6% | |
| Intermediate | 2 months | 25.4% | – | 4.7% | – | 0.5% | – |
| 4 months | 47.0% | 24.0% | 8.2% | 51.0% | 1.2% | 44.0% | |
| 6 months | 58.1% | 22.0% | 11.5% | 51.0% | 0.9% | 88.0% | |
| 8 months | 71.4% | 16.0% | 14.6% | 54.0% | 1.3% | 86.0% | |
| 10 months | 81.4% | 12.0% | 20.2% | 48.0% | 1.7% | 70.0% | |
| 12 months | 86.7% | 12.0% | 22.8% | 55.0% | 2.3% | 90.0% | |
| Mean: | 61.7% | 17.2% | 13.7% | 51.8% | 1.3% | 75.6% | |
| Progressing | 2 months | 29.8% | – | 7.0% | – | 1.6% | – |
| 4 months | 51.9% | 25.0% | 22.2% | 41.0% | 3.2% | 60.0% | |
| 6 months | 71.8% | 13.0% | 33.9% | 33.0% | 7.6% | 40.0% | |
| 8 months | 84.5% | 9.0% | 50.3% | 33.0% | 12.0% | 46.0% | |
| 10 months | 92.3% | 3.0% | 59.2% | 27.0% | 16.1% | 50.0% | |
| 12 months | 97.1% | 3.0% | 76.9% | 17.0% | 23.1% | 69.0% | |
| Mean: | 71.2% | 10.6% | 41.6% | 30.2% | 10.6% | 53.0% | |
There were no progressing sites at 10 months and, therefore, no subsequent reversal.
Using all sites from a single participant (subject X) with changes ≥2 mm at 12 months to illustrate, plotting the observed CAL measurements or their changes from baseline does not distinguish profiles for the different sites (Figs S1a and b respectively). In contrast, the LMM smoothed the longitudinal profiles of CAL measurements, helping to differentiate profiles from different sites (Fig. S1c). Plotting changes in pCAL (ΔpCAL) values revealed distinct patterns of change. For instance, the three curves that had the greatest change in pCAL, including the one highlighted in red, were the only three classified as being progressed based on the LMM approach (Fig. S1d).
Discussion
The use of LMMs to predict periodontal disease progression showed several advantages over traditional methods described in the literature. First, the LMMs could be applied to all visits from all subjects simultaneously while accounting for variation in CAL measurements within subjects over time and between subjects. Specifically, by introducing subject‐specific intercepts, slopes and quadratic trends (i.e. random effects), the models accounted for the random fluctuations in CAL measurements over time, while providing smoothed predicted profiles of site‐specific change in predicted CAL for each site. The predictions were additionally based on “fixed effects,” which are similar to the more familiar coefficients from standard linear regression models. In particular, the model adjusted for potential influences on CAL changes from age, gender and baseline mean CAL (subject level) differences.
Using a cut‐off based on the standard errors of predicted change in CAL, we classified a small percentage of sites as progressing. Although we cannot verify the biological or clinical accuracy of this classification, this proportion agrees with literature suggesting that periodontal disease progression affects a very small percentage of examined sites (Lindhe et al. 1983, 1989, Papapanou et al. 1989, Heitz‐Mayfield et al. 2003, Schatzle et al. 2003). Also in accord with the literature, we classified as progressing a higher percentage of sites in subjects with versus without periodontitis (Löe et al. 1986).
Different approaches in the literature have been used to overcome the influence of error in measurement of CAL in classifying periodontal disease progression (Haffajee et al. 1983, Aeppli & Pihlstrom 1989, Machtei et al. 1993). Most strategies focus on identifying thresholds of change in CAL that would compensate for variance in CAL assessments, as determined by pairs of cross‐sectional measurements. However, given the high level of errors in CAL measurements in periodontitis subjects, detection of changes in CAL are subjected to high rates of false‐positives (Corraini et al. 2013). Another weakness of this approach is its lack of accounting for longitudinal sources of variation in CAL measurements (Espeland et al. 1991). An additional challenge is that apparent longitudinal fluctuation in CAL that is partly due to measurement error may be indistinguishable from actual reversal in CAL. As illustrated by the high proportion of sites demonstrating reversal after crossing the threshold of ≥3 mm of CAL increase in our dataset, raising the threshold for progression does not avoid issues associated with reversal of changes in CAL and in fact was associated with a high overall proportion (70–80%) classified as reversing within any time interval.
Indeed, one of the first questions raised after we detected relatively high rates of reversal was if disease progression had occurred at all in this population. To globally address this issue we tested if the proportion of sites crossing certain thresholds of increases in CAL would accumulate over time. The use of ALR provided strong evidence that the percentage of sites with increases in CAL accumulated over time in all clinical groups. That the apparent high rate of reversal did not nullify increases in CAL supports the notion that disease progression truly occurred. Noteworthy, when the proportions of sites crossing the preset thresholds of CAL increase and the rates of reversal were computed for sites stratified in the four categories of progression, progressing sites had the highest proportions of sites crossing the three thresholds of increases in CAL and the lowest rates of reversal. These results indicate that our classification of progression was able to identify sites with a high likelihood of having undergone “irreversible” progression.
Because the diagnosis of periodontal disease progression relies on changes in CAL, which are known to have many sources of error (Corraini et al. 2013), we made every effort to minimize the error in the CAL measurements. Values for the average SD of duplicate site‐specific CAL measurements reported in the literature have varied from 0.63 mm (Zappa et al. 1991) to 0.84 mm (Goodson et al. 1982). Our results compared favourably with these figures with an overall mean SD of replicate CAL measurements of only 0.28 mm. This could be partly explained by the inclusion of periodontally healthy subjects in this study population (most studies examined only subjects with periodontitis) and a lower level of disease in the subjects with periodontitis. Some investigators have reported intra‐examiner CAL or relative attachment level agreement ≤1.0 mm for replicate measurements of CAL varying from 93% (Baelum et al. 1993) to 97% (Chambers et al. 1991). We obtained 96% intra‐examiner agreement within 1 mm. Further longitudinal follow‐up of examiner reproducibility demonstrated no drift in intra‐examiner agreement over time.
The approach described here is not without shortcomings. Perhaps the main limitation of the analysis was that it was impossible to determine the diagnostic reliability of the proposed method, as the true diagnosis of disease progression remains unknown. In fact, because we cannot separate biologically or clinically meaningful fluctuation from measurement error, it is possible that we smoothed relevant changes in CAL along with noise. This problem is not unique to the proposed approach, and we anticipate that as the field accrues more well‐collected longitudinal data, we can begin to develop gold standard measures of progression. Further, computational difficulties associated with model complexity, specifically with respect to the number of variance components requiring estimation, prohibited the simultaneous fitting of all sites. Fully Bayesian model estimation may circumvent these difficulties. Nonetheless, the LMM applied to individual sites leveraged repeated measurements data from all participants and should better account for errors in CAL measurements than previously proposed approaches.
In summary, the LMM accounted for several sources of error in longitudinal CAL measurement with the goal of enabling a more accurate identification of progressing sites. The results corroborate previous investigations suggesting that the diagnosis of disease progression based on a pair of visits is prone to a high rate of false positives.
Clinical Relevance.
Scientific rationale for the study: Periodontal disease progression is diagnosed based on changes in CAL measurements which are known to be prone to error. We used linear mixed models to account for errors in classifying periodontal sites regarding disease progression.
Principal findings: Fluctuations in longitudinal CAL measurements over time resulted in implausibly high proportions of sites reversing from a progressing state. The linear mixed model for each site provided subject‐specific predicted trends having patterns consistent with periodontal disease progression.
Practical implications: Due to high longitudinal fluctuations in CAL, multiple measurements of CAL over time might be needed to reliably detect periodontal disease progression.
Supporting information
Figure S1. (a) Line plot of clinical attachment loss (CAL) measurements for 30 sites with changes ≥2 mm in observed CAL measurements from baseline to 12 months from a single participant (subject X). (b) changes in CAL (ΔCAL) for the same 30 sites. (c) predicted CAL values from the linear mixed models for the same 30 sites over time. (d) changes in the predicted CAL over time. The blue profile highlights an example of a site classified as stable, whereas the red profile illustrates a progressing site based in the LMMs.
Table S1. Log odds ratio estimates (standard errors) from the ALR analysis with dichotomous outcome ∆CAL ≥1 mm versus ∆CAL <1 mm with change relative to baseline CAL.
Table S2. Sites with the highest and the lowest mean PRESS statistics.
Table S3. Sites with the highest and the lowest mean absolute PRESS residuals.
Table S4. Quantiles mean PRESS statistics.
Table S5. Quantiles mean absolute PRESS residuals.
Table S6. Summary statistics for the standard errors of changes in predicted values.
Table S7. Quantiles of the standard errors of predicted change in CAL.
Teles R, Benecha HK, Preisser JS, Moss K, Starr JR, Corby P, Genco R, Garcia N, Giannobile WV, Jared H, Torresyap G, Salazar E, Moya J, Howard C, Schifferle R, Falkner KL, Gillespie J, Dixon D, Cugini M. Modelling changes in clinical attachment loss to classify periodontal disease progression. J Clin Periodontol 2016; 43: 426–434. doi: 10.1111/jcpe.12539.
Conflict of interest and source of funding statement
The authors declare that they have no conflict of interest.This study was supported by research grant DE021127‐01 from the National Institute of Dental and Craniofacial Research.
References
- Aeppli, D. M. & Pihlstrom, B. L. (1989) Detection of longitudinal change in periodontitis. Journal of Periodontal Research 24, 329–334. [DOI] [PubMed] [Google Scholar]
- Baelum, V. , Wen‐Min, L. , Dahlen, G. , Fejerskov, O. & Xia, C. (1993) Six‐year progression of destructive periodontal disease in 2 subgroups of elderly Chinese. Journal of Periodontology 64, 891–899. doi:10.1902/jop.1993.64.9.891. [DOI] [PubMed] [Google Scholar]
- Breen, H. J. , Johnson, N. W. & Rogers, P. A. (1999a) Site‐specific attachment level change detected by physical probing in untreated chronic adult periodontitis: review of studies 1982‐1997. Journal of Periodontology 70, 312–328. doi:10.1902/jop.1999.70.3.312. [DOI] [PubMed] [Google Scholar]
- Breen, H. J. , Rogers, P. A. , Slaney, R. E. , Gillett, I. R. & Johnson, N. W. (1999b) Option‐4 algorithm for third generation disc probe: agreement of selected site‐specific relative attachment level measurements and detection of longitudinal site‐specific attachment level change. Journal of Periodontology 70, 159–170. doi:10.1902/jop.1999.70.2.159. [DOI] [PubMed] [Google Scholar]
- Carey, V. , Zeger, S. L. & Diggle, P. (1993) Modeling multivariate binary data with alternating logistic regressions. Biometrika 80, 517–526. doi:DOI 10.1093/biomet/80.3.517. [Google Scholar]
- Chambers, D. A. , Imrey, P. B. , Cohen, R. L. , Crawford, J. M. , Alves, M. E. & McSwiggin, T. A. (1991) A longitudinal study of aspartate aminotransferase in human gingival crevicular fluid. Journal of Periodontal Research 26, 65–74. [DOI] [PubMed] [Google Scholar]
- Cnaan, A. , Laird, N. M. & Slasor, P. (1997) Using the general linear mixed model to analyse unbalanced repeated measures and longitudinal data. Statistics in Medicine 16, 2349–2380. doi:Doi 10.1002/(Sici)1097-0258(19971030)16:20<2349:Aid-Sim667>3.0.Co;2-E. [DOI] [PubMed] [Google Scholar]
- Corraini, P. , Baelum, V. & Lopez, R. (2013) Reliability of direct and indirect clinical attachment level measurements. Journal of Clinical Periodontology 40, 896–905. doi:10.1111/jcpe.12137. [DOI] [PubMed] [Google Scholar]
- Espeland, M. A. , Zappa, U. E. , Hogan, P. E. , Simona, C. & Graf, H. (1991) Cross‐sectional and longitudinal reliability for clinical measurement of attachment loss. Journal of Clinical Periodontology 18, 126–133. [DOI] [PubMed] [Google Scholar]
- Goodson, J. M. , Tanner, A. C. , Haffajee, A. D. , Sornberger, G. C. & Socransky, S. S. (1982) Patterns of progression and regression of advanced destructive periodontal disease. Journal of Clinical Periodontology 9, 472–481. [DOI] [PubMed] [Google Scholar]
- Haffajee, A. D. , Socransky, S. S. & Goodson, J. M. (1983) Comparison of different data analyses for detecting changes in attachment level. Journal of Clinical Periodontology 10, 298–310. [DOI] [PubMed] [Google Scholar]
- Harley, A. , Floyd, P. & Watts, T. (1987) Monitoring untreated periodontal disease. Journal of Clinical Periodontology 14, 221–225. [DOI] [PubMed] [Google Scholar]
- Heitz‐Mayfield, L. J. , Schatzle, M. , Loe, H. , Burgin, W. , Anerud, A. , Boysen, H. & Lang, N. P. (2003) Clinical course of chronic periodontitis. II. Incidence, characteristics and time of occurrence of the initial periodontal lesion. Journal of Clinical Periodontology 30, 902–908. [DOI] [PubMed] [Google Scholar]
- Holditch‐Davis, D. , Edwards, L. J. & Helms, R. W. (1998) Modeling development of sleep‐wake behaviors: I. Using the mixed general linear model. Physiology & Behavior 63, 311–318. [DOI] [PubMed] [Google Scholar]
- Jeffcoat, M. K. & Reddy, M. S. (1991) Progression of probing attachment loss in adult periodontitis. Journal of Periodontology 62, 185–189. [DOI] [PubMed] [Google Scholar]
- Laird, N. M. & Ware, J. H. (1982) Random‐effects models for longitudinal data. Biometrics 38, 963–974. [PubMed] [Google Scholar]
- Lindhe, J. , Haffajee, A. D. & Socransky, S. S. (1983) Progression of periodontal disease in adult subjects in the absence of periodontal therapy. Journal of Clinical Periodontology 10, 433–442. [DOI] [PubMed] [Google Scholar]
- Lindhe, J. , Okamoto, H. , Yoneyama, T. , Haffajee, A. & Socransky, S. S. (1989) Longitudinal changes in periodontal disease in untreated subjects. Journal of Clinical Periodontology 16, 662–670. [DOI] [PubMed] [Google Scholar]
- Liu, H. , Weiss, R. E. , Jennrich, R. I. & Wenger, N. S. (1999) PRESS model selection in repeated measures data. Computational Statistics & Data Analysis 30, 169–184. [Google Scholar]
- Löe, H. , Anerud, A. , Boysen, H. & Morrison, E. (1986) Natural history of periodontal disease in man. Rapid, moderate and no loss of attachment in Sri Lankan laborers 14 to 46 years of age. Journal of Clinical Periodontology 13, 431–445. [DOI] [PubMed] [Google Scholar]
- Machtei, E. E. , Dunford, R. , Hausmann, E. , Grossi, S. , Norderyd, J. & Genco, R. J. (1993) A stepwise approach to determine periodontal attachment loss in longitudinal studies. Journal of Periodontal Research 28, 536–539. [DOI] [PubMed] [Google Scholar]
- Papapanou, P. N. , Wennstrom, J. L. & Grondahl, K. (1989) A 10‐year retrospective study of periodontal disease progression. Journal of Clinical Periodontology 16, 403–411. [DOI] [PubMed] [Google Scholar]
- Schatzle, M. , Loe, H. , Lang, N. P. , Heitz‐Mayfield, L. J. , Burgin, W. , Anerud, A. & Boysen, H. (2003) Clinical course of chronic periodontitis. III. Patterns, variations and risks of attachment loss. Journal of Clinical Periodontology 30, 909–918. [DOI] [PubMed] [Google Scholar]
- Socransky, S. S. , Haffajee, A. D. , Goodson, J. M. & Lindhe, J. (1984) New concepts of destructive periodontal disease. Journal of Clinical Periodontology 11, 21–32. [DOI] [PubMed] [Google Scholar]
- Zappa, U. , Reinking‐Zappa, M. , Graf, H. & Espeland, M. (1991) Cell populations and episodic periodontal attachment loss in humans. Journal of Clinical Periodontology 18, 508–515. [DOI] [PubMed] [Google Scholar]
Associated Data
This section collects any data citations, data availability statements, or supplementary materials included in this article.
Supplementary Materials
Figure S1. (a) Line plot of clinical attachment loss (CAL) measurements for 30 sites with changes ≥2 mm in observed CAL measurements from baseline to 12 months from a single participant (subject X). (b) changes in CAL (ΔCAL) for the same 30 sites. (c) predicted CAL values from the linear mixed models for the same 30 sites over time. (d) changes in the predicted CAL over time. The blue profile highlights an example of a site classified as stable, whereas the red profile illustrates a progressing site based in the LMMs.
Table S1. Log odds ratio estimates (standard errors) from the ALR analysis with dichotomous outcome ∆CAL ≥1 mm versus ∆CAL <1 mm with change relative to baseline CAL.
Table S2. Sites with the highest and the lowest mean PRESS statistics.
Table S3. Sites with the highest and the lowest mean absolute PRESS residuals.
Table S4. Quantiles mean PRESS statistics.
Table S5. Quantiles mean absolute PRESS residuals.
Table S6. Summary statistics for the standard errors of changes in predicted values.
Table S7. Quantiles of the standard errors of predicted change in CAL.