

Abstract
Objectives
To determine what effect driving cessation may have on subsequent health and well‐being in older adults.
Design
Systematic review of the evidence in the research literature on the consequences of driving cessation in older adults.
Setting
Community.
Participants
Drivers aged 55 and older.
Measurements
Studies pertinent to the health consequences of driving cessation were identified through a comprehensive search of bibliographic databases. Studies that presented quantitative data for drivers aged 55 and older; used a cross‐sectional, cohort, or case–control design; and had a comparison group of current drivers were included in the review.
Results
Sixteen studies met the inclusion criteria. Driving cessation was reported to be associated with declines in general health and physical, social, and cognitive function and with greater risks of admission to long‐term care facilities and mortality. A meta‐analysis based on pooled data from five studies examining the association between driving cessation and depression revealed that driving cessation almost doubled the risk of depressive symptoms in older adults (summary odds ratio = 1.91, 95% confidence interval = 1.61–2.27).
Conclusion
Driving cessation in older adults appears to contribute to a variety of health problems, particularly depression. These adverse health consequences should be considered in making the decision to cease driving. Intervention programs ensuring mobility and social functions may be needed to mitigate the potential adverse effects of driving cessation on health and well‐being in older adults.
Keywords: driving cessation, older adults, motor vehicle, health outcomes
Car ownership and driving are highly correlated with independence and life satisfaction in older adults.1, 2, 3, 4 In the United States and other industrialized countries, driving is often the most‐preferred mode of personal transport, is regarded as an important aspect of personal freedom, and is associated with a sense of control over one's life.4, 5, 6, 7 The capacity to drive is an important mechanism through which many adults, young and old, fulfill their social roles and engage with their environments.6 Driving has also been identified as an important instrumental activity of daily living (IADL).7 In a study in Australia, older adults rated driving as the second most important activity of daily living (ADL) task, behind use of transportation but ahead of leisure, reading, and medication management.8
Driving safety is especially relevant given the growing older adult population; the proportion of the U.S. population aged 65 and older will increase from 13% in 2010 to 20% in 2040.9 Most adults continue driving in older age; 81% of the 39.5 million adults aged 65 and older in the United States held a driver's license.10 These older drivers face unique challenges because driving is a complex task that requires a variety of skills, including physical, cognitive, behavioral, and sensory‐perceptual abilities.11 Because of age‐related declines in health and physical and cognitive function, driving becomes more difficult for older adults. Many older adults eventually reduce or stop their driving activities, which may have adverse health consequences.12, 13, 14
Health problems are the most commonly cited reasons for driving cessation.15, 16 Several community‐based studies have identified specific medical and socioeconomic factors associated with driving cessation, such as recent hospitalizations, neurological disorders (e.g., Parkinson's disease, stroke), visual disorders (e.g., cataracts, retinal hemorrhage, macular degeneration), low income, and unemployment.15, 17, 18, 19 Other factors that may precipitate driving cessation include advice and warning from a physician, crash involvement, and intervention from a family member.2, 20, 21 Sociodemographic variables such as age, sex, education, marital status, co‐resident status, urban residence, and geographic location may also influence the decision to cease driving.5, 15, 19, 22, 23, 24
It is likely that the relationship between health status and driving cessation is mutually causative; that is, declining health may lead to driving cessation, and driving cessation in turn may result in adverse health outcomes. In addition, health declines can result from reduced access to out‐of‐home medical care and difficulty picking up medications and making other health purchases. Although risk factors for driving cessation have been studied extensively,3, 15, 17, 18, 19, 22 there is less research examining the effect of driving cessation on health outcomes.13 The objective of this review was to assess and synthesize evidence in the research literature on the consequences of driving cessation in older adults.
Methods
This systematic literature review included a narrative synthesis and a meta‐analysis. The meta‐analysis component followed standard methodology and adhered to reporting and procedures outlined in the Preferred Reporting Items for Systematic Reviews and Meta‐Analyses25 and Meta‐analysis Of Observational Studies in Epidemiology guidelines.26
Eligibility
Studies were eligible for inclusion if they included community‐dwelling adults aged 55 and older, examined the consequences of driving cessation, used an epidemiological design (cross‐sectional, cohort, or case–control) that compared driving cessation with continued driving, presented quantitative data on any health‐related outcome (e.g., physical, social, emotional), and were published in English language. No date restrictions were applied. Qualitative studies, letters, editorials, opinion pieces, commentaries, and reviews were excluded. In this review, driving cessation was defined as total discontinuation of operating a motor vehicle for productive, social, spiritual, or any other purposes. Studies that exclusively focused on driving reduction, which implies some continuation of driving, were excluded. Driving cessation could be voluntary or involuntary, with or without loss of driver's license.
Search Strategy, Data Sources, and Extraction
A medical librarian was consulted to review the search strategy and terms. Relevant literature was identified through a comprehensive search of the following electronic databases on November 15, 2014: American Psychological Association PsychINFO (1967‐present), Scopus (1960‐present), Transport Research International Documentation (TRID) (1970‐present), Medline OVID (1946‐present), and MELVYL (the online catalog of the University of California library system) (1970‐present). One author (SC) screened all the titles and abstracts using the inclusion and exclusion criteria. The full text of studies with uncertain eligibility was reviewed using these criteria. Information was abstracted from each included study on primary author, publication year, country of study population or where study data originated, study design, source of driving cessation status, comparison group, outcomes assessed, methods of outcome assessment, and results. For the metaanalysis, two authors (SC, GL) independently extracted the data needed to calculate the individual odds ratio (OR) and summary OR for the health outcome.
Quality Assessment, Data Synthesis, and Analysis
The quality of all included studies was evaluated using the Newcastle‐Ottawa Scale (NOS)27 for assessing the quality of nonrandomized studies in meta‐analyses, as recommended by the Cochrane Collaboration on bias assessment.28 The best possible score varies according to study design; higher scores indicate better quality. In this version of the scale, the highest possible score is 10 for a cross‐sectional study and 9 for a cohort study. For the cross‐sectional studies, the NOS was modified to disregard the follow‐up period and absence of outcome at the start of the study.
Because of the numerous possible health‐related consequences for driving cessation, studies were grouped according to health outcomes for synthesis. The most‐common health outcomes were identified and verified for consistency in outcome assessment to determine their inclusion in the meta‐analysis. Meta‐analysis was considered for health outcomes that were measured consistently in at least five studies.
For each health outcome, the Q and I 2 tests were used to assess heterogeneity.29 P ≤ .05 and I 2 > 0.5 were considered heterogeneous.29 When visual examination of results and test statistics indicated homogeneity, results were combined quantitatively. The individual odds ratio (OR) for each study and the summary OR were calculated using Comprehensive Meta‐Analysis software.30 A fixed‐effects model was used unless significant heterogeneity was present, in which case a random‐effects model would be preferred.
Data from each study were manually entered into the appropriate effect size column in the Comprehensive Meta‐Analysis software; for studies reporting the standardized mean difference (d), results were converted to ORs using the following formula29:
where π is the mathematical constant. The variance of the log OR was calculated using this formula29:
A forest plot was created to show the distribution of the effect of driving cessation across each study. Funnel plots and Rosenthal's fail‐safe N29 were used to assess publication bias.
Results
The comprehensive database search returned 226,410 potentially relevant results; 24,362 duplicates were removed, leaving 202,048 citations to be screened. After excluding studies that did not meet eligibility criteria, 161 studies were reviewed in full text (Figure 1), 16 of which met the inclusion criteria and were included in this systematic review.
Figure 1.
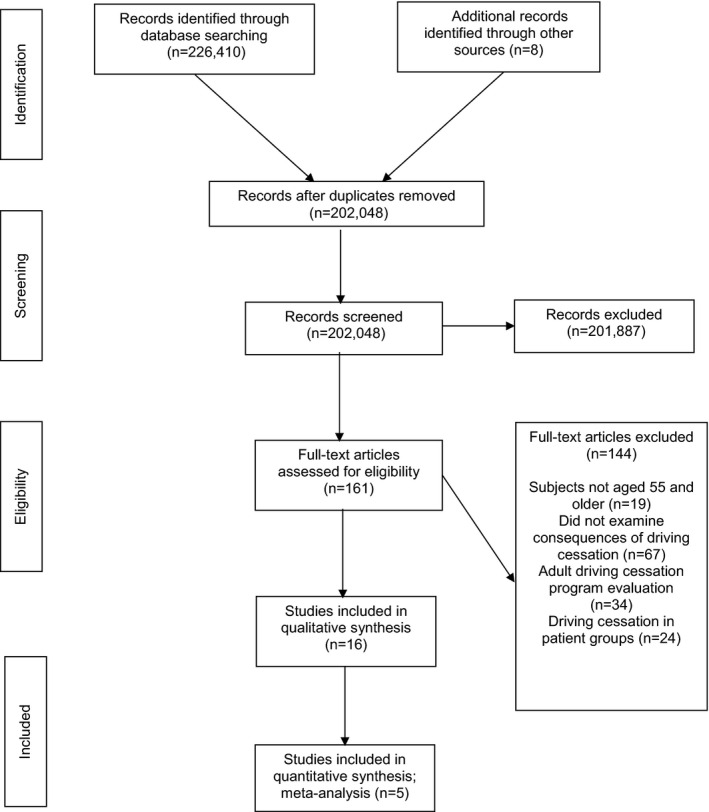
Flow diagram of identification, review, and selection of articles included in the systematic review of health outcomes after driving cessation in older drivers. Adapted from Mohar et al. 200925.
Study Characteristics
Twelve of the 16 studies were conducted in the United States,1, 2, 3, 4, 14, 17, 19, 30, 31, 32, 33, 34, 35, 36 two in Australia,6, 20 and one each in Finland31 and Kuwait7 (Table 1). Two publications reported outcomes from the same population sample (New Haven Established Populations for Epidemiologic Studies for the Elderly).3, 17 All but one study31 included adults of both sexes. The majority included adults aged 65 and older.
Table 1.
Characteristics of Studies Evaluating Driving Cessation for Health‐Related Outcomes
| Author, Year | Study Subjects | Data Source | Study Design | Location | Study Time Period | Source of Outcome Information | Source of Driving Status Information |
|---|---|---|---|---|---|---|---|
| Al‐Hassani et al. 2014 | 114 community‐dwelling adults aged ≥55 | Convenience sample through Kuwait University | Cross‐sectional | Kuwait | 2012–2013 | Geriatric Depression Scale | Study questionnaire |
| Choi et al. 2014 | 9,135 adults aged ≥65 | HRS | Cohort | United States | 1998–2008 | Telephone Interview for Cognitive Status | HRS |
| Curl et al. 2013 | 4,788 adults aged ≥65 | HRS | Cohort | United States | 1998–2010 | RAND Corporation questionnaires | HRS |
| Edwards et al. 2009a | 690 community‐dwelling adults aged ≥65 | ACTIVE Study | Cohort | United States | 1999–2004 | CES‐D | DHQ within the ACTIVE Study |
| Edwards et al. 2009b | 660 community‐dwelling adults aged 63–97 | Staying Keen in Later Life Study | Cohort | United States | 2004–2007 | Social Security Death Index | Mobility questionnaire |
| Fonda et al. 2001 | 5,239 adults aged ≥70 | AHEAD Study | Cohort | United States | 1993–1988 | CES‐D | AHEAD |
| Freeman et al. 2006 | 1,593 adults aged 65–84 living in Salisbury, MD | Salisbury Eye Evaluation Study | Cohort | United States | 1993–2003 | Study questionnaire | Study questionnaire |
| Liddle et al. 2012 | 234 community‐dwelling adults aged ≥65 | Convenience sample from around urban Queensland, Australia | Cross‐sectional | Australia | 2009–2011 | Face‐face interviews | Face‐face interviews |
| Mann et al. 2005 | 697 adults aged 60–106 with at least one activity of daily living difficulty | Rehabilitation Engineering Research Center on Aging, Consumer Assessments Study | Cross‐sectional | United States | 2004–2005 | CAS‐IB | CAS‐IB |
| Marottoli et al. 1997 | 1,316 adults aged ≥65 living in New Haven, CT | EPESE | Cohort | United States | 1982–1988 | CES‐D | EPESE |
| Marottoli et al. 2000 | 1,316 adults aged ≥65 living in New Haven, CT | EPESE | Cohort | United States | 1982–1988 | EPESE | EPESE |
| Mezuk et al. 2008 | 398 adults aged ≥60 | ECA | Cohort | United States | 1993–2005 | Likert scale | ECA |
| O'Connor et al. 2013 | 2,793 community‐dwelling adults aged ≥65 | ACTIVE Study | Cohort | United States | 1999–2004 | Turn 360 Test, Medical Outcomes Study 36‐item Short‐Form Health Survey, Likert scale, family members death confirmation | DHQ within the ACTIVE Study |
| Ragland et al. 2005 | 1,772 adults aged ≥55 in Sonoma County, CA | SPPARCS | Cohort | United States | 1993–1994 | CES‐D | SPPARCS |
| Siren et al. 2004 | 1,251 Finnish women born in 1927 (aged ≥70) | Finish Vehicle Administration center | Cross‐sectional | Finland | 2003–2004 | Survey questionnaire | Driver license register |
| Windsor et al. 2007 | 700 community‐dwelling adults aged ≥70 | ALSA | Cohort | Australia | 1992–1994 | CES‐D | ALSA |
HRS = Health and Retirement Study; ACTIVE = Advanced Cognitive Training for Independent and Vital Elderly; CES‐D = Center for Epidemiological Studies Depression Scale; DHQ = Driving Habits Questionnaire; AHEAD = Asset and Health Dynamics Among the Oldest Old; CAS‐IB = Consumer Assessment Study Interview Battery; EPESE = Established Populations for Epidemiologic Studies for the Elderly; ECA = Baltimore Epidemiologic Catchment Area Study; SPPARCS = Study of Physical Performance and Age‐Related Changes in Sonomans; ALSA = Australian Longitudinal Study of Aging.
Included studies used cohort (n = 12) and cross‐sectional (n = 4) designs (Tables 1, 2). No case–control studies were identified. All included studies examined potential confounding factors such as baseline health status and sociodemographic factors such as age, sex, and in some cases marital status and education. A variety of health outcomes were examined in the 16 studies, including general, physical, social, and mental health; entry to long‐term care (LTC) facilities; and mortality risk (Table 3).
Table 2.
Variables Measured in Studies Evaluating Driving Cessation and Health‐Related Outcomes
| Author, Year | Exposure and Covariates Assessed | Outcomes Measured |
|---|---|---|
| Al‐Hassani et al. 2014 | Driving cessation, age, sex, marital status, education, self‐rated health | Depressive symptoms (Geriatric Depression Scale), perceived control, self‐reported health, life satisfaction (Likert scale) |
| Choi et al. 2014 | Driving cessation, baseline cognitive function, health status, age, sex, race, marital status, education | Cognitive function (Health and Retirement Study cognitive battery) |
| Curl et al. 2013 | Driving cessation, sex, race, marital status, self‐rated health status | Productive engagement and social engagement |
| Edwards et al. 2009a | Driving cessation, baseline depressive symptoms, general health, self‐rated health, physical performance | Depressive symptoms (CES‐D), self‐rated health (Likert scale), physical performance (Turn 360 test), general health and functioning (SF‐36) |
| Edwards et al. 2009b | Driving cessation, age, health, visual acuity, baseline depressive symptoms, baseline cognitive function | Three‐year mortality risk |
| Fonda et al. 2001 | Driving cessation, spouse's driving status, age, race, sex, education, geographical location, baseline health, physical and cognitive functioning | Depressive symptoms (CES‐D) |
| Freeman et al. 2006 | Driving cessation, baseline health, cognitive function, depressive symptoms, demographic characteristics | Long‐term care entry (interviewer‐administered questionnaire) |
| Liddle et al. 2012 | Driving cessation, health, ADLs, sex, age, living situation | Functional status (physical self‐maintenance scale, IADL scale), life satisfaction (Life Satisfaction Index), role participation (role checklist), time use (semistructured interview) |
| Mann et al. 2005 | Driving cessation, age, race, sex, health status | Self‐rated health status (OARS physical health scale), functional status (OARS IADL scale, Sickness Impact Profile, Functional Independence Measure), mental status (Mini‐Mental State Examination) |
| Marottoli et al. 1997 | Driving cessation, health status, ADLs, age, sex, education, marital status, housing type | Depressive symptoms (CES‐D) |
| Marottoli et al. 2000 | Driving cessation, health status, ADLs, age, sex, education, marital status, housing type | Self‐reported out‐of‐home activity levels (home interviews) |
| Mezuk et al. 2008 | Driving cessation, age, race, education, self‐rated health, cognitive function | Social network characteristics; friends and relatives (Likert scale) |
| O'Connor et al. 2013 | Driving cessation, age, sex, race, education, health status, self‐rated health, physical performance, geographic location, | Self‐rated health (Likert scale), physical performance (Turn 360 test), general health and functioning (SF‐36) |
| Ragland et al. 2005 | Driving cessation, health status age, sex, education, marital status, cognitive function, baseline depression status | Depressive symptoms (CES‐D) |
| Siren et al. 2004 | Driving cessation, physical health, psychological well‐being, marital status | Self‐rated health (self‐report), life satisfaction (Satisfaction Life Scale) |
| Windsor et al. 2007 | Driving cessation, health and sensory function, age, sex, education, marital status, income, perceived control, baseline depressive symptoms | Depressive symptoms (CES‐D), self‐rated health and sensory function (Likert scale), perceived control (Expectancy of Control subscale of the Desired Control Measure40, 41) |
CES‐D = Center for Epidemiologic Studies Depression Scale; SF‐36 = Medical Outcomes Study 36‐item Short Form Survey; ADLs = activities of daily living; IADL = instrumental activity of daily living; OARS = Older Americans Resources and Services.
Table 3.
Categorical Health Outcomes Associated with Driving Cessation for the 16 Studies
| Author, Year | Greater Depressive Symptoms | Less Social Engagement | Poorer Functional Status (Role Playing) | Greater Cognitive Decline | Less Productive Engagement (e.g., Work) | Poorer General Health | Greater Risk of Mortality | Lower Out‐of‐Home Activity Level | Greater Dependency and Loss of Control | Greater Risk of Entry into Long‐Term Care |
|---|---|---|---|---|---|---|---|---|---|---|
| Al‐Hassani et al. 2014 | + | + | + | |||||||
| Choi et al. 2014 | + | |||||||||
| Curl et al. 2013 | + | − | ||||||||
| Edwards et al. 2009a | − | + | + | − | ||||||
| Edwards et al. 2009b | + | |||||||||
| Fonda et al. 2001 | + | |||||||||
| Freeman et al. 2006 | + | |||||||||
| Liddle et al. 2012 | + | + | + | |||||||
| Mann et al. 2005 | + | + | + | |||||||
| Marottoli et al. 1997 | + | |||||||||
| Marottoli et al. 2000 | + | |||||||||
| Mezuk et al. 2008 | − | |||||||||
| O'Connor et al. 2013 | + | + | + | + | ||||||
| Ragland et al. 2005 | + | |||||||||
| Siren et al. 2004 | + | + | ||||||||
| Windsor et al. 2007 | + | + | ||||||||
| Studies, n | 6 | 6 | 5 | 2 | 2 | 4 | 2 | 1 | 2 | 1 |
+ = Significant association; − = No significant association.
Study Quality
Based on the NOS,27 all 12 cohort studies were of high quality, with an average assessment score of 7.2 out of 9 (range 7–8). The four cross‐sectional studies varied in quality, with two scoring 9 out of 10 and two scoring 5 out of 10.
Summary of Findings
General Health
Four studies evaluated general health outcomes through self‐reported participant measures.14, 31, 32, 33 One of these studies14 found a rapid decline in general health trajectory after driving cessation in adults aged 65 and older over a 5‐year period. Nondrivers were significantly more likely than drivers to report having poor health, as indicated by scores on the Medical Outcomes Study 36‐item Short‐Form Survey (SF‐36), a widely used self‐report measure of health‐related quality of life.32
A Finnish study31 found that drivers were more likely to assess their health as good (59.4%) than ex‐drivers (42.5%), and another study33 found that former drivers had poorer overall health than current drivers, but because both of these studies were cross‐sectional, it is possible that former drivers stopped driving because of poor health.
Physical Health
Of the five studies7, 14, 20, 32, 33 that found declines in physical functioning, three were cross‐sectional,7, 20, 33 making it difficult to discern temporality, but these studies showed that former drivers had less participation in outside activities and lower productivity in daily life activities than current drivers (Table 3). The association between driving cessation and poor physical functioning was strong in longitudinal studies even after adjusting for sociodemographic factors and baseline health. Although one study14 reported a 6.7‐point decline in the physical functioning domain and a 12‐point decline in the physical role domain of the SF‐36, they examined a small sample of ex‐drivers (n = 37) in a cohort of 690 older adults.
Social Health
Social health refers to the capacity to interact in society, which can be measured according to social engagement, social contacts, and satisfaction with social roles and social support.7, 14, 20, 32, 34, 35 Decline in social health after driving cessation appeared greater in women than in men.14 The reported declines in social health were not as rapid as those in physical health.14, 35 For example, one study34 reported that, over a 13‐year period, driving cessation was associated with a 51% reduction in the size of social networks of friends and relatives, which was not mediated by the availability of or access to alternative transport. In addition, support from family and friends remained unchanged. Former drivers were likely to spend less time in social activities and more time in solitary leisure or to abandon previous social activities.7, 20
Cognitive Decline
One longitudinal study34 reported that former drivers had poorer cognitive abilities as measured according to the Mini‐Mental State Examination than current drivers. Similarly, another study1 found that former drivers had faster cognitive decline over a 10‐year period than active drivers even after controlling for baseline cognitive function and general health. Current drivers were also healthier and had better cognitive function than former drivers in a cross‐sectional study.33
Entry into Long‐Term Care
The only study24 to evaluate entry into LTC reported that former drivers were nearly five times (hazards ratio (HR) = 4.85, 95% confidence interval (CI) = 3.26–7.21) as likely as current drivers to be admitted to LTC facilities (e.g., nursing home, assisted living community, retirement home). Even after adjusting for marital status or co‐residence, the authors found a strong association between driving cessation and LTC entry.24 Having no other driver in the house was independently associated with LTC entry (HR = 1.72, 95% CI = 1.15–2.57).24
Risk of Mortality
There was a general agreement between the two studies32, 36 that exclusively examined the relationship between driving cessation and risk of mortality. One of these studies36 found that driving cessation was a strong predictor of 3‐year mortality, with nondrivers four to six times as likely to die as drivers after adjusting for baseline psychological and general health, sensory function, and cognitive abilities. The other study32 found that 5‐year mortality risk for nondrivers was 68% higher than in drivers. The stronger association reported in the first study36 may be due in part to the fact that its study subjects were less healthy than those in the latter.32
Depressive Symptoms
Five cohort studies2, 4, 6, 7, 14 that examined the effect of driving cessation on depressive symptoms in older adults were included in a meta‐analysis. Four of the studies reported significantly greater depressive symptoms in ex‐drivers after adjustment for potential confounding factors. Effect estimates did not show significant heterogeneity (Q = 3.266, df = 4, P = .51; I 2 = 0.000), indicating that the studies were fairly homogenous, so a fixed‐effects model was used. Overall, driving cessation almost doubled the risk of greater depressive symptoms in older adults (summary OR = 1.91, 95% CI = 1.61–2.27) (Figure 2). A funnel plot for the five studies did not indicate any major publication bias because the summary OR was near the estimated effects from the two largest studies. A cross‐sectional study that used a different measure for depression also found that greater depressive symptoms were associated with driving cessation.7
Figure 2.
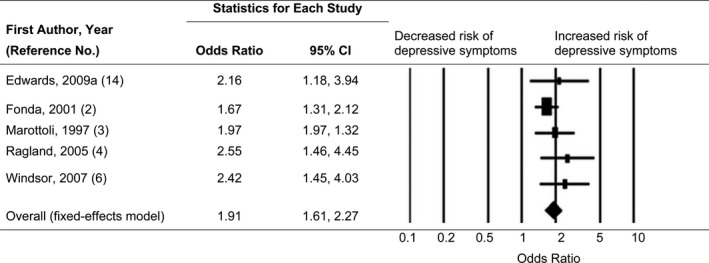
Forest plot, summary odds ratios (ORs), and 95% confidence intervals (CIs) of depressive symptoms associated with driving cessation. The size of each square is proportional to the relative weight that each study contributed to the summary OR. The diamond indicates the summary OR. Horizontal bars indicate the 95% CIs. Heterogeneity: Q statistic: 3.266, df = 4, P = .51, I 2 = 0.000.
Discussion
Driving cessation in older adults is associated with a variety of adverse health outcomes, particularly greater depressive symptoms. These findings are generally consistent with a previous review13 but update and expand the findings of that review with more than 10 additional years of empirical research. Evidence of the association between driving cessation and depression is robust and compelling. Depressive symptoms were measured using the Center for Epidemiologic Studies Depression Scale in all five cohort studies included in the meta‐analysis. Moreover, these five studies were of high quality, as indicated by NOS scores. With the exception of one study,4 the underlying populations studied were nationally representative samples of the U.S. population. Because of the integral role that driving plays in personal identity and independence, driving cessation may lead to psychological reactions.4 The perceived loss of control that accompanies driving cessation may partly explain the association between driving cessation and greater depressive symptoms.6 Not much is known about the extent to which existing transition services and programs contribute to the maintenance of control beliefs and social functioning, but studies have found that availability and access of alternative transport may not mitigate the observed risk of increased depressive symptoms.2, 34 Given the observational nature of the included studies, the possibility that driving cessation and depression are both consequences of some other common factor (e.g., declining health) cannot be completely excluded. Nevertheless, additional research may identify effective interventions that can avoid the worsening of depressive symptoms associated with driving cessation.37
Prior research reported conflicting findings on the effect of driving cessation on general health. Although some researchers found nondrivers to have more medical conditions and poorer health than drivers,17 others have reported the opposite.22, 38 There is growing evidence that driving cessation may exacerbate decline in general health.32 The prospective nature of the study on health trajectories,14 adjusting for baseline covariates, offers compelling evidence of this effect. The conflicting evidence in the literature might be explained in part by the fact that healthier people adapt better to driving cessation than those in poorer health.13 Additional large, prospective studies controlling for location and medical conditions are required to further establish the effect of driving cessation on health.
Based on the current findings, driving cessation may hasten declines in physical and social health in older adults. Older ex‐drivers tend to have markedly fewer out‐of‐home activities as they substitute indoor activities for outside activities.14 Although older adults tend to find substitute activities to do around the home,17 those activities may not benefit physical functioning as much as productive work or volunteerism outside the home does. The health implications of markedly poorer physical functioning are profound in terms of worsening of underlying physical and emotional problems, deconditioning, and need for support with IADLs. As older adults transition to stopping driving, programs should be in place to facilitate continued physical and social activities.
Although there were discrepancies in the assessment of social functioning after driving cessation, the findings are generally consistent. In some qualitative studies, older ex‐drivers mentioned loss of spontaneity and the increasing need to plan things ahead of time,5, 39 which can limit opportunities for out‐of‐home social engagement and activities. Loss of social functioning appears to affect women more than men, but women who voluntarily cease driving seem prepared to adapt to a nondriving lifestyle, whereas those who were forced to stop had a more difficult transition.39 Because of lifestyle changes, many older adults may combine errands such as a trip to the drug store with seeing a friend.5 Although declines in social activities may be gradual,35 they have been found to strongly mediate the association between driving cessation and mortality over time.32
Exdrivers tend to have poorer cognitive abilities than current drivers. Although most studies have shown that declines in cognitive abilities contribute to driving cessation, there is a paucity of studies focusing on the effect of driving cessation on cognitive abilities. Findings from one study1 indicate a possible bidirectional association between driving status and cognitive abilities.
Factors that are likely to precipitate mortality are also likely to affect driving status, making it difficult to establish a causal relationship between driving cessation and mortality, but the two studies32, 36 included in this review adjusted for baseline covariates that could confound the association between driving cessation and mortality. Both studies indicate that driving cessation is a strong risk marker for mortality, possibly by worsening the diminishing functional capabilities of the normal aging process.
The aforementioned adverse health consequences notwithstanding, reducing or ceasing driving in older adults may have safety benefits. One study21 reported a 45% reduction in the annual rate of crash injury in medically unfit drivers after they received warnings from their physicians.
Although this review provides an up‐to‐date synthesis of the research literature on driving cessation and health outcomes, it has several notable limitations. With the exception of one study, the studies examining the effect of driving cessation on depressive symptoms included a self‐report depression scale rather than a clinical diagnosis and thus were able to examine changes only on the scale and not in the proportion of participants classified as clinically depressed. In addition, the assessments of other health outcomes varied substantially across the studies reviewed. The use of standardized measures could allow for quantitative synthesis to obtain robust estimates of effect size. Two studies14, 32 used data from the same project, but the respective study samples did not overlap. Finally, this review was limited to studies published in English and excluded qualitative studies, which can provide rich and deep—although not generalizable—information about the effects of driving cessation. Additional longitudinal studies using standardized measures of health outcomes are needed to better understand the effects of driving cessation on health and well‐being in older adults, particularly as to how these effects may differ according to geographic location and other driver characteristics.
Conclusions
There is mounting evidence that driving cessation in older adults may contribute to a variety of health problems. Of special note is the apparent effect of driving cessation on self‐reported depressive symptoms. Pooled data from five studies indicate that driving cessation nearly doubles the risk of greater depressive symptoms in older adults. The strength of the association between driving cessation and self‐reported depressive symptoms is generally consistent across studies. This finding may be generalizable to the older adult population in the United States because the underlying population in four of the five studies came from nationally representative samples in the United States, and the fifth came from a fairly comparable Western Australian population. This review also sheds light on other health outcomes of driving cessation, including declines in cognitive abilities, diminished physical and social functioning, and greater risks of LTC entry and mortality. These adverse health consequences should be taken into consideration when an older adult ceases driving. Access to alternative transportation may not necessarily mediate the association between driving cessation and greater depressive symptoms.2, 34 Effective intervention programs to ensure and prolong mobility and physical and social functioning for older adults are needed.
Acknowledgments
The authors are thankful to Dr. David W. Eby of the University of Michigan Transportation Research Institute for his helpful comments.
Conflict of Interest: The authors have no conflict of interests to disclose.
This research was supported in part by the AAA Foundation for Traffic Safety's Longitudinal Research on Aging Drivers (LongROAD) Project and the National Center for Injury Prevention and Control, Centers for Disease Control and Prevention (Grant 1 R49 CE002096).
Author Contributions: Chihuri: literature review; acquisition, analysis, and interpretation of data; drafting of manuscript; critical revision. Mielenz, DiMaggio, Betz, DiGuiseppi, Jones: data analysis and interpretation, critical revision. Li: secured funding, study concept and design, critical revision.
Sponsor's Role: Dr. Jurek G. Grabowski of the AAA Foundation for Traffic Safety provided helpful comments. The contents of the manuscript are solely the responsibility of the authors and do not necessarily reflect the official views of the funding agencies.
J Am Geriatr Soc 64:332–341, 2016.
References
- 1. Choi M, Lohman M, Mezuk B. Trajectories of cognitive decline by driving mobility: Evidence from the Health and Retirement Study. Int J Geriatr Psychiatry 2014;29:447–453. [DOI] [PMC free article] [PubMed] [Google Scholar]
- 2. Fonda S, Wallace R, Herzog A. Changes in driving patterns and worsening depressive symptoms among older adults. J Gerontol B Psychol Sci Soc Sci 2001;56B:S343–S351. [DOI] [PubMed] [Google Scholar]
- 3. Marottoli R, Mendes de Leon C, Glass T et al. Driving cessation and increased depressive symptoms: Prospective evidence from the New Haven EPESE. Established Populations for Epidemiologic Studies of the Elderly. J Am Geriatr Soc 1997;45:202–206. [DOI] [PubMed] [Google Scholar]
- 4. Ragland D, Satariano W, MacLeod K. Driving cessation and increased depressive symptoms. J Gerontol A Biol Sci Med Sci 2005;60A:399–403. [DOI] [PubMed] [Google Scholar]
- 5. Bauer M, Rottunda S, Adler G. Older women and driving cessation. Qual Soc Work 2003;2:309–325. [Google Scholar]
- 6. Windsor T, Anstey K, Butterworth P et al. The role of perceived control in explaining depressive symptoms associated with driving cessation in a longitudinal study. Gerontologist 2007;47:215–223. [DOI] [PubMed] [Google Scholar]
- 7. Al‐Hassani S, Alotaibi N. The impact of driving cessation on older Kuwaiti adults: Implications to occupational therapy. Occup Ther Health 2014;28:264–276. [DOI] [PubMed] [Google Scholar]
- 8. Fricke J, Unsworth C. Time use and importance of instrumental activities of daily living. Aust Occup Ther J 2001;48:118–131. [Google Scholar]
- 9. Colby S, Ortman J. The Baby Boom Cohort in the United States: 2012 to 2060. Population Estimates and Projections. Washington, DC: U.S. Census Bureau, 2014. [Google Scholar]
- 10. United States Department of Transportation . FHWA: Highway Finance Data Collection. Our National Highways. Washington, DC: Office of Highway Policy Information, 2011. [Google Scholar]
- 11. Frey EH. Baby boomers and the new demographics of American's seniors. J Am Soc Aging 2010;34:28–37. [Google Scholar]
- 12. Foley D, Heimovitz H, Guralnik J et al. Driving life expectancy of persons aged 70 years and older in the United States. Am J Public Health 2002;92:1284–1289. [DOI] [PMC free article] [PubMed] [Google Scholar]
- 13. Harrison A, Ragland D. Consequences of driving reduction or cessation for older adults. Transport Res Rec 2003;1843:96–104. [Google Scholar]
- 14. Edwards J, Lunsman M, Perkins M et al. Driving cessation and health trajectories in older adults. J Gerontol A Biol Sci Med Sci 2009;64A:1290–1295. [DOI] [PMC free article] [PubMed] [Google Scholar]
- 15. Ragland D, Satariano W, MacLeod K. Reasons given by older people for limitation or avoidance of driving. Gerontologist 2004;44:237–244. [DOI] [PubMed] [Google Scholar]
- 16. Adler G, Rottunda S. Older adults' perspectives on driving cessation. J Aging Stud 2006;20:227–235. [Google Scholar]
- 17. Marottoli R, de Leon C, Glass T et al. Consequences of driving cessation: Decreased out‐of‐home activity levels. J Gerontol B Psychol Sci Soc Sci 2000;55B:S334–S340. [DOI] [PubMed] [Google Scholar]
- 18. Freund B, Szinovacz M. Effects of cognition on driving involvement among the oldest old: Variations by gender and alternative transportation opportunities. Gerontologist 2002;42:621–633. [DOI] [PubMed] [Google Scholar]
- 19. Freeman E, Munoz B, Turano K et al. Measures of visual function and time to driving cessation in older adults. Optom Vis Sci 2005;82:765–773. [DOI] [PubMed] [Google Scholar]
- 20. Liddle J, Gustafsson L, Bartlett H et al. Time use, role participation and life satisfaction of older people: Impact of driving status. Aust Occup Ther J 2011;59:384–392. [DOI] [PubMed] [Google Scholar]
- 21. Redelmeier D, Yarnell C, Thiruchelvam D et al. Physicians' warnings for unfit drivers and the risk of trauma from road crashes. N Engl J Med 2012;367:1228–1236. [DOI] [PubMed] [Google Scholar]
- 22. Dellinger A, Sehgal M, Sleet D et al. Driving cessation: What older former drivers tell us. J Am Geriatr Soc 2001;49:431–435. [DOI] [PubMed] [Google Scholar]
- 23. Johnson J. Why rural elders drive against advice. J Community Health Nurs 2002;19:237–244. [DOI] [PubMed] [Google Scholar]
- 24. Freeman E, Gange S, Munoz B et al. Driving status and risk of entry into long‐term care in older adults. Am J Public Health 2006;96:1254–1259. [DOI] [PMC free article] [PubMed] [Google Scholar]
- 25. Moher D, Liberati A, Tetzlaff J et al. Preferred reporting items for systematic reviews and meta‐analyses: The PRISMA statement. PLoS Med 2009;6:e1000097. [DOI] [PMC free article] [PubMed] [Google Scholar]
- 26. Stroup DF, Berlin JA, Morton SC et al. Meta‐analysis of observational studies in epidemiology: A proposal for reporting. Meta‐analysis Of Observational Studies in Epidemiology (MOOSE) group. JAMA 2000;283:2008‐2012. [DOI] [PubMed] [Google Scholar]
- 27. Wells G, Shea B, O'Connell D et al. The Newcastle‐Ottawa Scale (NOS) for assessing the quality of nonrandomised studies in meta‐analyses. Ottawa, Canada: Ottawa Hospital Research Institute, 2015. Available at http://www.ohri.ca/programs/clinical_epidemiology/oxford.asp [Google Scholar]
- 28. Higgins JPT, Green S (editors). Cochrane Handbook for Systematic Reviews of Interventions Version 5.1.0 [updated March 2011]. The Cochrane Collaboration, 2011. Available at www.cochrane-handbook.org [Google Scholar]
- 29. Borenstein M, Hedges L, Higgins J et al. Introduction to Meta‐Analysis. Chichester, UK: John Wiley and Sons, 2009. [Google Scholar]
- 30. Borenstein M, Hedges L, Higgins J et al. Comprehensive Meta‐Analysis. Englewood, NJ: Biostat, 2005. [Google Scholar]
- 31. Siren A, Hakamies‐Blomqvist L, Lindeman M. Driving cessation and health in older women. J Appl Gerontol 2004;23:58–69. [Google Scholar]
- 32. O'Connor M, Edwards J, Waters M et al. Mediators of the association between driving cessation and mortality among older adults. J Aging Health 2013;25(8 Suppl):249S–269S. [DOI] [PMC free article] [PubMed] [Google Scholar]
- 33. Mann W, McCarthy D, Wu S et al. Relationship of health status, functional status, and psychosocial status to driving among elderly with disabilities. Phys Occup Ther Geriatr 2005;23:1–24. [Google Scholar]
- 34. Mezuk B, Rebok G. Social integration and social support among older adults following driving cessation. J Gerontol B Psychol Sci Soc Sci 2008;63B:S298–S303. [DOI] [PubMed] [Google Scholar]
- 35. Curl A, Stowe J, Cooney T et al. Giving up the keys: How driving cessation affects engagement in later life. Gerontologist 2013;54:423–433. [DOI] [PubMed] [Google Scholar]
- 36. Edwards J, Perkins M, Ross L et al. Driving status and three‐year mortality among community‐dwelling older adults. J Gerontol A Biol Sci Med Sci 2009;64A:300–305. [DOI] [PMC free article] [PubMed] [Google Scholar]
- 37. Choi N, DiNitto D. Depressive symptoms among older adults who do not drive: Association with mobility resources and perceived transportation barriers. Gerontologist 2015. [Epub ahead of print]. [DOI] [PMC free article] [PubMed] [Google Scholar]
- 38. Campbell M, Bush T, Hale W. Medical conditions associated with driving cessation in community‐dwelling, ambulatory elders. J Gerontol 1993;48:S230–S234. [DOI] [PubMed] [Google Scholar]
- 39. Bryanton O, Weeks L, Lees J. Supporting older women in the transition to driving cessation. Act Adapt Aging 2010;34:181–195. [Google Scholar]
- 40. Luszcz MA, Bryan J, Kent P. Predicting episodic memory performance of very old men and women: Contributions from age, depression, activity, cognitive ability, and speed. Psychol Aging 1997;1997:340–351. [DOI] [PubMed] [Google Scholar]
- 41. Reid DW, Zeigler M. The desired control measure and adjustment among the elderly In Lefcourt H, eds. Research with the Locus of Control Construct. New York: Academic Press; 1981, pp 127–159. [Google Scholar]