

Abstract
Objectives
To compare the clinical effectiveness and cost‐effectiveness of labour induction methods.
Methods
We conducted a systematic review of randomised trials comparing interventions for third‐trimester labour induction (search date: March 2014). Network meta‐analysis was possible for six of nine prespecified key outcomes: vaginal delivery within 24 hours (VD24), caesarean section, uterine hyperstimulation, neonatal intensive care unit (NICU) admissions, instrumental delivery and infant Apgar scores. We developed a decision‐tree model from a UK NHS perspective and calculated incremental cost‐effectiveness ratios, expected costs, utilities and net benefit, and cost‐effectiveness acceptability curves.
Main results
In all, 611 studies comparing 31 active interventions were included. Intravenous oxytocin with amniotomy and vaginal misoprostol (≥50 μg) were most likely to achieve VD24. Titrated low‐dose oral misoprostol achieved the lowest odds of caesarean section, but there was considerable uncertainty in ranking estimates. Vaginal (≥50 μg) and buccal/sublingual misoprostol were most likely to increase uterine hyperstimulation with high uncertainty in ranking estimates. Compared with placebo, extra‐amniotic prostaglandin E2 reduced NICU admissions. There were insufficient data to conduct analyses for maternal and neonatal mortality and serious morbidity or maternal satisfaction. Conclusions were robust after exclusion of studies at high risk of bias. Due to poor reporting of VD24, the cost‐effectiveness analysis compared a subset of 20 interventions. There was considerable uncertainty in estimates, but buccal/sublingual and titrated (low‐dose) misoprostol showed the highest probability of being most cost‐effective.
Conclusions
Future trials should be designed and powered to detect a method that is more cost‐effective than low‐dose titrated oral misoprostol.
Tweetable abstract
New study ranks methods to induce labour in pregnant women on effectiveness and cost.
Keywords: Comparative effectiveness research, cost‐effectiveness analysis, labour induction, network meta‐analysis, systematic review
Tweetable abstract
New study ranks methods to induce labour in pregnant women on effectiveness and cost.
Introduction
More than one in five births in England and Wales follow labour induction and rates have increased steadily over the past two decades.1, 2, 3, 4 Similar rates have been observed in other countries including the USA, Australia and other European countries.5
There are a broad range of pharmacological (e.g. oxytocin, misoprostol and prostaglandins), mechanical (e.g. Foley catheter) and complementary (e.g. acupuncture) methods available for induction of labour. Different methods vary in terms of how quickly birth is achieved and the likelihood of complications. From the clinician's perspective, the choice of method takes account of the reason for induction, its urgency, and the woman's obstetric and medical history. Choice may also depend on national guidelines and local protocols, as well as women's preferences. UK guidelines, dating from 2008, recommend vaginal prostaglandin E2 (PGE2) although neither the type of preparation (gel, tablet or sustained release pessary) nor the dose is specified.6
Different induction methods incur different direct and indirect costs, with some methods requiring continuous monitoring throughout labour. Some methods are associated with increased risk of complications requiring a caesarean, and differ in rate of admission to neonatal intensive care units (NICU). Despite its importance, the question of resource use for the National Health Service (NHS) has been relatively under‐studied. There is evidence that inducing labour in women with complications is associated with lower health service costs compared with expectant management.7, 8, 9 However, there is little evidence on the costs associated with specific methods of induction compared with others; trials in which one method of induction has been compared with another have only rarely included economic analyses.10
The purpose of this paper is to summarise findings from a comprehensive evidence synthesis where the overall study objective was to evaluate which interventions are the most clinically effective and cost‐effective for third‐trimester cervical ripening, or labour induction.
Methods
Methods of the systematic review and network meta‐analysis
We carried out a systematic review to identify relevant randomised controlled trials (RCTs). The search was carried out by an information specialist using a predefined strategy (see Appendix S1). The final search date was March 2014, reflecting the additional time required for the network meta‐analysis (NMA) and cost‐effectiveness analysis. Two reviewers independently assessed eligibility: studies were included if they were randomised trials examining interventions to induce labour compared with placebo, no treatment or another intervention. Eligible interventions included pharmacological, mechanical and complementary methods of induction. For completeness, we included methods that are no longer used in clinical practice because including them added data to the network. We included trials looking at complementary methods such as acupuncture because such methods may be of interest to women. Participants were women eligible for third‐trimester induction of labour. We focused on nine key outcomes relating to efficacy, safety and acceptability to women: vaginal delivery not achieved within 24 hours (VD24); uterine hyperstimulation with fetal heart rate changes; caesarean section; serious neonatal morbidity or death; serious maternal morbidity or death; instrumental delivery; maternal satisfaction with the method used; NICU admission and Apgar score <7 at 5 minutes.
Two reviewers independently extracted data for the eligible studies. We extracted data on the type of intervention, and where appropriate dose and route of administration. We assessed risk of bias as high, low or unclear based on the method used to conceal allocation using the Cochrane domain‐based risk of bias assessment tool.11, 12 In view of the large number of studies included in the review we were unable to contact authors of individual trials for further information if methods in the published reports were unclear. We recorded information on characteristics of participants including gestational age, parity, previous caesarean section, state of amniotic membranes and Bishop score.
An NMA was conducted for each outcome where sufficient data were available. NMA uses all the available evidence, both direct and indirect, to produce estimates of the relative effects of each intervention compared with every other in a network, even if some pairs of interventions have not been directly compared.13, 14, 15, 16, 17 Analyses were undertaken in a Bayesian framework, using OPENBUGS.18 Both fixed and random effects models were considered on the basis of model fit. Model fit was measured using the posterior mean of the residual deviance, the degree of between‐study heterogeneity, and the deviance information criterion.19, 20 Consistency between the direct and indirect sources of evidence was assessed by comparing the fit of a model assuming consistency with a model which allowed for inconsistency.21 Results are summarised as odds ratios with 95% credible intervals. (For a detailed description of the methods, previous distributions and convergence checks see the full study report.22)
Methods for the cost‐effectiveness analysis
We developed a de novo decision‐tree model to estimate the cost effectiveness of various interventions using the data obtained from the NMA (Figure S1). We adapted the NMA to account for multiple outcomes in the model, making use of as much evidence as possible (307 studies for caesarean section, but only 86 for timing of vaginal delivery). However, due to poor reporting of VD24 outcome, we were only able to compare 20 interventions in the cost‐effectiveness analysis. We applied the odds ratios from the NMA to the absolute probabilities for the reference intervention (vaginal PGE2 tablet) based on UK trials, to obtain absolute probabilities for all interventions. The model was evaluated using Bayesian Markov chain Monte Carlo simulation, so that all correlations and uncertainties were fully reflected in the estimates.23
Costs included were intervention costs, costs of delivery, and length of neonatal stay in level I, II or III units. Tables S1 and S2 (see Supplementary material) summarise assumed cost inputs and evidence sources. These were derived from NHS reference costs, the British National Formulary and manufacturer costs.24, 25 We took a UK NHS perspective, and used the price year 2012/13. Utility values were required for vaginal delivery, emergency caesarean section, and intensive, high dependency and transitional neonatal care. Table S3 (see Supplementary material) gives assumed values for the utility inputs and evidence sources. Utility estimates were derived from the literature.22, 26, 27
We conducted a fully incremental analysis, reporting incremental cost‐effectiveness ratios (ICERs), interpreted as the additional expected cost per additional unit gain in utility for an intervention compared with the previous non‐dominated intervention. We report expected costs, expected utilities, and expected net benefit at a willingness‐to‐pay per unit of utility threshold of £20 000. Interventions with higher expected net benefit are preferred. We represented uncertainty in the optimal intervention using a cost‐effectiveness acceptability curve.
Results
Results of the systematic review and NMA
A total of 1508 reports corresponding to 1190 separate studies were identified in the literature searches.
After eligibility assessment using our participant, intervention, comparison and outcome criteria, 611 trials met our inclusion criteria (Figure 1). Overall, included trials reported findings for more than 100 000 women, but not all trials reported all outcomes and for each outcome we have indicated the number of trials contributing data to the NMA analysis (Figure 2). Thirty‐one active interventions were included, separated by dose and route of administration. A total of 579 studies were excluded and full details of these studies along with reasons for exclusion are set out in the main study report.22
Figure 1.
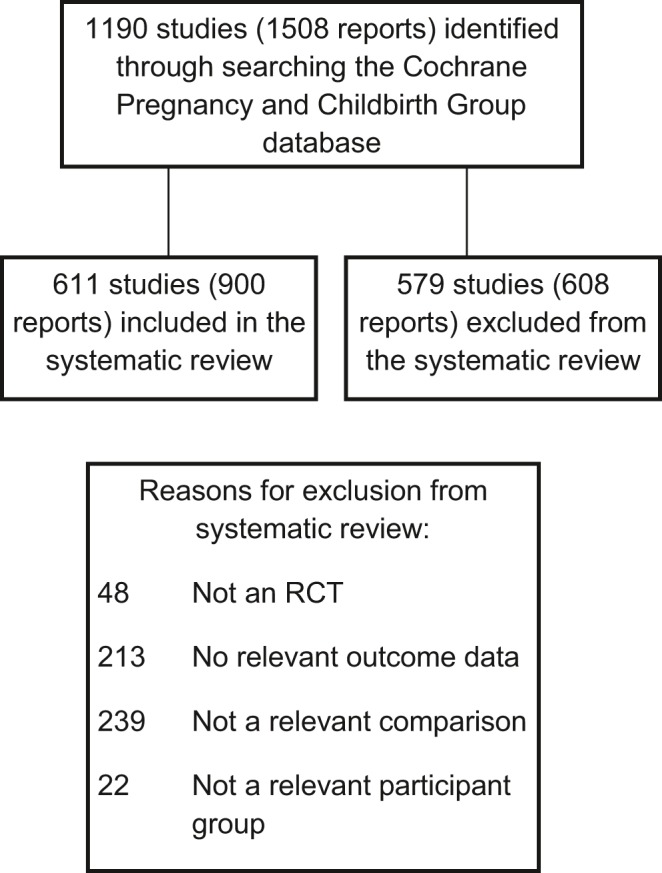
PRISMA study flow diagram for the systematic review.
Figure 2.
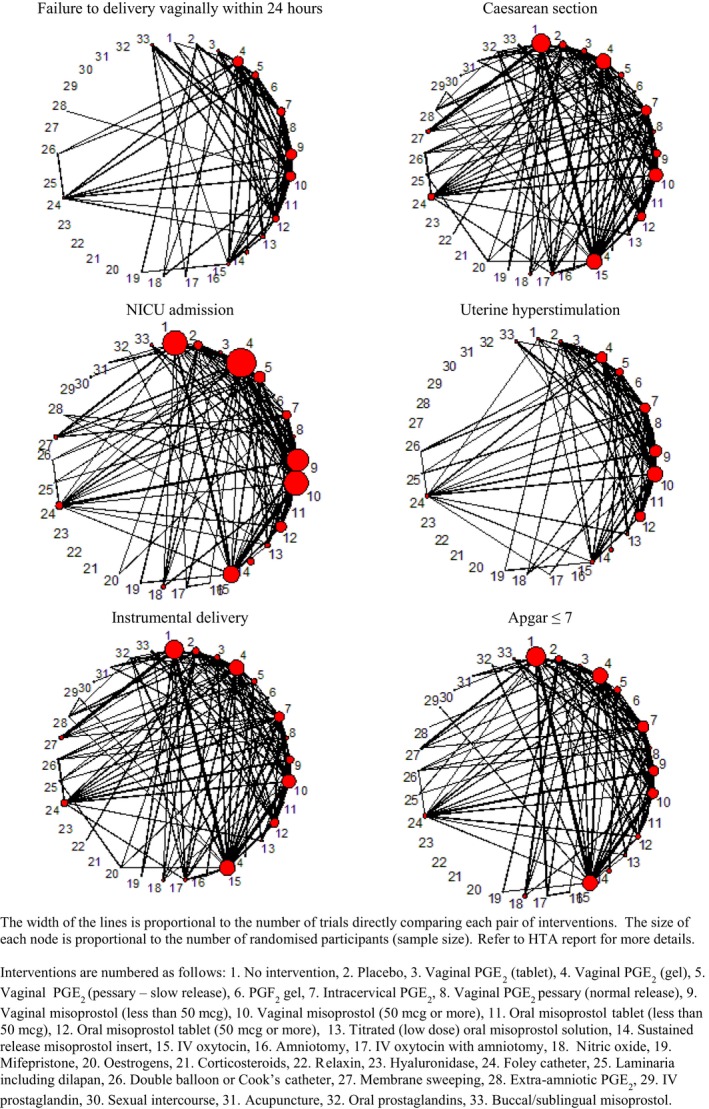
Network diagram of all studies included in analyses of failure to deliver vaginally within 24 hours, caesarean section and NICU admission.
Approximately half (47%) of the included trials were assessed as being at high or unclear risk of bias for allocation concealment. Due to probable inconsistency in the network for caesarean section, we report findings for trials at low risk of bias only. For other outcomes we conducted sensitivity analysis excluding trials at high risk of bias; all results were consistent with the main analysis.22
Table 1 reports the posterior median odds ratios (OR) and 95% credible intervals (CrIs) for each intervention relative to placebo for four NMA outcomes. Due to insufficient reporting in included trials we were unable to conduct analyses for our prespecified outcomes of maternal mortality and serious maternal morbidity, neonatal mortality and serious neonatal morbidity, and maternal satisfaction. Full statistical results are reported elsewhere.22
Table 1.
Odds ratios and 95% credible intervals for caesarean section, no VD24, uterine hyperstimulation with fetal heart rate changes and NICU admission for every intervention compared with placebo
| Active intervention versus placebo | Caesarean section | No VD24 | Uterine hyperstimulation | NICU admission |
|---|---|---|---|---|
| OR (95% CrIs) | OR (95% CrIs) | OR (95% CrIs) | OR (95% CrIs) | |
| Titrated (low‐dose) oral misoprostol solutiona | 0.62 (0.47–0.80) | 0.10 (0.07–0.29) | 1.93 (0.73–4.19) | 0.67 (0.39–1.07) |
| Buccal/sublingual misoprostola | 0.68 (0.51–0.89) | 0.11 (0.05–0.19) | 4.25 (1.71–9.02) | 0.73 (0.42–1.19) |
| Vaginal misoprostol <50 μga | 0.70 (0.57–0.85) | 0.11 (0.09–0.32) | 2.75 (1.36–5.04) | 0.74 (0.49–1.06) |
| Mifepristonea | 0.71 (0.45–1.08) | 0.76 (0.05–0.20) | Not estimablea | 1.71 (0.73–3.55) |
| Oral misoprostol tablet ≥50 μga | 0.72 (0.58–0.88) | 0.16 (0.05–0.20) | 2.85 (1.41–5.20) | 0.83 (0.55–1.20) |
| Vaginal misoprostol ≥50 μga | 0.73 (0.59–0.88) | 0.09 (0.06–0.24) | 4.40 (2.22–7.94) | 0.85 (0.57–1.23) |
| Foley cathetera | 0.76 (0.61–0.95) | 0.19 (0.09–0.46) | 0.92 (0.37–1.93) | 0.66 (0.41–1.00) |
| Vaginal PGE2 (gel)a | 0.79 (0.65–0.94) | 0.13 (0.08–0.50) | 2.33 (1.10–4.40) | 0.88 (0.59–1.26) |
| Nitric oxidea | 0.82 (0.62–1.06) | 0.22 (0.08–0.36) | 0.38 (0.02–1.54) | 0.82 (0.54–1.20) |
| Vaginal PGE2 pessary (normal release)a | 0.82 (0.62–1.09) | 0.11 (0.04–0.16) | 1.40 (0.37–3.68) | 0.88 (0.51–1.40) |
| Intracervical PGE2 a | 0.83 (0.69–0.98) | 0.18 (0.09–0.38) | 1.70 (0.87–3.05) | 0.76 (0.48–1.12) |
| Intravenous oxytocin with amniotomya | 0.89 (0.57–1.34) | 0.05 (0.07–0.32) | 7.44 (0.27–40.66) | 1.60 (0.71–3.06) |
| Intravenous oxytocina | 0.93 (0.75–1.14) | 0.20 (0.21–1.97) | 2.12 (0.97–4.10) | 0.76 (0.50–1.12) |
| Vaginal PGE2 pessary (slow release)a | 0.89 (0.69–1.12) | 0.15 (0.08–0.29) | 2.97 (1.36–5.73) | 0.73 (0.44–1.11) |
| Sustained release misoprostol vaginal pessarya | 0.98 (0.59–1.55) | 0.11 (0.05–0.22) | 5.58 (1.58–14.57) | 0.59 (0.31–1.03) |
| Vaginal PGE2 (tablet)a | 1.04 (0.78–1.35) | 0.16 (0.03–0.26) | 1.99 (0.78–4.25) | 0.83 (0.42–1.44) |
| Double balloon or Cook's cathetera | 1.11 (0.73–1.63) | 0.18 (0.01–0.16) | 0.26 (0.00–1.18) | 0.60 (0.26–1.15) |
| Oral misoprostol tablet <50 μga | 1.11 (0.64–1.81) | 0.22 (0.07–0.39) | 1.13 (0.28–3.15) | 0.79 (0.31–1.63) |
| Corticosteroids | 0.53 (0.20–1.12) | – | – | – |
| Hyaluronidase | 0.61 (0.34–1.00) | – | – | – |
| PGF2 gel | 0.70 (0.40–1.16) | – | – | 0.56 (0.18–1.36) |
| Oral prostaglandins | 0.72 (0.08–2.59) | – | – | 0.68 (0.09–2.40) |
| Membrane sweeping | 0.74 (0.53–0.99) | – | – | 0.83 (0.43–1.46) |
| Laminaria including dilapan | 0.80 (0.43–1.38) | – | 0.52 (0.01–2.62) | 1.54 (0.40–4.31) |
| Acupuncture | 0.81 (0.52–1.20) | – | – | 0.94 (0.11–3.36) |
| Sexual intercourse | 0.85 (0.54–1.29) | – | – | 0.48 (0.14–1.17) |
| Relaxin | 0.88 (0.33–1.98) | – | – | – |
| Extra‐amniotic PGE2 a | 0.98 (0.57–1.57) | 0.41 (0.07–1.33) | – | 0.40 (0.16–0.82) |
| Amniotomy | 1.06 (0.51–2.02) | – | – | 0.84 (0.22–2.26) |
| Estrogens | 1.27 (0.62–2.32) | – | – | 1.43 (0.01–7.80) |
| Intravenous prostaglandin | 19.94 (1.61–120.5) | – | – | – |
Indicates that the intervention was included in the cost‐effectiveness analysis.
Vaginal delivery within 24 hours (141 studies)
For the outcome of vaginal delivery there was strong evidence that all interventions, except for mifepristone, and extra‐amniotic PGE2, increased the probability of VD24 (Table 1). The interventions with the lowest odds ratios (best) were intravenous oxytocin with amniotomy (OR 0.05, 95% CrI 0.01–0.14) and higher dose (≥50 μg) vaginal misoprostol (OR 0.09, 95% CrI 0.06–0.24).
Caesarean section (307 studies)
Compared with placebo, several treatments showed a statistically significant reduction in the odds of caesarean section—titrated low‐dose misoprostol, vaginal misoprostol at both ≥50 and <50 μg, vaginal PGE2 gel, intracervical PGE2, oral misoprostol tablet (≥50 μg), Foley catheter, membrane sweeping and buccal/sublingual misoprostol (Table 1). Titrated oral misoprostol achieved the lowest odds of an eventual caesarean section, but there was considerable uncertainty in ranking estimates.
Uterine hyperstimulation with fetal heart rate changes (180 studies)
Compared with placebo, misoprostol (sustained release vaginal pessary [OR 5.58, 95% CrI 1.58–14.57], vaginal tablet ≥50 μg [OR 4.40, 95% CrI 2.22–7.94], buccal/sublingual [OR 4.25, 95% CrI 1.71–9.02] and oral tablet ≥50 μg [OR 2.85, 95% CrI 1.41–5.20] had the highest odds of uterine hyperstimulation with fetal heart rate changes (Table 1).
NICU admission (204 studies)
Compared with placebo, only one intervention, extra‐amniotic PGE2, resulted in a significant reduction in NICU admissions (OR 0.4, 95% CrI 0.16–0.82). When active treatments were compared there was too much uncertainty around effect estimates to ‘rank order’ other active interventions.
Instrumental delivery (299 studies)
Using placebo as the reference intervention two inter‐ventions resulted in significant reduction in instrumental delivery, namely vaginal PGE2 pessary (slow‐release) (OR 0.72, 95% CrI 0.50–0.99) and Foley catheter (OR 0.68, 95% CrI 0.50–0.91).
Apgar score ≤7at 5 minutes (200 studies)
Compared with placebo, only two regimens resulted in significant reduction in Apgar score of ≤7, nitric oxide (OR 0.49, 95% CrI 0.20–0.95) and buccal/sublingual misoprostol (OR 0.41, 95% CrI 0.15–0.99).
Serious infant and maternal morbidity and death
It was not possible to conduct an NMA for composite outcomes of neonatal mortality and serious morbidity or maternal mortality and serious morbidity because these were too rare or poorly reported for meaningful analysis. Only 21.3% of included trials (131/611) reported perinatal deaths with an incidence of 0.3% (94/32 248). Seventy‐seven of the 611 trials (12.6%) reported a total of 20 maternal deaths or serious morbidity (five deaths, 14 uterine ruptures and one ICU admission for infection), i.e. an incidence of 0.1%.
Other outcomes
Few studies collected information on women's views. On the whole women tended to have positive views, or at least accepted the induction process, but there was insufficient information to determine whether some methods were preferred over others.22
Subgroup analysis
We planned to conduct subgroup analyses to explore the effect of different clinical subgroups on outcomes. The prespecified confounders were (i) women with intact or ruptured membranes, (ii) different gestational ages, (iii) women with or without a previous caesarean section and (iv) women with low (≤6) or higher (>6) Bishop scores. The results of subgroup analyses were largely consistent with the overall results, although we found that for the VD24 outcome, oxytocin with amniotomy had mainly been tested in women with favourable Bishop scores.
Results of the cost‐effectiveness analysis
Table 2 shows the expected total cost and expected total utility for each treatment with 95% CrIs. Interventions are ordered by increasing expected total cost (treatment costs plus resource costs), with buccal/sublingual misoprostol and intravenous oxytocin with amniotomy having the lowest expected total cost.
Table 2.
Base‐case, expected total costs, expected total utilities, ICERs, and expected net benefit at a £20 000 willingness to pay threshold
| Treatment | Expected total cost (£) | Expected total utility | Expected net benefit (£) | ICER (£) |
|---|---|---|---|---|
| Buccal/sublingual misoprostol | 1747.18 (1341.57–1472.34) | 0.82 (0.68–0.95) | 14 668.72 | |
| Intravenous oxytocin with amniotomy | 1747.80 (1275.41–2370.82) | 0.82 (0.67–0.95) | 14 652.13 | Dominated |
| Vaginal misoprostol—dose 50 μg or more | 1789.56 (1386.41–2270.74) | 0.82 (0.68–0.95) | 14 603.51 | Dominated |
| Titrated (low‐dose) oral misoprostol solution | 1799.55 (1403.44–2262.10) | 0.82 (0.68–0.96) | 14 658.28 | 21 190 |
| Vaginal misoprostol—dose <50 μg | 1852.56 (1456.01–2325.54) | 0.82 (0.68–0.95) | 14 533.98 | Dominated |
| Oral misoprostol tablet—dose ≥50 μg | 1906.19 (1499.21–2384.89) | 0.82 (0.68–0.95) | 14 467.15 | Dominated |
| Vaginal PGE2 gel | 1935.79 (1517.97–2429.53) | 0.82 (0.67–0.95) | 14 402.37 | Dominated |
| Foley catheter | 1968.64 (1550.28–2463.38) | 0.82 (0.67–0.95) | 14 328.52 | Dominated |
| Intravenous oxytocin | 1977.39 (1536.48–2518.60) | 0.81 (0.66–0.95) | 14 195.63 | Dominated |
| Sustained release misoprostol insert | 1997.08 (1480.46–2597.86) | 0.81 (0.65–0.95) | 14 108.39 | Dominated |
| Vaginal PGE2 pessary—normal release | 2015.76 (1569.43–2533.94) | 0.81 (0.66–0.95) | 14 210.27 | Dominated |
| Intracervical PGE2 | 2033.03 (1614.6–2532.76) | 0.63 (0.53–0.74) | 10 617.17 | Dominated |
| Vaginal PGE2 pessary—slow release | 2036.15 (1602.91–2551.89) | 0.81 (0.66–0.95) | 14 162.42 | Dominated |
| Vaginal PGE2 tablet | 2042.64 (1638.01–2565.19) | 0.81 (0.65–0.95) | 14 054.25 | Dominated |
| Extra‐amniotic PGE2 | 2093.96 (1567.05–2684.18) | 0.80 (0.65–0.95) | 13 982.18 | Dominated |
| Double balloon or Cook's catheter | 2097.74 (1618.43–2682.10) | 0.80 (0.64–0.95) | 13 906.29 | Dominated |
| Oral misoprostol tablet—dose <50 μg | 2140.28 (1644.79–2738.28) | 0.80 (0.64–0.94) | 13 898.03 | Dominated |
| Nitric oxide | 2141.74 (1662.1–2676.64) | 0.82 (0.67–0.94) | 14 179.69 | Dominated |
| Mifepristone | 2202.28 (1709.58–2742.80) | 0.82 (0.69–0.95) | 14 210.41 | Dominated |
| Placebo (No intervention) | 2304.82 (1847.79–2822.48) | 0.81 (0.65–0.94) | 13 788.52 | Dominated |
Titrated (low‐dose) oral misoprostol solution had the highest expected utility, very closely followed by buccal/sublingual misoprostol, mifepristone, intravenous oxytocin with amniotomy, and vaginal misoprostol (dose ≥ 50 μg). Intracervical PGE2 had the lowest expected utility. The majority of interventions had no more than a 0.02 differ‐ence in expected utility between them, although these estimates are very uncertain. A decision between these interventions is therefore largely driven by minimising expected total costs.
Any intervention that has a higher expected cost and lower expected utility than another intervention is said to be dominated by that intervention. Table 2 shows that all treatments apart from titrated low dose oral misoprostol solution were dominated by buccal/sublingual misoprostol, which was more effective in terms of increased utility and less expensive than the other interventions.
As titrated (low‐dose) oral misoprostol solution has a higher expected total utility than buccal/sublingual misoprostol, an ICER of £21 190 was computed. This is interpreted as the additional cost we would expect to have to pay in order to increase utility by a single unit for titrated (low‐dose) oral misoprostol compared with buccal/sublingual misoprostol.
The expected net benefit at a £20 000 willingness‐to‐pay threshold is highest for buccal/sublingual misoprostol (£14 669), closely followed by titrated (low dose) oral misoprostol solution (£14 658) and intravenous oxytocin with amniotomy (£14 652), and lowest for intracervical PGE2 (£10 617).
Figure S2 shows the cost‐effectiveness acceptability curve, showing that at any willingness‐to‐pay value up to about £23 000, buccal/sublingual misoprostol has the highest probability of being cost‐effective. Above this threshold, titrated low‐dose oral misoprostol solution has the highest probability of being cost‐effective. This probability is never >35%, indicating a large degree of uncertainty in the optimal intervention.
Subgroup analyses
Two subgroup analyses were carried out, the first focusing on women with intact membranes and the second on women with an unfavourable cervix. In the subgroup of women with intact membranes and limiting to interventions feasible in the UK NHS, intravenous oxytocin with amniotomy was identified as being the intervention with the highest expected net benefit and the optimal intervention at any willingness‐to‐pay value. However, there was, again, a lot of uncertainty in this estimate, with buccal/sublingual misoprostol and titrated (low‐dose) oral misoprostol also with a moderate probability of being most cost‐effective.
Buccal/sublingual misoprostol and titrated low‐dose oral misoprostol solution were found to be the interventions most likely to be cost‐effective in women with an unfavourable cervix.
Sensitivity analyses
Results were robust to assumptions on the utilities parameters.
Discussion
Main findings
Overall, the results from the NMAs suggest that misoprostol and oxytocin with amniotomy (for women with favourable cervix) are more successful than other agents in achieving VD24. The safety of different methods is less clear and we note the considerable uncertainty around effect estimates.
The cost‐effectiveness analysis suggested that titrated (low‐dose) oral misoprostol solution resulted in the highest utility, whereas buccal/sublingual misoprostol had the lowest cost. Again we note the high degree of uncertainty in our estimates of cost‐effectiveness.
Strengths and limitations
Although this is not the first NMA in obstetrics,28 to our knowledge this is the first obstetric NMA to compare multiple competing treatments in a cost‐effectiveness analysis. We took considerable effort to include all RCTs with no language restrictions. Previous head‐to‐head studies have suggested that PGE2 gel was more cost‐effective than PGE2 tablets10 and Foley catheter induction was more cost‐effective than PGE2 gel.29 These results are not directly comparable with the results from our study because they use different measures of benefit but, in our cost‐effectiveness analysis, these interventions were found to be less effective and more expensive than titrated (low‐dose) oral misoprostol solution and vaginal misoprostol (≤50 μg).
Unfortunately, not all trials provided data on our key outcomes; caesarean section was well reported but VD24 (our main efficacy outcome) was reported in fewer than a quarter of trials. Maternal mortality, severe maternal morbidity and infant mortality event rates were very low and too infrequently reported to make pooled analysis possible.
The cost‐effectiveness analysis was confined to short‐term outcomes up until discharge from hospital. Clearly, some outcomes may have a longer‐term impact on women and their families, and also on NHS resources. We had sufficient information to estimate cost‐effectiveness for only 20 out of 31 interventions and so our conclusions on cost‐effectiveness are limited to this subset of interventions. Lack of evidence for some model parameters (e.g. the ratio of the probability of NICU admission in women with caesarean section compared with vaginal delivery) meant that we relied on data from the Liverpool Women's Hospital, which were readily available to us. We therefore assume that this hospital is representative of hospitals across England and Wales.
Interpretation
Our findings that buccal/sublingual and titrated low‐dose oral misoprostol may be the most cost‐effective is at odds with the current NICE guidelines6 that do not recommend misoprostol in any form, and with World Health Organization30 recommendations of either oral misoprostol 25 μg 2‐hourly or 25 μg vaginally. Although formal pharmacokinetic and dose‐ranging studies in term pregnancy have never been carried out, it is unlikely that there are important differences between solution and tablets. It is worth pointing out that oral solution was used in early clinical studies only because low‐dose tablets were not available and 200 μg tablets had to be cut into small pieces. It is unclear to what extent a titration against contractions (escalating the dose in the absence of contractions and omitting a dose when contractions appear adequate) contributes to clinical effectiveness.
Our main measure of efficacy was whether treatments resulted in VD24. This definition of efficacy may be controversial given that cervical ripening has often been regarded as a distinctly different process from induction of labour. We argue that women and clinicians view cervical ripening and labour induction as part of the same seamless process with the main aim to achieve a safe vaginal birth of a healthy baby in the shortest time possible.
As we have seen from the results of the NMA there may be a trade‐off in terms of harms and benefits of different treatments—those agents that stimulate contractions and thereby achieve faster delivery may cause excessive uterine activity that may lead to problems for women and babies. Our cost‐effectiveness analysis attempted to capture these benefits and harms using the VD24, caesarean section and NICU admission outcomes. However, there are other important additional benefits and harms for both mother and baby that are not captured by our model.
We had expected that serious maternal and neonatal adverse events would be rare in the cohorts of women recruited to RCTs of induction of labour. Nevertheless, it was disappointing how infrequently mortality and serious morbidity were reported. Our assessment of safety was therefore limited to caesarean section, hyperstimulation with fetal heart changes, NICU admission and infant Apgar score; at best proxies for serious adverse events.
Observational data suggest that all prostaglandins (especially misoprostol) and oxytocin can cause uterine rupture with possible catastrophic consequences, particularly in women with previous caesarean section. Consequently, many trials included in the review excluded women with previous caesarean or with uterine scar for other reasons. The efficacy of induction agents that may cause excessive uterine activity must be seen in this context.
We took the view that country or setting was not likely to be a critical treatment effect modifier, because in all included RCTs intrapartum fetal monitoring and early access to caesarean section were available to most women. Hence, our findings are more likely to be applicable in high‐resource settings such as the NHS.
Very few trials considered women's views. Women need to be informed of the advantages and drawbacks of different methods of induction and to be aware that there is a choice of interventions available. The data from this NMA should facilitate introduction of a broader range of induction methods that should be offered in NHS settings.
Conclusions
Before any recommendations can be made about which intervention(s) are the safest, most effective and most cost‐effective for third‐trimester induction of labour, more research is needed. The considerable uncertainty in our findings, particularly in cost‐effectiveness estimates, points the way for further research When induction of labour is clinically indicated, a placebo or no intervention arm in a trial may not be feasible or ethical. Given the relatively high rates of hyperstimulation with buccal/sublingual misoprostol, we suggest that titrated low‐dose oral misoprostol should be used as a comparator, and future RCTs should be powered to detect a method that is more cost‐effective. Clearly, the fact that oral misoprostol is unlicensed for labour induction with virtually no pharmacokinetic data, poses a considerable research governance challenge.
We are conscious that, at present there are no internationally agreed core outcome sets for labour induction studies. Until such time, we urge all trialists to report all outcomes included in this review (including women's views) in future RCTs. It is also important to report results separately for all clinically important subgroups (e.g. parity, membrane and cervical status, and previous caesarean section) to facilitate subgroup analyses.
Finally, there is a need for well‐conducted studies to measure utilities from the perspective of the mother and baby. A large‐scale study measuring utilities (preferably using EQ‐5D) on antenatal and postnatal women, reporting results (together with uncertainty estimates) from both the mother's and baby's perspective including time post‐discharge, would be of great value in addressing some of the gaps in the evidence.
Disclosure of interest
Full disclosure of interests available to view online as supporting information.
Contribution to authorship
ZA contributed to the study conception, planning, analyses and writing up; EK carried out the statistical and economic analyses and contributed to writing up; TD contributed to study conception, carrying out the systematic review, analyses and writing up; NJW contributed to the study conception, planning, NMA analyses, economic analyses and writing up; NM contributed to carrying out the systematic review, analyses and writing up; SD contributed to the study conception, planning, NMA analyses and writing up; LJ contributed to carrying out the systematic review and writing up; and DMC contribu‐ted to the study conception, planning, NMA analyses and writing up.
Funding
HTA project was funded by the National Institute for Health Research (NIHR) UK.
Supporting information
Figure S1. Decision tree for comparison of different methods of induction.
Figure S2. Cost‐effectiveness acceptability curve.
Table S1. NHS reference costs 2012/13 for method of delivery and neonatal critical care admission.
Table S2. Costs of methods of induction.
Table S3. Utility estimates used in model.
Appendix S1. Search strategy.
Alfirevic Z, Keeney E, Dowswell T, Welton NJ, Medley N, Dias S, Jones LV, Caldwell DM. Methods to induce labour: a systematic review, network meta‐analysis and cost‐effectiveness analysis. . BJOG 2016;123:1462–1470.
Systematic review registration: PROSPERO 2013: CRD42013005116
References
- 1. DoH . National Audit Office. Maternity Services in England In: Health Do , editor. Session 2013–14. London: HMSO, 2013. [Google Scholar]
- 2. NHS . NHS Maternity Statistics, England 2010–11, December 1 2011, Maternity data reports, 2010–11. [www.ic.nhs.uk/pubs/maternity1011], 2011. Accessed 10 March 2015.
- 3. NHS . Welsh Government. Maternity Statistics: Method of Delivery 2001–2011 [wales.gov.uk/docs/statistics/2012/120131sdr132012en.pdf], 2012. Accessed 10 March 2015.
- 4. ONS . Office of National Statistics [www.ons.gov.uk/ons/rel/vsob1/birth-summary-tables-england-and-wales/2013/stb-births-in-englandand-wales-2013.html], 2013. Accessed 17 March 2015.
- 5. Vogel JP, Gulmezoglu AMM, Hofmeyr GJ, Temmerman M. Global perspectives on elective induction of labor. Clin Obstet Gynecol 2014;57:331–42. [DOI] [PubMed] [Google Scholar]
- 6. NCC‐WCH . National Collaborating Centre for Women and Children's Health. Induction of Labour. Clinical Guideline. London: NICE, 2008. [Google Scholar]
- 7. Eddama O, Petrou S, Schroeder L, Bollapragada SS, Mackenzie F, Norrie J, et al. The cost‐effectiveness of outpatient (at home) cervical ripening with isosorbide mononitrate prior to induction of labour. BJOG 2009;116:1196–203. [DOI] [PubMed] [Google Scholar]
- 8. Kaimal AJ, Little SE, Odibo AO, Stamilio DM, Grobman WA, Long EF, et al. Cost‐effectiveness of elective induction of labor at 41 weeks in nulliparous women. Am J Obstet Gynecol 2011;204(137):e1–9. [DOI] [PubMed] [Google Scholar]
- 9. Vijgen SMC, Koopmans CM, Opmeer BC, Groen H, Bijlenga D, Aarnoudse JG, et al. An economic analysis of induction of labour and expectant monitoring in women with gestational hypertension or pre‐eclampsia at term (HYPITAT trial). BJOG 2010;117:1577–85. [DOI] [PubMed] [Google Scholar]
- 10. Petrou S, Taher S, Abangma G, Eddama O, Bennett P. Cost‐effectiveness analysis of prostaglandin E2 gel for the induction of labour at term. BJOG 2011;118:726–34. [DOI] [PubMed] [Google Scholar]
- 11. Higgins J, Green S, editors. Cochrane Handbook for Systematic Reviews of Interventions Version 5.1.0 [updated March 2011]. The Cochrane Collaboration, 2011. [www.cochrane-handbook.org], 2011. Accessed 10 March 2015.
- 12. Wood L, Egger M, Gluud LL, Schulz KF, Juni P, Altman DG, et al. Empirical evidence of bias in treatment effect estimates in controlled trials with different interventions and outcomes: meta‐epidemiological study. BMJ 2008;336:601–5. [DOI] [PMC free article] [PubMed] [Google Scholar]
- 13. Caldwell DMAA, Higgins JPT. Simultaneous comparison of multiple treatments: combining direct and indirect evidence. BMJ 2005;331:879–900. [DOI] [PMC free article] [PubMed] [Google Scholar]
- 14. Caldwell DMWN. Ades AE Mixed treatment comparisons methods provide internally coherent treatment effect estimates based on overviews of reviews, and may reveal inconsistency. J Clin Epidemiol 2010;63:875–82. [DOI] [PubMed] [Google Scholar]
- 15. Dias S, Ades A, Sutton A, Welton N. Evidence synthesis for decision making 2: a generalized linear modeling framework for pairwise and network meta‐analysis of randomized controlled trials. Med Decis Making 2013;33:607–17. [DOI] [PMC free article] [PubMed] [Google Scholar]
- 16. Glenny AM, Altman DG, Song F, Sakarovitch C, Deeks JJ, D'Amico R, et al. Indirect comparisons of competing interventions. Health Technol Assess 2005;9:1–134 , iii–iv. [DOI] [PubMed] [Google Scholar]
- 17. Salanti G. Indirect and mixed‐treatment comparison, network, or multiple‐treatments meta‐analysis: many names, many benefits, many concerns for the next generation evidence synthesis tool. Res Synth Methods 2012;3:80–97. [DOI] [PubMed] [Google Scholar]
- 18. OpenBUGS. [www.openbugs.net/]. Accessed 10 March 2015.
- 19. The BUGS project . DIC: Deviance Information Criterion. How does DIC depend on the parameterisation used? [www.mrc-bsu.cam.ac.uk/software/bugs/the-bugs-project-dic/#q9]. Accessed 25 January 2016.
- 20. Welton N, Sutton A, Cooper N, Abrams K, Ades A. Evidence Synthesis for Decision Making in Healthcare. Chichester: Wiley; 2012. [Google Scholar]
- 21. Dias S, Welton NJ, Sutton AJ, Caldwell DM, Lu G, Ades AE. Evidence synthesis for decision making 4: inconsistency in networks of evidence based on randomized controlled trials. Med Decis Making 2013;33:641–56. [DOI] [PMC free article] [PubMed] [Google Scholar]
- 22. Alfirevic Z, Keeney E, Dowswell T, Welton NJ, Medley N, Dias S, et al. Which method is best for the induction of labour: a systematic review, network meta‐analysis and cost‐effectiveness analysis. Health Technol Assess 2016; in press. [DOI] [PMC free article] [PubMed] [Google Scholar]
- 23. NICE . National Institute for Clinical Excellence. Guide to the Methods of Technology Appraisal. London: NICE, 2004. [Google Scholar]
- 24. Department of Health . NHS Reference Costs 2012 to 2013. London: Department of Health; 2013. [Google Scholar]
- 25. Joint Formulary Committee . British National Formulary (online). London: BMJ Group and Pharmaceutical Press, [www.medicinescomplete.com]. Accessed 20 October 2014. [Google Scholar]
- 26. Pham CT, Crowther CA. Birth outcomes: utility values that postnatal women, midwives and medical staff express. BJOG 2003;110:121–7. [PubMed] [Google Scholar]
- 27. Turner CE, Young JM, Solomon MJ, Ludlow J, Benness C, Phipps H. Vaginal delivery compared with elective caesarean section: the views of pregnant women and clinicians. BJOG 2008;115:1494–502. [DOI] [PubMed] [Google Scholar]
- 28. Haas DM, Caldwell DM, Kirkpatrick P, McIntosh JJ, Welton NJ. Tocolytic therapy for preterm delivery: systematic review and network meta‐analysis. BMJ 2012;345:e6226. [DOI] [PMC free article] [PubMed] [Google Scholar]
- 29. van Baaren GJ, Jozwiak M, Opmeer BC, Oude Rengerink K, Benthem M, Dijksterhuis MGK, et al. Cost‐effectiveness of induction of labour at term with a Foley catheter compared to vaginal prostaglandin E2 gel (PROBAAT trial). BJOG 2013;120:987–95. [DOI] [PubMed] [Google Scholar]
- 30. Tang J, Kapp N, Dragoman M, de Souza JP. WHO recommendations for misoprostol use for obstetric and gynecologic indications. Int J Gynaecol Obstet 2013;121:186–9. [DOI] [PubMed] [Google Scholar]
Associated Data
This section collects any data citations, data availability statements, or supplementary materials included in this article.
Supplementary Materials
Figure S1. Decision tree for comparison of different methods of induction.
Figure S2. Cost‐effectiveness acceptability curve.
Table S1. NHS reference costs 2012/13 for method of delivery and neonatal critical care admission.
Table S2. Costs of methods of induction.
Table S3. Utility estimates used in model.
Appendix S1. Search strategy.