SUMMARY
Brain metastasis represents a substantial source of morbidity and mortality in various cancers, and is characterized by high resistance to chemotherapy. Here we define the role of the most abundant cell type in the brain, the astrocyte, in promoting brain metastasis. Breast and lung cancer cells express protocadherin 7 (PCDH7) to favor the assembly of carcinoma-astrocyte gap junctions composed of connexin 43 (Cx43). Once engaged with the astrocyte gap-junctional network, brain metastatic cancer cells employ these channels to transfer the second messenger cGAMP to astrocytes, activating the STING pathway and production of inflammatory cytokines IFNα and TNFα. As paracrine signals, these factors activate the STAT1 and NF-κB pathways in brain metastatic cells, which support tumour growth and chemoresistance. The orally bioavailable modulators of gap junctions meclofenamate and tonabersat break this paracrine loop, and we provide proof-of-principle for the applicability of this therapeutic strategy to treat established brain metastasis.
Brain metastases occur in 20-40% of advanced stage cancers and represent the most prevalent adult intracranial malignancy1. Current clinical management of brain metastases affords limited disease control and most patients succumb to tumour progression less than twelve months after diagnosis1,2; better therapeutic strategies are urgently needed. Recent work has begun to describe the cellular and molecular interactions responsible for brain metastasis. Circulating cancer cells first traverse the blood-brain barrier (BBB)3,4 to enter the parenchyma where they co-opt the microvasculature5,6. However, the vast majority of cancer cells that infiltrate the brain perish, rejected by astrocytes6. The astrocyte network serves a protective role in the CNS7,8. In brain metastasis, reactive astrocytes generate the protease plasmin and cytotoxic cytokines. Brain metastatic cells counter this defense with serpin inhibitors of plasminogen activator6. Yet, astrocyte-cancer cell interactions may not be uniformly antagonistic: brain metastases contain abundant reactive astrocytes8, and astrocytes can exert a beneficial effect on cancer cell co-cultures9.
Here, we show that brain metastatic cells selectively establish Cx43 gap junctions with astrocytes by means of protocadherin 7 (PCDH7). These channels allow for passage of cGAMP from cancer cells to astrocytes to activate STING, an innate immune response pathway to cytosolic double-stranded DNA (dsDNA)10. The resulting astrocyte production of interferon (IFN)-α and tumour necrosis factor (TNF)-α supports growth and chemoresistance in brain metastatic cells. Pharmacologic inhibition of these gap junctions in mice suppresses brain metastasis.
Brain metastasis linked to Cx43 gap junctions
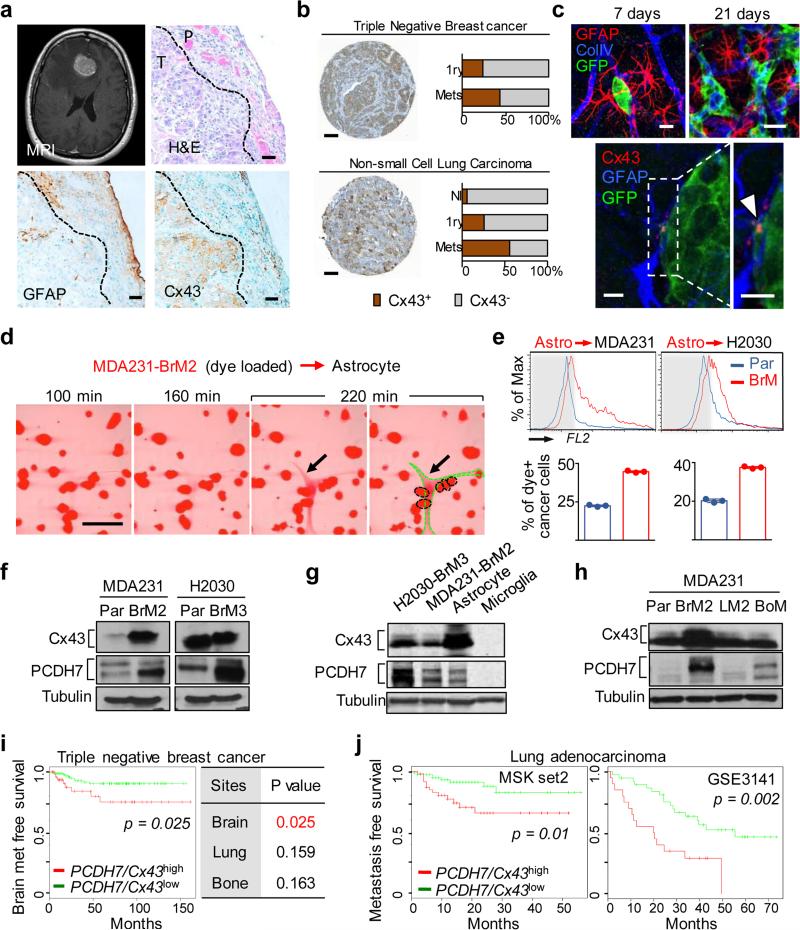
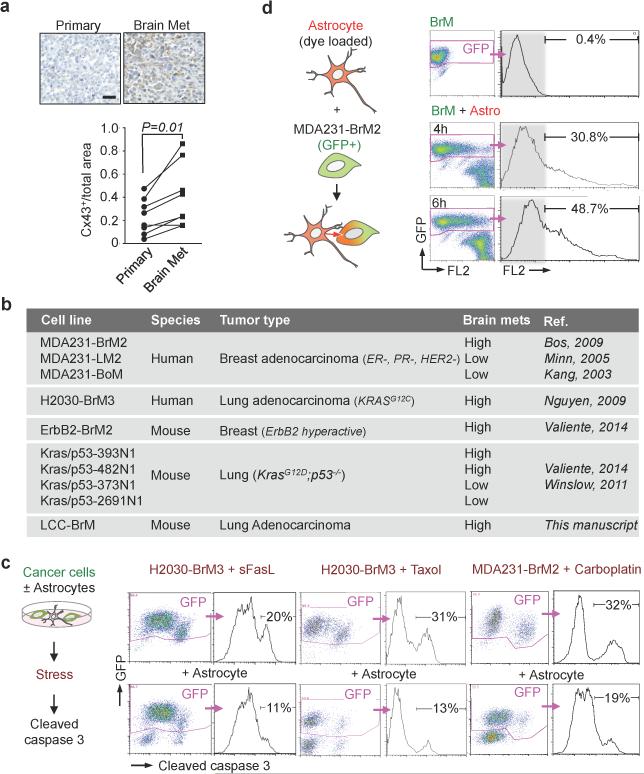
GFAP-positive reactive astrocytosis is a hallmark of brain metastasis (Fig. 1a). Astrocytes interact in a gap-junction network with connexin 43 (Cx43) one of the principal gap junction proteins in these cells11. Cx43 is present in brain metastases, including cancer cell-astrocyte interfaces (Fig 1a). In triple-negative breast cancer and non-small cell lung cancer (NSCLC), we found a higher level of Cx43 staining in brain metastases than in primary tumours or normal tissues (Figure 1b, Extended Data Figure 1a). To characterize these cancer cell-astrocyte interactions, we employed five brain metastatic models derived from mammary (MDA231-BrM2, ErbB2-BrM) or lung adenocarcinomas (H2030-BrM3, 393N1, LLC-BrM), of human or murine origin (Extended Data Fig. 1b)3,6,12,13. These lesions display Cx43 expression at the cancer cell-astrocyte interface (Fig. 1c). In each of these models, co-culture with astrocytes protected cancer cells from chemotherapy and the pro-apoptotic cytokine FasL (Extended Data Fig. 1c), congruent with previous in vitro findings9 and suggesting a dual role for astrocytes in brain metastasis.
Figure 1. Cx43 and PCDH7 are associated with brain metastasis.
a, Upper Left: Contrast-enhanced MRI of representative patient with brain metastasis. Tumor (white) is surrounded by parenchymal reaction (dark grey). Upper Right: Hematoxallin-Eosin staining (H&E) of resected brain metastasis (T) and parenchyma (P). Lower Panels: Immunohistochemistry of adjacent sections for GFAP (Lower Left) and Cx43 (Lower Right). Scale bar, 10 μm. (n = 6 patient samples) b, Cx43 expression is increased in brain metastases compared with primary and normal tissue. Representative images of Cx43 staining in clinical samples from triple-negative breast cancer (TNBC) and non-small cell lung carcinoma (NSCLC). Proportion of CX43-positive samples was quantified in primary (1ry) tumours (TNBC n = 98, NSCLC n = 138), brain metastases (Mets) (TNBC n= 117; NSCLC n = 91) and normal lung tissues (n = 75) Scale bar, 100 μm. c, Upper: GFP+ H2030-BrM3 cells (green) are surrounded by GFAP+ activated astrocytes (red) in the brain parenchyma at early (day 7) and later (day 21) time points following intracardiac inoculation in mice. Blue, collagen IV (ColIV) staining in vessels. Scale bar, 10 μm. Lower: Cx43 staining (arrowhead) at the interface of GFP+ H2030-BrM3 (green) and GFAP+ astrocytes (blue). Scale bar, 10 μm. d-e, Gap junction communication between astrocytes and BrM cells. d, Time-lapse images of dye transfer from MDA231-BrM2 cells to astrocytes. See also Supplementary Information Video S1. Scale bars, 100 μm. e, Quantification of dye transfer from astrocytes to cancer cells. Histograms show red fluorescent signal in parental (Par) and BrM cells. Values are mean ± S.E.M. (Data are from n=3 biological replicates over 3 independent experiments). f-i, Cx43 and PCDH7 western immunoblotting in the indicated parental and brain metastatic derivatives (f, n=3 independent experiments), in brain metastatic cells compared to brain cell types (g, n=2 independent experiments), and in MDA231 derivatives metastatic to brain, lung (LM) or bone (BoM) (h, n=2 independent experiments). Full blots are shown in Supplementary Data. i-j, Kaplan-Meier plots of brain metastasis-free survival in 189 cases of triple-negative breast cancer (i) and 129 cases (MSKCC set2) and 58 cases (GSE3141) of lung adenocarcinoma (j), based on Cx43/PCDH7 expression in the primary tumour.
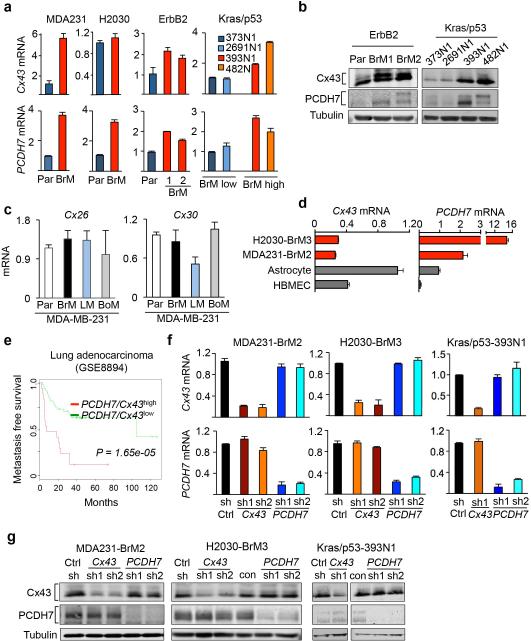
Gap junctions are formed by hexameric connexin hemi-channels and allow for passage of cytoplasmic molecules between cells14. We observed time-dependent transfer of calcein from brain metastatic cells to astrocytes by time-lapse fluorescence microscopy (Fig. 1d; Supplementary Information Video S1), and from astrocytes to metastatic cells by flow cytometry (Fig. 1e, Extended Data Fig. 1d). Astrocyte calcein transfer occurred more readily with brain metastatic cells than with their parental counterparts (Fig. 1e). This phenotype was not fully explained by brain metastatic cell expression of Cx43 (Fig. 1f, Extended Data Fig. 2a,b) or other astrocytic connexins (Cx26, Cx30) (Extended Data Fig. 2c). Cx43 expression was higher in astrocytes than the brain metastatic cells (Fig. 1g, Extended Data Fig. 2d).
Reasoning that cancer cells must use another component besides Cx43 to engage astrocytes, we investigated PCDH7, one of a small group of genes upregulated in brain metastatic cells from both breast and lung tumours3,6,12. Protocadherins are integral membrane proteins that direct cell-cell contacts by homophilic interaction. PCDH7 (cadherin-related neuronal receptor) is the sole protocadherin expressed predominantly in the brain15,16. PCDH7 levels were higher in brain metastatic derivatives than in parental cell lines (Fig. 1f, Extended Data Fig. 2a,b) or in matched derivatives highly metastatic to bone or lung but not brain (Fig. 1h; refer to Extended Data Fig. 1b). The PCDH7 level in brain metastatic cells was higher than in astrocytes, microglia or endothelial cells (Fig. 1g, Extended Data Fig. 2d).
In clinical cohorts of triple-negative breast cancer, expression of PCDH7 and Cx43 in primary tumours was associated with brain, but not bone or lung metastasis (Fig. 1i). Up to 70% of relapses in patients with NSCLC include brain metastases17; contributing disproportionately to survival18. Cx43 and PCDH7 expression was associated with decreased metastasis-free survival of NSCLC patients in three cohorts (Fig. 1j, Extended Data Fig. 2e). These results all support the relevance of PCDH7 and Cx43 in brain metastasis.
PCDH7 directs carcinoma-astrocyte gap junctions
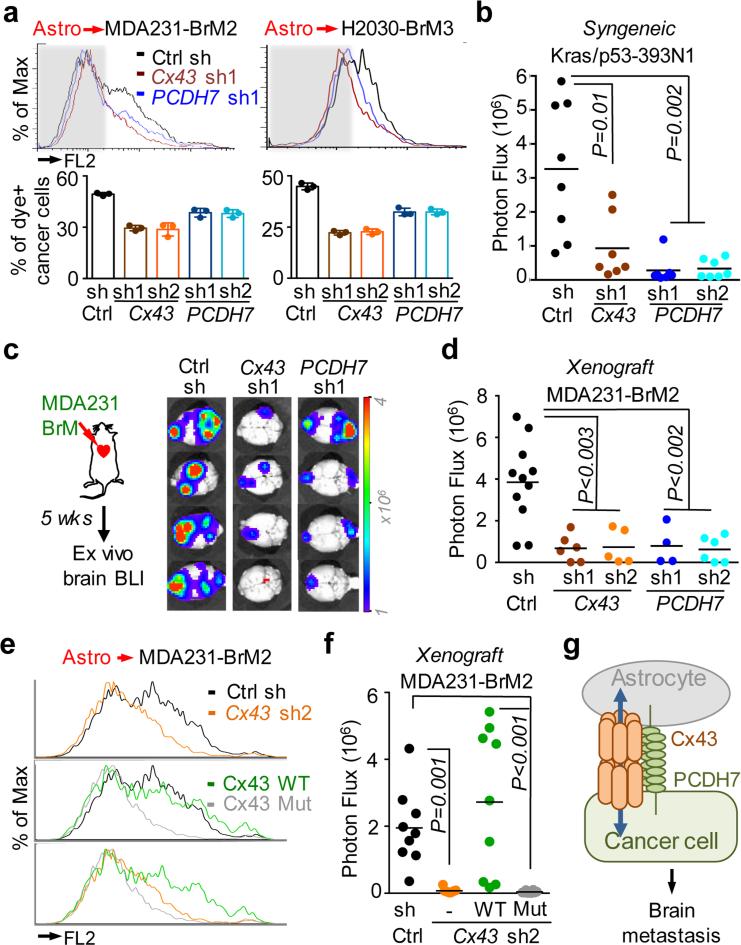
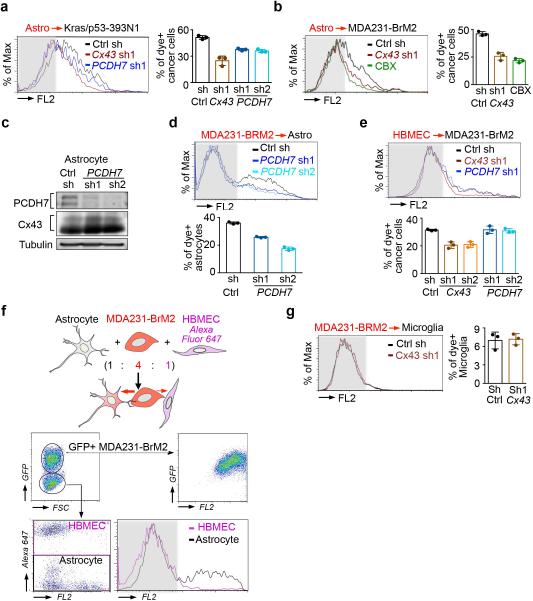
Brain-metastatic cells depleted of either PCDH7 or Cx43 with short hairpin RNAs (shRNA) (Extended Data Fig. 2f,g) showed reduced capacity for dye transfer to astrocytes (Fig 2a, Extended Data Fig. 3a), on par with the pan-connexin inhibitor, carbenoloxone (Extended Data Fig 3b). Cadherins may establish homophilic binding between adjacent cells19. We hypothesized that astrocyte PCDH7 might participate in the formation of gap junctions with brain metastatic cancer cells, similar to gap junctions between astrocytomas and neighboring astrocytes20,21. Indeed, PCDH7 depletion in astrocytes (Extended Data Fig. 3c) inhibited dye transfer from MDA231-BrM2 cells (Extended Data Fig. 3d).
Figure 2. Cx43/PCDH7 carcinoma-astrocyte gap junctions mediate brain metastasis.
a, Histograms (top) and quantification (bottom) of dye transfer from astrocytes to control and Cx43-depleted or PCDH7-depleted brain metastatic cells. Values are mean ± S.E.M. (Data are from n=3 biological replicates over 3 independent experiments). b-d, BLI (c) and quantification (b, d) of brain metastatic lesions formed by control, Cx43-depleted, or PCDH7-depleted brain metastatic cells in the MDA231 xenograft model or 393N1 syngeneic models of brain metastasis. Data are from n=3 independent experiments, n=8-10 mice per group. All source data from mouse experiments are in Supplementary Information. e,f, Wild type (WT) or T154A mutant (Mut) Cx43 was re-expressed in Cx43-depleted MDA231-BrM2 cells (Cx43 sh2). The cells were subjected to astrocyte dye transfer analysis by flow cytometry (e, 3 independent experiments), or to brain metastasis assays and BLI quantification (f, n=2 independent experiments, 9 mice per group). g, Schematic summary of Cx43- and PCDH7-mediated interactions between cancer cells and astrocytes in brain metastasis.
Human brain microvascular endothelilal cells (HBMECs) have no detectable PCDH7 expression and express low levels of Cx43 (Extended Data Fig. 2d). Despite low gap junction communication between cancer cells and HBMECs (Extended Data Fig. 3e), dye transfer between cancer cell and astrocyte was favored over dye transfer between cancer cell and HBMEC (Extended Data Fig 3f). Primary microglia cells expressed very low levels of Cx43 and PCDH7 and did not accept calcein from cancer cells (Extended Data Fig 3g). Thus, PCDH7 directs cancer cells to preferentially form Cx43 gap junctions with astrocytes.
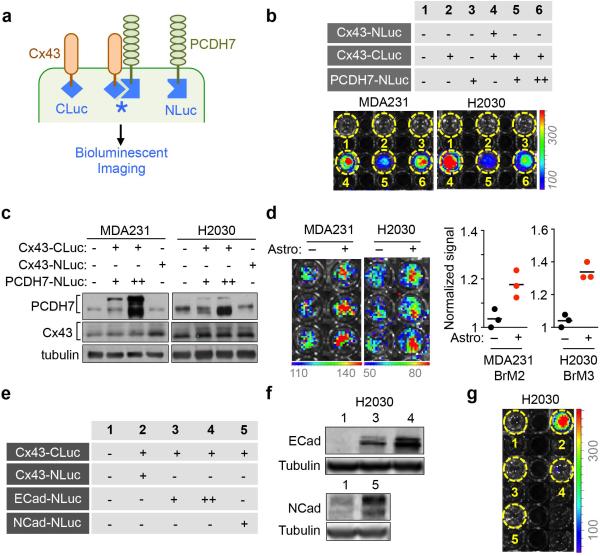
To detect CX43-PCDH7 interactions in live cells, we employed a split luciferase complementation assay22. Constructs encoding PDCH7 and Cx43 fused to the N-terminal (NLuc) and C-terminal (CLuc) halves of firefly luciferase were expressed in non-GFP-luciferase labeled parental cells. When NLuc and CLuc cytoplasmic domains come into proximity, luciferase activity is reconstituted (Extended Data Fig. 4a). Cx43 self-assembly served as positive control. We detected specific luciferase activity in cells expressing both Cx43-CLuc and PCDH7-NLuc (Extended Data Fig 4b), consistent with Cx43 and PCDH7 interaction within the same cell. The expression level of PCDH7 and Cx43 luciferase chimeras was comparable to endogenous levels (Extended Data Fig. 4c). Astrocytes increased luciferase signal in cancer cells after co-culture (Extended Data Fig. 4d) suggesting that astrocyte Cx43 and PCDH7 induce further clustering of cancer cell Cx43-CLuc and PCDH7-NLuc. No interaction was detected between Cx43-CLuc and N-cadherin or E-cadherin fused with NLuc (Extended Data Fig. 4e-g).
Cx43 and PCDH7 mediate brain metastasis
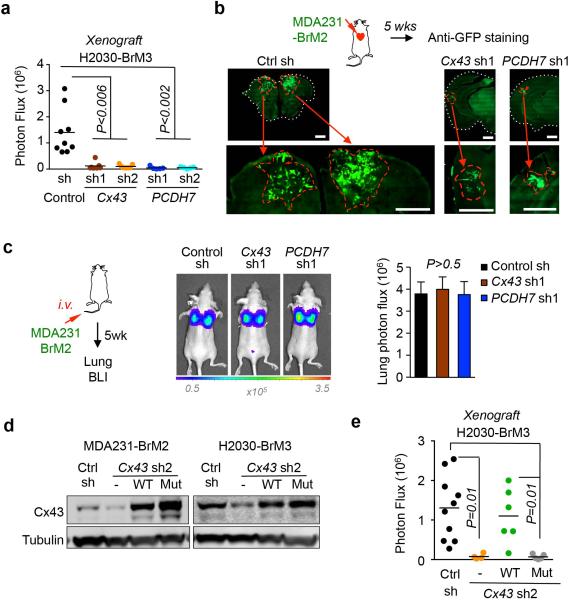
shRNA-mediated depletion of either Cx43 or PCDH7 in breast cancer and lung cancer cells inhibited brain metastases growth in both immunocompetent (Fig. 2b) and xenograft models, (Fig 2c,d, Extended Data Figure 5a,b); this did not affect the formation of lung lesions (Extended Data Fig. 5c).
The Cx43(T154A) mutant assembles hemichannels but lacks channel function23. Cx43(T154A) re-expressed in Cx43-depleted brain metastatic cancer cells (Extended Data Fig. 5d) was unable to mediate calcein transfer from astrocyte to MDA231-BrM cells (Fig. 2f). Wild-type Cx43 rescued brain metastatic activity in Cx43-depleted MDA231-BrM and H2030-BrM cells, whereas Cx43(T154A) did not (Fig. 2g, Extended Data Fig. 5e). These observations support a model whereby PCDH7 directly interacts with Cx43 to assemble functional gap junctions between cancer cells and astrocytes (Fig. 2h).
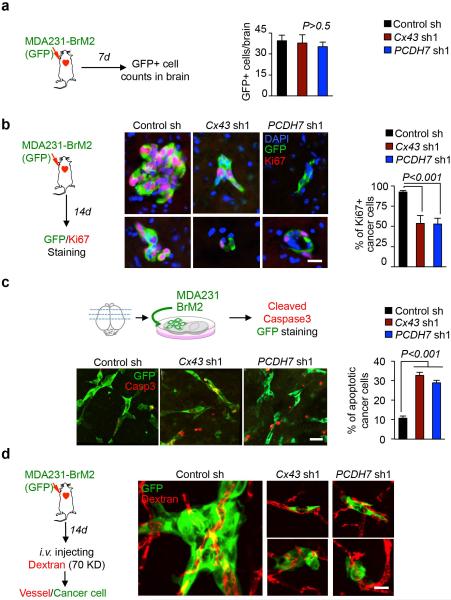
We defined the stage at which PCDH7 and Cx43 contribute to the formation of brain metastases using short-term metastasis assays with MDA231-BrM2 cells. In this model, extravasation across the BBB is complete 7 days post-inoculation, vascular cooption and overt outgrowth occur by day 146. Cx43 or PCDH7 depletion in the cancer cells did not significantly diminish the number of GFP+ cancer cells in the brain parenchyma at day 7 (Extended Data Fig. 6a). Fourteen days after inoculation, micrometastases resulting from Cx43- or PCDH7-depleted cells showed decreased proliferation (Extended Data Fig. 6b). In ex-vivo brain slice assay6, Cx43- or PCDH7-depleted cells displayed increased cleaved caspase 3 staining (Extended Data Fig. 6c) and maintained vascular contacts (Extended Data Fig. 6d). Thus, cancer cell-astrocyte gap junction channels support brain metastasis growth after extravasation and vascular cooption.
Cancer cells trigger astrocyte cytokine release
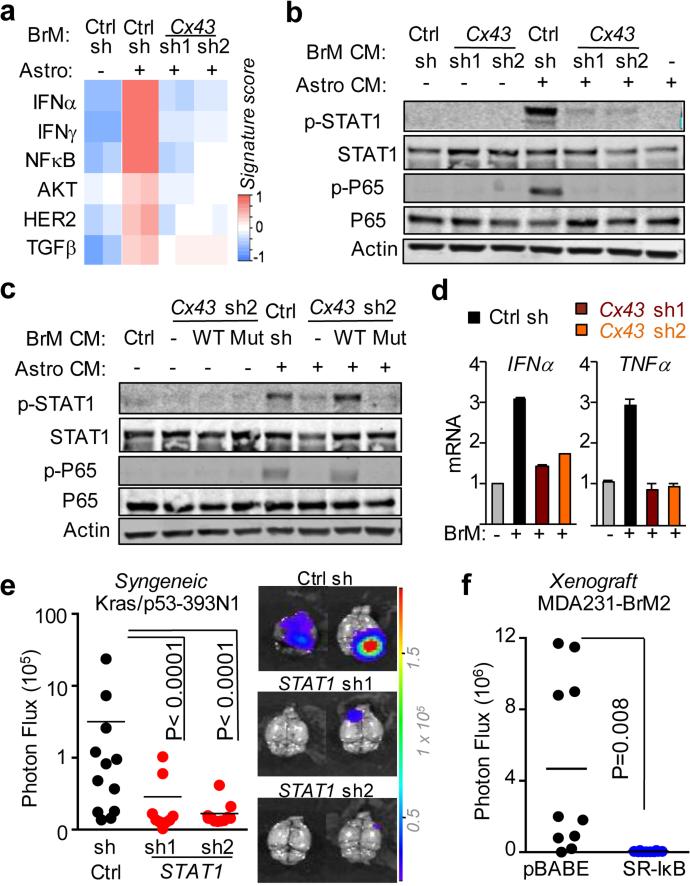
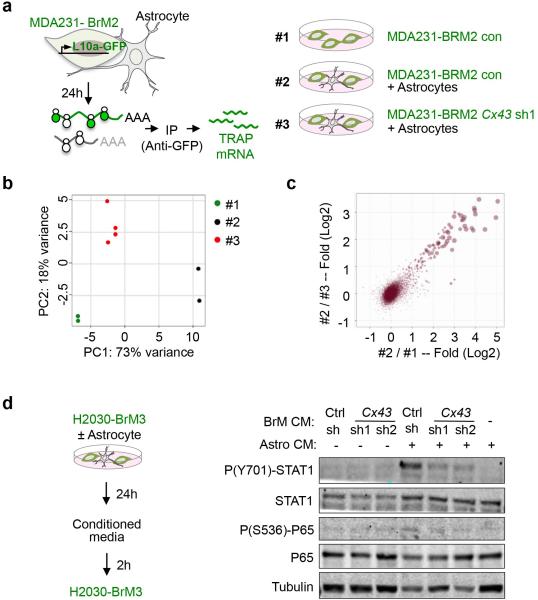
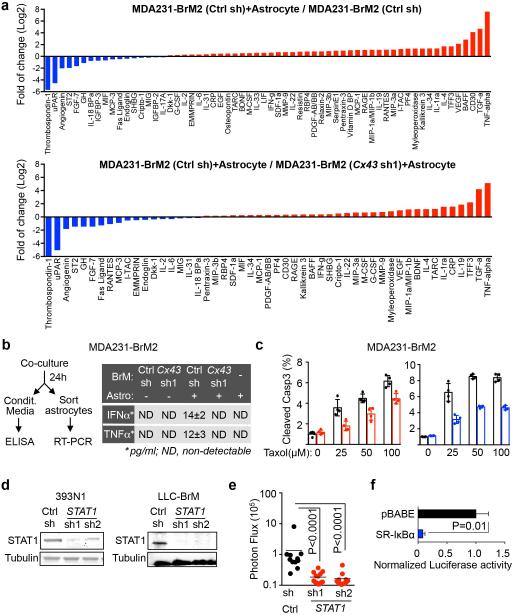
To determine the mechanism behind Cx43-mediated brain metastatic growth, we assayed cancer cell gene expression by translating ribosome affinity purification (TRAP)24 (Extended Data Fig 7a). We expressed the eGFP-tagged L10a ribosomal subunit in MDA231-BrM2 cells with either basal or reduced Cx43 expression. After cancer cell-astrocyte co-culture, we immunoprecipitated eGFP-tagged polysomes and sequenced the associated mRNA (Extended Data Fig 7b-c). The gene expression patterns revealed that interferon (IFN) and NF-κB pathways in brain metastatic cells were activated after astrocyte co-culture in a Cx43-dependent manner (Fig. 3a). Conditioned media from the co-cultures was sufficient to activate the IFN and NF-κB signaling in the cancer cells, as determined by phosphorylation of STAT1 and NF-κB p65 (Fig. 3b, Extended Data Fig. 7d). Cx43 channel function was required for this effect (Fig. 3c).
Figure 3. Gap junctions activate STAT1 and NF-κB pathways in cancer cells.
a, Signaling pathway analysis of TRAP-Seq data from MDA231-BrM2 cells after co-culture with astrocytes. Control (Ctrl) or Cx43-depleted MDA231-BrM2 cells expressing an L10a-GFP ribosomal protein fusion were co-cultured with astrocytes for 24 h prior to polysome immunoprecipitation and mRNA sequencing. Heatmap depicts blue (down-regulated) and red (up-regulated) pathways. n=2 biological replicates. b,c, STAT1 and NF-κB p65 phosphorylation in MDA231-BrM2 cells after a 2 h incubation with conditioned media (CM) from astrocyte co-culture. CM were collected after 24 h co-culture of astrocytes with control or Cx43-depleted MDA231-BrM2 cells (b), or from Cx43-depleted MDA231-BrM2 cells that were transduced with wild type Cx43 (WT) or Cx43(T154A) mutant (Mut) (c), n≥3 independent experiments both (b) and (c). d, Relative mRNA levels of IFNA and TNFA in human astrocytes re-isolated after co-culture with MDA231-BrM2 cancer cells. All values are mean ± S.E.M. (Data are n=3 biological replicates in 2 independent experiments). e-f, Quantification of BLI signal from brain metastases formed by control or STAT1-knockdown Kras/p53-393N1 cells (e), and SR-IκBα MDA231-BrM2 cells (f) (Data are from n=2 independent experiments, with 12 mice total per group).
IFNα, TNFα and TGFα accumulated in conditioned media from MDA231-BrM2-astrocyte co-cultures in a gap junction dependent manner (Fig. 3d, Extended Data Fig. 8a-b). MDA231-BrM2, either alone or co-cultured with astrocytes, did not express these cytokines by TRAP-RNAseq (data not shown). Upregulation of TNFα and TGFα mRNA was detected in astrocytes re-isolated after co-culture (Extended Data Fig 8b). Addition of IFNα or TNFα inhibited brain metastatic cancer cell apoptosis in response to chemotherapy (Extended Data Fig. 8c). In two syngeneic mouse models, knock down of STAT1 in brain metastatic cells (Extended Data Fig. 8d) reduced brain metastasis (Fig. 3e, Extended Data Fig. 8e). Inhibition of NF-κB by overexpression of IκBα super suppressor (SR-IκBα)25 in brain metastatic cells (Extended Data Fig. 8f) also suppressed brain metastasis (Fig. 3f). These results suggest that heterocellular gap junction communication elicits production of IFNα and TNFα in astrocytes, triggering STAT1 and NF-κB survival signals in cancer cells.
Cancer cells transfer cGAMP to astrocytes
Upregulation of both IFNα and TNFα was reminiscent of a cellular response to dsDNA26. Cytosolic dsDNA triggers the cGAS-STING pathway, an innate immune response against viral infection27, in which cyclic GMP-AMP synthase (cGAS) senses cytosolic dsDNA and synthesizes the second messenger 2’3’-cyclic GMP-AMP (cGAMP). cGAMP binding to STING triggers phosphorylation and activation of TBK1 and IRF3, nuclear accumulation of IRF3, and transcriptional activation of IRF3 target genes IFNA and TNFA10.
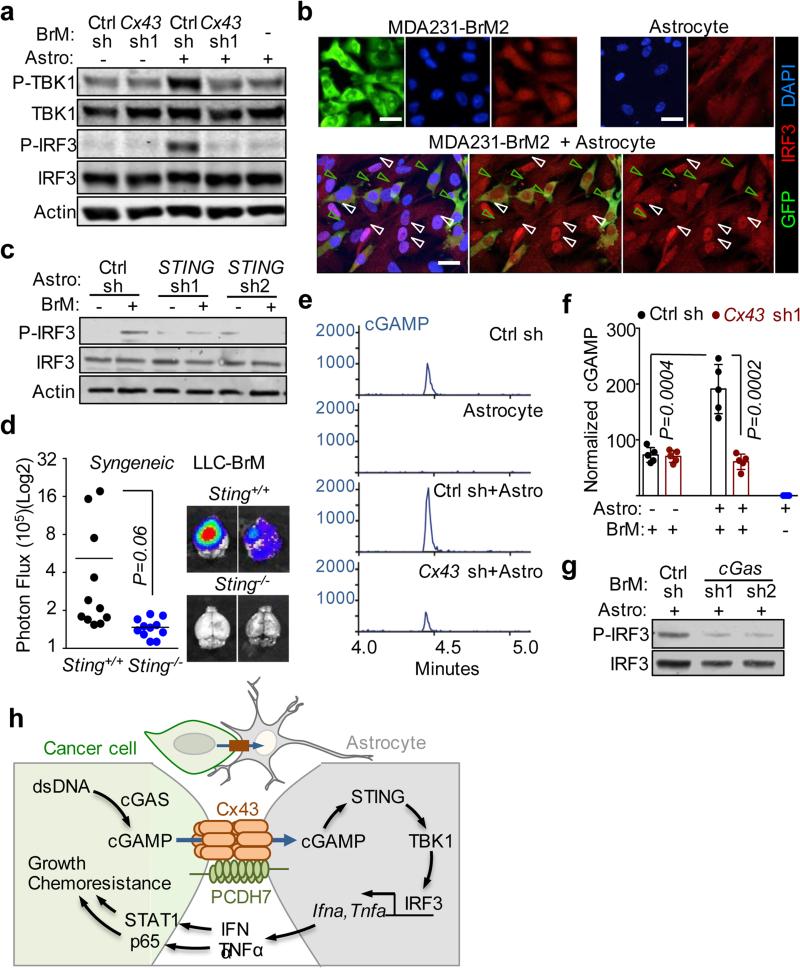
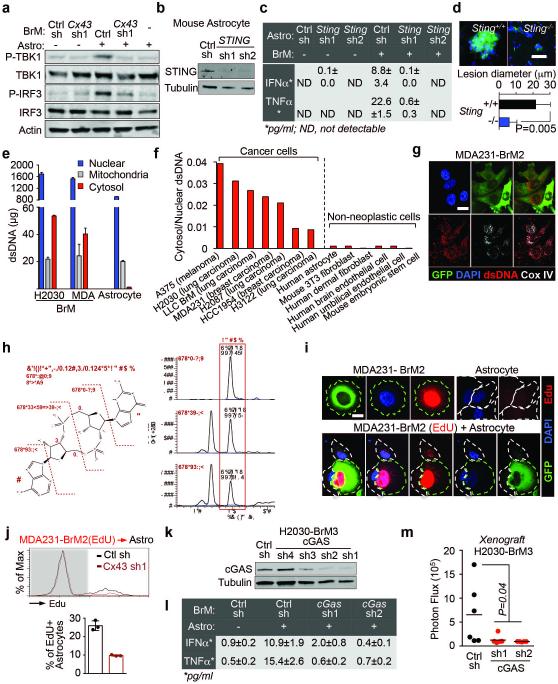
Co-incubation of MDA231-BrM2 cells and astrocytes triggered Cx43-dependent phosphorylation of TBK1 and IRF3 (Fig 4a, Extended Data Fig. 9a). Nuclear accumulation of IRF3 occurred only in co-cultured astrocytes, and not in either cell type alone (Fig. 4b). STING knock down in mouse astrocytes (Extended Data Fig. 9b) inhibited their ability to respond to mouse LLC-BrM cells with IRF3 phosphorylation (Fig. 4c), or IFNα and TNFα production (Extended Data 9c), indicating the need for STING activity in astrocytes. We inoculated LLC-BrM cells into syngeneic STING-mutant or wild-type C57Bl6 mice and found that host STING inactivation suppressed brain metastasis by these cells (Fig. 4d, Extended Data 9d).
Figure 4. Gap junctions induce cytosolic dsDNA response in astrocytes.
a, MDA231-BrM2 cells expressing control shRNA (Ctrl sh) or shRNA targeting Cx43, were cultured for 18 h with or without astrocytes, and subjected to immunobloting analysis of phosphorylated TBK1 and IRF3 (n=3 independent experiments). b, Representative images of dual immunofluorescent staining of IRF3 and GFP. DAPI, nuclear staining. In co-cultures: white arrows, nuclear accumulation of IRF3 in astrocytes; green arrows, even distribution of IRF3 in GFP+ MDA231-BrM2 cells. Scale bar, 20 μm. (n=2 independent experiments). c, Mouse astrocytes (Astro) expressing control shRNA (Ctrl sh) or shRNA targeting STING, were cultured for 18 h with or without LLC BrM cells (BrM), and subjected to immunobloting analysis of phosphorylated IRF3 (c); d, LLC BrM growth in syngeneic C57Bl6 mice hosts wild-type (+/+) or knock-out (−/−) for STING. Quantification of BLI signal from brain metastases formed in +/+ and −/− host mice (e). (n=11 mice in each group; 2 independent experiments). e, MDA231-BrM2 alone, astrocytes alone, or 18 h co-cultures, were harvested for sample preparation and cGAMP analysis by LC-MS/MS. Representative chromatograms (e) and quantitation (f) are presented (n= 5 biological replicates in 3 independent experiments). Refer also to Supplementary Material. g, Human astrocytes (Astro), were cultured for 18 h with or without H2030 BrM cells (BrM) expressing control shRNA (Ctrl sh) or shRNA targeting cGAS, and subjected to immunobloting analysis of phosphorylated IRF3, (2 independent experiments). h, Schematic summary of gap junction mediated anti-dsDNA response, production of IFNα and TNFα in astrocytes, and consequent activation of STAT1 and NF-κB pathways in cancer cells to support brain metastasis.
We next investigated the source of astrocyte STING activation. Subcellular fractionation (Extended Data Fig. 9e,f) and immunofluorsence (Extended Data Fig. 9g) showed cytosolic dsDNA in human cancer cell lines and not in astrocytes and other non-neoplastic human cells. We detected cGAMP by LC-MS/MS in MDA231-BrM2 cells, but not in astrocytes (Fig. 4e, Extended Data Fig. 9h). Co-culture of MDA231-BrM2 cells with astrocytes further increased cGAMP level in a Cx43-dependent manner (Fig. 4f). Given the presence of both cytosolic dsDNA and cGAMP in cancer cells, we next identified which molecule was responsible for astrocyte STING pathway activation. cGAS knockdown cancer cells (Extended Data Fig. 9k) did not induce significant IRF3 phosphorylation (Fig 4g), TNFα or IFNα production (Extended Data Fig 9l) in co-cultured astrocytes. Moreover, cGAS-depletion in cancer cells led to reduced brain metastasis (Extended Data Fig. 9m).
Together, these results support a model whereby brain metastatic cancer cells contain cytosolic dsDNA and cGAMP and engage astrocytes in Cx43-based gap junctions. The gap junctions allow passage of cGAMP from cancer cells into astrocytes to trigger TBK1 and IRF3 activation and production of IFNα and TNFα. These cytokines activate STAT1 and NF-κB signaling in cancer cells to support cancer cell growth and survival under microenvironmental and chemotherapeutic stresses (Fig. 4h).
Gap junction directed therapy
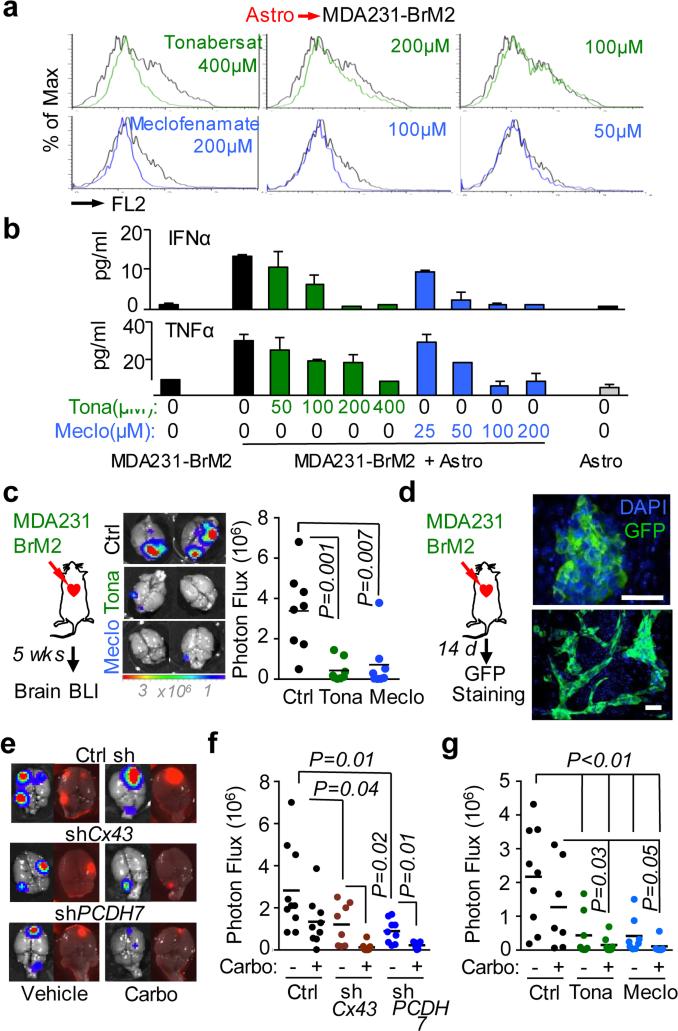
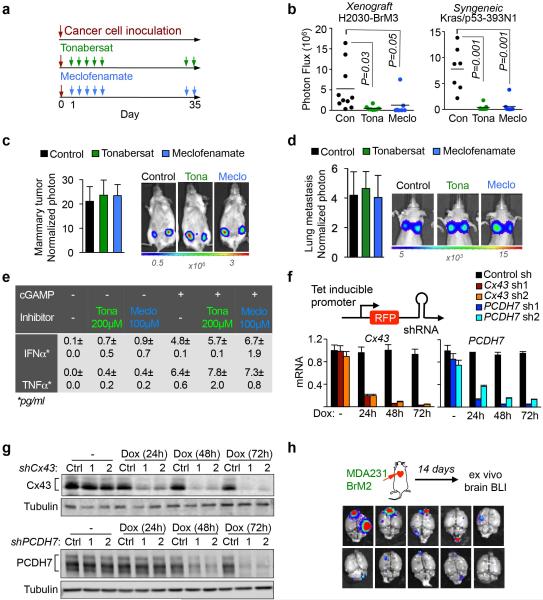
Genetic evidence that inhibition of gap junction signaling decreases brain metastasis prompted testing pharmacologic suppressors of gap junction activity. In addition to anti-inflammatory activity, meclofenamate inhibits Cx43 gap junction gating28 and inhibits epileptogenesis in animal models.29 Tonabersat is a benzopyran derivative that binds to a unique stereoselective binding site in astrocytes30,31 and inhibits gap-junction-mediated processes including cortical spreading depression32 and trigeminal ganglion neuronal-satellite cell signaling.33 Both tonabersat and meclofenamate inhibited dye transfer from astrocytes to cancer cells (Fig. 5a) and release of IFNα and TNFα in astrocyte cancer cell co-cultures (Fig. 5b). Treatment with either compound inhibited brain metastases in xenograft and immunecompetent models (Fig. 5c, Extended Data Fig. 10a-b, but did not restrict lung metastasis (Extended Data Fig. 10c-d). Neither drug altered the astrocyte response to cGAMP (Extended Data Fig 10e).
Figure 5. Inhibition of gap junction activity controls brain metastatic outgrowth.
a, Dye transfer from astrocytes to MDA231-BrM2 cells in the presence of the indicated concentrations of Tonabersat (Tona) or meclofenamate (Meclo). (n ≥ 3 independent experiments). b, ELISA of IFNα and TNFα in conditioned media from co-cultured MDA231-BrM2 cell and astrocytes in the presence of Tonabersat (Tona) or meclofenamate (Meclo) ranging from 0.5 – 4 × 10⁻⁴ M Tona or 0.25 – 2 × 10⁻⁴ M Meclo. All graphs shown are mean ± S.E.M. (Data shown from 2 independent experiments with 4 replicates each). c, Tonabersat or meclofenamate was administered daily starting one day after cancer cell inoculation in mice. Brain metastatic lesions were quantified based on BLI. (n=2 independent experiments; 8 mice total per group). d, GFP staining of 14-day brain metastatic lesions. Representative images show large, progressive lesions. DAPI, nuclear staining. Scale Bar, 40μm. (n=10 mice). e,f,g, 14 days after inoculation with MDA231-BrM2 cells transduced with inducible control, CX43 or PCDH7 shRNAs, mice were treated with doxycycline and carboplatin. Representative images of matched ex vivo brain BLI and red fluorescence imaging (e). Brain metastatic lesions were quantified based on BLI (f). (2 independent experiments with n= 10 total mice per group). g, 14 days after inoculation with MDA231-BrM2 cells, mice were treated with Tonabersat, meclofenamate, and carboplatin. Following the indicated regimens, brain metastatic lesions were quantified based on BLI (i). (2 independent experiments with n=9 mice total per group).
To test the effect of Cx43 or PCDH7 depletion in established metastases, we transduced MDA231-BrM2 cells with doxycycline-inducible shRNA expression vectors (Fig. 5e, Extended Data Fig. 10g). Red fluorescence protein (RFP) under the control of the same promoter provided a marker of hairpin expression (Extended Data Fig. 10f). Doxycycline treatment began fourteen days after inoculation (Extended Data Fig. 10h, Fig. 5d)3,6, and reduced brain metastatic burden three weeks later (Fig. 5e,f).
Brain metastases show pronounced resistance to chemotherapy34. Carboplatin crosses the BBB35, modestly improving overall survival in patients with brain metastases from breast36 or lung cancer37. Carboplatin alone (50 mg/kg/5 days) starting on day 14 inhibited brain metastasis to a similar extent as Cx43 or PCDH7 depletion (Fig. 5e,f); combination carboplatin and Cx43- or PCDH7-depletion further reduced metastatic burden (Fig. 5e,f). Treatment with either tonabersat (10 mg/kg) or meclofenamate (20 mg/kg) as single agents (Fig. 5g) significantly inhibited progression of metastatic lesions. Addition of carboplatin to either agent profoundly inhibited brain metastasis (Fig. 5g).
Discussion
The brain represents a formidable metastatic target; astrocytes are a predominant feature. We find that cancer cells employ PCDH7 to selectively engage astrocytes in vital Cx43 gap junctions. Cadherins mediate cell-cell communication in development and tissue homeostasis19, particularly in the nervous system38. Remarkably, brain metastatic cells adopt a cadherin whose normal expression is largely confined to the brain15. PCDH7 joins ST6GALNAC53, and neuroserpin6 as brain-restricted components that metastatic cells from breast and lung carcinomas selectively express to colonize the brain. Functional Cx43-based gap junctions between cancer cells and astrocytes allow cancer cells to disseminate cGAMP to astrocytes. This activates the astrocytic cGAS-STING pathway and release of cytokines including IFNα and TNFα, which provide a growth advantage for brain metastatic cells by protecting against physiologic and chemotherapeutic stresses.
cGAMP transfer from cancer cell to astrocyte is reminiscent of cGAMP spread to adjacent cells in the anti-viral context39,40 However, unlike homotypic transfer of cGAMP to bystander cells to intensify immune response, brain metastatic cells shunt cGAMP into neighboring host astrocytes to trigger downstream signaling that supports metastatic outgrowth. This prometastatic process contrasts with previous reports of tumor STING activation and subsequent host immune cell extracranial anti-tumor response41,42 and highlights the profound impact of stromal context.
Brain metastases are a major contributor to cancer mortality, with few therapeutic options available. Cancer cell dependency on Cx43/PCDH7 gap junctions for survival and outgrowth of metastatic lesions suggests a therapeutic opportunity. Our pre-clinical results using combinations of chemotherapy and gap junction modulators provide proof-of-principle for the therapeutic potential of these interventions against brain metastasis.
METHODS
Cell culture
Human MDA-MB-231 (MDA231), murine MMTV-neu, murine LLC their metastatic derivatives, and murine 373N1, 393N1, 482N1, 2691N1 cell lines were cultured in DMEM with 10% fetal bovine serum (FBS) and 2 mM L-Glutamine. Human H2030 cells and metastatic derivatives were cultured in RPMI 1640 medium supplemented with 10% FBS and 2 mM LGlutamine. For lentivirus production, 293T cells were cultured in DMEM supplemented with 10% fetal bovine serum and 2 mM L-glutamine. Human primary astrocytes, mouse primary astrocytes, brain microvascular endothelial cells (HBMEC), adult dermal fibroblasts, and microglia were cultured in media specified by the supplier (ScienCell), and used between passages 2-6. All cells tested negative for micoplasma.
Animal studies
All experiments using animals were performed in accordance with protocols approved by the MSKCC Institutional Animal Care and Use Committee. Athymic NCR nu/nu mice (NCI-Frederick), Cr:NIH bg-nu-xid mice (NCI-Frederick), B6129SF1/J, C57BL/6J-Tmem173gt/J43 “Golden Ticket”, and C57/Bl/6J mice (Jackson Laboratory) were used at 5-6 weeks of age. For long-term brain metastasis assays we followed previously described procedures3. In brief, 1 × 10⁴ MDA231-BrM2 cells, 5 × 10⁴ H2030-BrM3 cells, 5 × 10⁴ LLC-BrM or 1 × 10⁵ 393N1 cells suspended in 100 μl of PBS were injected into the left cardiac ventricle. At the experimental endpoint, anesthetized mice (ketamine 100mg/kg, xylazine 10 mg/kg) were injected retro-orbitally with D-luciferin (150mg/kg), prior to euthanasia, dissection of brain and quantified by ex vivo Bio-luminescent imaging (BLI). For short-term (7-day and 14-day) brain metastasis experiments, we introduced 5x10⁵ cells. Where relevant, TRITC dextran (70 KD) (Life Technologies) was intravenously injected to stain vascular structures prior to dissection. For lung colonization assays, 2 × 10⁵ MDA231-BrM2 cells in 100 μL PBS were injected into the lateral tail vein. For orthotopic tumour implantation, 5 × 10³ cells in 50 μL of 1:1 mix of PBS/growth factor reduced matrigel (BD Biosciences) were injected into the 4th right mammary fat pad of female mice. For inducible knockdown experiments, mice were given doxycycline hyclate (Sigma-Aldrich) in the drinking water (2 mg/mL) and the diet (Harlan) 14 days after injection of cancer cells. For drug treatment experiments, mice were intraperitoneally injected with carboplatin (Hospira)(50 mg/kg/5days), Tonabersat (MedChem Express)(10 mg/kg/day), or meclofenamic acid sodium salt (Sigma-Aldrich) (20 mg/kg/day). Vehicle (10% DMSO in Polyethylene glycol 400) was used in control mice. Quantification of tumor burden was wuth bioluminescent imaging (BLI). BLI was performed using an IVIS Spectrum Xenogen instrument (Caliper Life Sciences) and analyzed using Living Image software, v. 2.50. Please refer to Source Data file. A priori sample size determination for animal experiments was determined by Mead's Resource Equation: 10 animals per treatment group in an experimental design of three groups, without further stratification, gives 28 degrees of freedom, an adequate sample size. Eight animals per treatment group gives 24 degrees of freedom, also acceptable. Therefore, for brain metastasis assays, 8-10 mice were used in each group; exact numbers for each experimental series are included in the relevant figure legends. For drug treatment experiments, mice were inoculated with cancer cells and randomly assigned to treatment groups. Mice dying less than 24 h after tumor inoculation were excluded from analysis. Gap junction modulators and chemotherapeutic agents were blindly administered in the MSKCC Antitumour Assessment Core.
Immunohistochemical staining
Mouse brains were fixed with 4% paraformaldehyde, sectioned by vibratome (Leica) or cryostat (Leica) and stained following established protocols6. For brain slice assays6, 250 μm thick slices of adult mouse brain were prepared with a vibratome (Leica) and placed on top of 0.8 μm pore membranes (Millipore) in brain slice culture medium (DMEM, complete HBSS, 5% FBS, 1mM L-glutamine, 100 IU/mL penicillin, 100 μg/mL streptomycin). 3 × 10⁵ cancer cells were placed on the surface of the slice. After 48 h of incubation, brain slices were fixed with 4% paraformaldehyde, and stained. For immunostaining in chamber slide cultures, cells were fixed with 4% paraformaldehyde and stained. Antibodies used for immunochemical staining are listed in Supplementary Information. Images were acquired with Zeiss Axio Imager Z1 microscope or Leica SP5 upright confocal microscope, and analyzed with ImageJ, Imaris and Metamorph softwares. Antibodies used for immunostaining are listed in Supplementary Information.
Knockdown and overexpression constructs
For stable knockdown of Cx43, PCDH7, cGAS and STING, we used shRNAs in GiPZ lentiviral vector. For inducible knockdown, shRNAs in TRIPZ lentivial vector were used. 1 μg/mL doxycycline hyclate (Sigma-Aldrich) was added to induce the expression of shRNA. Targeted sequences of shRNAs are listed in the tables below. pBabe-Puro-IKBalpha-mut (Addgene) was used for stable expression of SR-IkB. For expression of wild type Cx43 (Origene), or Cx43(T154A) mutant (ACC to GCC), we used pLVX vector.
mRNA and protein detection
Total RNA was extracted using the PrepEase RNA spin kit (USB). To prepare cDNA, 1 μg of total RNA was treated using the Transcriptor First Strand cDNA synthesis kit (Roche). Cx43, Cx30 and Cx 26 expression was quantified by Taqman gene expression assay primers: (Cx 43: Hs00748445_s1, Mm00439105_m1; Cx30: Hs00922742_s1, Mm00433661_s1; Cx26: Hs00269615_s1, Mm00433643_s1; Applied Biosystems). Relative gene expression was normalized relative to β2-microglobulin (Hs99999907_m1, Mm00437762_m1). The PCDH7 primer pair was designed to detect all PCDH7 isoforms: 5’-agttcaacgtggtcatcgtg-3’(sense), 5’-acaatcagggagttgttgctc-3’(antisense). Reactions were performed using SYBR Green I Master Mix (Applied Biosystems). Quantitative expression data were analyzed using an ABI Prism 7900HT Sequence Detection System (Applied Biosystems). For western immunoblotting, cell pellets were lysed with RIPA buffer and protein concentrations determined by BCA Protein Assay Kit (Pierce). Protein lysates of primary human astrocytes, microglia and HBMEC were purchased from ScienCell. Proteins were separated by SDS-PAGE and transferred to nitrocellulose membranes (BioRad). Antibodies used for western blotting are listed in table below.
Dye transfer and EdU transfer assays
Monolayers of cancer cells or astrocytes were labeled with 2.5 μg/ml calcein Red-Orange AM dye (Life Technologies) at 37°C for 30 min. Single cell suspensions were mixed at a ratio of 2:1 labeled:unlabeled cells for 6 h. Certain experiments used a mix of three cell populations, MDA231-BrM2 (GFP+), HBMEC (pre-labeled with Cell Proliferating Dye Fluor@670, eBioscience), and unlabeled astrocytes. Dye transfer was visualized by Zeiss LSM 5 Live confocal microscopy (20-min time-lapse) or quantified by FACSCalibur flow cytometry (BD Biosciences).
Cancer cell and astrocyte co-culture experiments
Astrocytes and cancer cells were mixed at ratio of 1:1. For apoptosis assays, overnight co-cultures were treated with 500 ng/ml sFasL (Peprotech) in serum free media, 500 nM carboplatin (Sigma-Aldrich) or 25 nM Paclitaxel (Sigma-Aldrich) for 24 h. Single cell suspensions were stained with APC-conjugated cleaved caspase 3 antibody (Cell Signaling), apoptotic GFP+ cancer cells were detected by flow cytometery. For conditioned media analysis, media were collected after 24 h, and cytokines in the conditioned media were either identified using Human Cytokine Array (R&D systems) or measured by human or mouse IFNα or TNFα ELISA kits (R&D systems) as relevant. To detect the activity of IFNα or TNFα in the collected conditioned media, cancer cells were treated with the collected conditioned media for 2 h and phosphorylation status of STAT1 or NF-κB p65 was determined by western blotting. For cGAMP and TBI-IRF3 activation experiments, cancer cells and astrocytes were co-cultured for 18 h. To stimulate astrocytes without co-culture, astrocytes were transfected with cGAMP (4 μg/ml) with Lipofectamine 2000, according to the manufacturer's protocol, as previously described.43 The phosphorylation status of TBK1, IRF3 was determined by western immunoblotting. Nuclear translocation of IRF3 was determined by immunofluorescence staining with Zeiss LSM 5 Live confocal microscopy. cGAMP levels were determined by LC-MS/MS; Detailed methods for cGAMP detection and quantification are described in Supplementary Information.
Translating ribosome affinity purification (TRAP)
EGFP-L10a expressing cancer cells were co-cultured with astrocytes for 24 h. Following previously published protocols,24,44 mRNA purified from cancer cells was used for library construction with TruSeq RNA Sample Prep Kit v2 (Illumina) following the manufacturer's instructions. Samples were barcoded and run on a Hiseq 2000 platform in a 50bp/50bp paired-end run, using the TruSeq SBS Kit v3 (Illumina). An average of 50 million paired reads were generated per sample. The data are deposited in NCBI GEO: GSE79256.
Cytokine treatment and pathway reporter assays
Cancer cells were treated with 10 units/ml (39 u/ng) recombinant IFNαA (R&D Systems) or 10 pg/ml recombinant TNFα (R&D Systems) in combination with carboplatin or Taxol (Sigma-Aldrich) for 24 h. Apoptosis was quantified by Caspase-Glo 3/7 assay (Promega). For NFκB reporter assays, the NF-κB responsive sequence from the pHAGE NFKB-TA-LUC-UBC-dTomato-W construct (Addgene)45 was cloned into a pGL4.82 Renilla luciferase reporter (Promega). Cancer cells were co-transfected with this vector and a LeGO-C2 mCherry vector (Addgene). Renilla luciferase activity was determined using RenillaGlo Luciferase system (Promega). Red fluorescence signal was used to normalize transfection efficiency.
Split luciferase assay
Fusion cDNAs were generated by deleting the stop codon in human Cx43 (Origene), PCDH7 (Origene), E-cadherin (Addgene) or N-cadherin (Addgene) cDNAs and splicing the N-terminal or C-terminal fragment of firefly luciferase22. (Addgene). Constructs were cloned into pLVX lentiviral expression vector and transduced into non-GFP-luciferase-labeled parental MDA-MB-231 or H2030 cells. To detect luciferase activity, 7.5 mg/ml D-luciferin potassium salt was added in the culture media. BLI was performed by IVIS Spectrum Xenogen instrument, using Living Image software v.2.50.
Cytosolic dsDNA detection
For visualization of dsDNA, cells were immunostained with anti-dsDNA antibody. Anti-GFP staining was used to delineate cancer cell bodies, DAPI to distinguish nuclei, and anti-CoxIV antibody (a mitochondrial marker) to distinguish mitochondria. Phalloidin staining (Molecular Probe) was used to delineate astrocyte cell bodies. For quantification of dsDNA, nuclear, cytosolic and mitochondrial fractions were prepared using a mitochondria isolation kit (Thermo Scientific). DNA from all subcellular fractions was purified by QIAamp DNA mini kit (Qiagen) and quantified by QuantoFluor dsDNA system (Promega).
Bioinformatic and statistical analysis
Bioinformatic analysis was performed in R (ver. 3.1.2) unless otherwise noted. The data were analyzed using the TopHat2-HTSeq-DESeq2 pipeline46-48. Differential gene expression was compared with cooksCutoff and independentFiltering turned off. Scatter plot showing fold changes was produced using the ggplot2 package. Principal component analysis (PCA) was performed using prcomp. Pathway gene response signatures were analyzed and scored by the sum of z-score method 44, as previously described12,49. Multiple hypothesis testing was adjusted using the Benjamini & Hochberg false-discovery-rate method. Statistical analysis was performed using GraphPad software (Prism) and Student's t-test (two-tailed). P values <0.05 were considered statistically significant. Values are averages ± standard error of the mean (S.E.M.).
Clinical sample analysis
All tissues were obtained from the MSKCC Department of Pathology in compliance with the MSKCC Institutional Review Board under Biospecimen Research Protocol 15-204. Informed consent was obtained from all subjects. CX43 and PCDH7 transcript levels were analyzed in the microarray data of primary breast cancer (EMC-MSK) and adenocarcinoma datasets (MSKCC set2, GSE3141 and GSE8893). Multiple probes mapping to the same gene were combined by selecting the probe with maximal variance across samples. Triple-negative breast cancer subtypes were identified either based on clinical annotation of the data set or on ESR1 and ERBB2 transcript levels. The hazard ratio of the CX43 and PCDH7 values was computed based on Cox proportional hazards model, as implemented by the “coxph” command in R. P values were calculated from a Cox proportional hazard model, with CX43 and PCDH7 expression treated as a continuous variable. For Cx43 immunohistochemistry, normal lung tissue array (75 cases), primary triple negative breast cancer tissue array (98 cases) and primary non-small cell lung carcinoma tissue array (138 cases) were purchased from US Biomax. Paraffin embedded tissue microarrays from brain metastases (117 case of triple-negative breast cancer, 91 cases of non-small cell lung carcinoma) were obtained from the MSKCC Department of Pathology. Immunohistochemical staining for Cx43 was performed by the MSKCC Pathology Core Facility using standardized, automated protocols. For matched primary-brain metastatic lesions, Cx43 staining was quantified by positive staining area (Metamorph software).
Extended Data
Extended Figure 1. Cancer cell-astrocyte interactions.
a, Representative images and quantification of Cx43 immunostaining in matched primary and brain metastatic samples from non-small lung carcinoma patients. Scale bar, 100 μm (n = 8 patients). b, Cancer cells used in this study. c, Astrocyte co-culture protects cancer cells. As illustrated in schema (left), cleaved caspase 3+/GFP+ apoptotic BrM cells were quantified by flow cytometery after sFasL- or chemo-treatments. (3 independent experiments). d, Flow cytometric quantification of dye transfer from astrocytes to MDA231-BrM2 cells over time. (3 independent experiments).
Extended Figure 2. Elevated expression of Cx43 and PCDH7 in brain metastatic cancer cells and astrocytes.
a, Cx43 and PCDH7 mRNA in parental (Par) and BrM cells. Values are mean ± S.E.M. (3 independent experiments in triplicate). b, Cx43 and PCDH7 western blotting in ErbB2 parental and brain cells, as well as Kras/p53 cell lines. (n = 3 independent experiments). c, Cx26 and Cx30 mRNA in MDA231 parental (Par) and the metastatic derivatives of brain (BrM2), lung (LM) and bone (BoM). d, Cx43 and PCDH7 mRNA in BrM cells compared to brain cells. (3 independent experiments). e, Kaplan-Meier plot illustrates the probability of cumulative metastasis free survival in 63 cases (GSE8893) of lung adenocarcinoma based on Cx43/PCDH7 expression in the primary tumour. f,g, Knockdown of Cx43 and PCDH7 with short hairpin RNAs (shRNA) as assessed by RT-PCR (f) and western blotting (g). Ctrl, control. Values are mean ± S.E.M. (3 independent experiments in triplicate).
Extended Figure 3. PCDH7 facilitates gap junction communication.
a,b, Histograms and quantification of dye transfer from astrocytes to control and Cx43-depleted or PCDH7-depleted Kras/p53-393N1 cells (a), and from astrocytes to control or Cx43-depleted MDA231-BrM2 cells, in comparison to Carbenoxolone (50 uM) treatment (b). c,d, PCDH7 in astrocytes facilitate gap junctions. PCDH7 immunoblotting of control or PCDH7-depleted astrocytes (c). Quantification of dye transfer from MDA231-BrM2 cells to PCDH7-depleted astrocytes (d). e, Quantification of dye transfer from human brain microvascular endothelial cells (HBMEC) to control, Cx43- or PCDH7-depleted MDA231-BrM2 cells. f, Dye transfer from MDA231-BrM2 cells to a mixed population of astrocytes and HBMEC. g, Quantification of dye transfer from control or Cx43-depleted MDA231-BrM2 cells to human microglia. For dye transfer assays, values are mean ± S.E.M. (≥ 2 independent experiments in triplicate).
Extended Figure 4. Cx43 directly interacts with PCDH7, but not with E cadherin or N cadherin.
a, Schema illustrating split luciferase assay. Fusion constructs of PCDH7 and Cx43 were created with either the N or C terminal halves of luciferase, NLuc and CLuc, respectively. When these proteins are brought into proximity, luciferase is functionally reconstituted, producing photons of light. b, Cx43 and PCDH7 constructs fused with N-terminal and C-terminal firefly luciferase halves (N-luc) and (C-luc) were expressed in parental cell lines. The table (top) numerically identifies the cell line combinations used in the assays (bottom), and bioluminescence imaging (BLI) of a representative plate. c, Cx43 and PCDH7 western immunoblotting in cancer cells overexpressing fusion proteins. d, Quantification of BLI after co-culture of Cx43-CLuc/PCDH7-NLuc(+) cancer cells and astrocytes for 15 min. (3 independent experiments) e-g, Luciferase split assay to detect Cx43-E cadherin or Cx43-N cadherin interactions. Cell line combinations used in the assays are numerically identified in the table (e), and confirmed by western immunoblotting (f). Bioluminescence imaging (BLI) of a representative assay plate; cell line combinations are indicated numerically (g). (n ≥ 2 independent experiments).
Extended Figure 5. Inhibition of gap junction activity prevents brain metastatic outgrowth.
a, Bioluminescent imaging (BLI) quantification of brain metastatic lesions formed by control (Ctrl), Cx43- or PCDH7-depleted H2030-BrM3 cells. (Data are from 2 independent experiments with 9 mice total per group). b, Representative images of GFP+ brain metastatic lesions formed by control, Cx43- or PCDH7-depleted MDA231-BrM2 cells. Brain sections or brain metastatic lesions are delineated by dotted white line or dotted red line, respectively. Scale bar, 1000 μm. c, BLI (images) and quantification (bar graph) of lung metastatic lesions formed by MDA231-BrM2 cells. Values are mean ± S.E.M. (Data are from 2 independent experiments with 5 mice total in each group). d,e, Gap junction-mediated brain metastasis requires channel function of Cx43. Wild type (WT) or T154A mutant (Mut) Cx43 was re-expressed in Cx43 depleted MDA231-BrM2 cells (CX43 sh2). Cx43 expression was detected by western blotting (d) and brain metastasis formed by these cells was quantified by BLI (e). (Data are from 2 independent experiments with 10 mice total per group)
Extended Figure 6. Cx43 and PCDH7 do not mediate early events of extravasation and vascular cooption in brain metastasis.
a, Cx43 and PCDH7 do not mediate trans-BBB Migration. Quantification of control (Ctrl), Cx43-or PCDH7-depleted MDA231-BrM2 cells in 7-day brain lesions was carried out as follows: at the indicated timepoint, mice were euthanized, brains were sectioned, 10% of the sections were immunostained stained, and all GFP(+) cells in these sections were counted. Values are mean ± S.E.M. (n=5 brains in each group). b, Cx43 and PCDH7 mediate cancer cell colonization in 14-day brain lesions. Sectioning and staining were carried out as described in (a). Representative images are GFP (green) and Ki67 (red) staining. DAPI, nuclear staining. Scale bar, 20 μm. Bar graph is the proportion of Ki67+ cancer cells. Values are mean ± S.E.M. (n=5 brains in each group). c, Cx43 and PCDH7 mediate cancer cell survival. MDA231 BrM2 cells expressing CX43sh, PCDH7sh or Control sh were deposited onto living brain sections, 5 brain slices were seeded with cancer cells of each type. After 48 h, slices were fixed and stained for GFP (green) and cleaved caspase 3 (Casp3)(red) staining. Representative images are shown, Scale bar, 30 μm. After staining, all GFP(+) cells were counted on each slice. GFP (+) cells with 3+ caspase staining were scored as “apoptotic”. Histogram is the proportion of caspase 3+ apoptotic cancer cells. Values are mean ± S.E.M. (n=5 brain slices in each group). d, Cx43 and PCDH7 do not affect vascular cooption of cancer cells in 14-day brain lesions. Representative images are GFP (green) staining and vascular structure filled with TRITC dextran (red). Scale bar, 20 μm. (2 independent experiments).
Extended Figure 7. Translating ribosome affinity purification (TRAP) after cancer cell astrocyte co-culture.
a, Schematic illustration of TRAP experimental set up to isolate translating mRNA from MDA231-BrM2 cells under 3 conditions (#1, #2, #3). b, Principle component (PC) analysis of TRAP mRNA sequencing. c. Scatter plot of log2 fold-changes regulated by astrocytes and gap junction communications between BrM cells and astrocytes. d, STAT1 and NF-κB p65 phosphorylation in H2030-BrM3 cells after a 2 h incubation with conditioned media (CM) from astrocyte co-cultures. CM were collected after 24 h co-culture of astrocytes with control or Cx43-depleted H2030-BrM3 cells. n=3 independent experiments.
Extended Figure 8. Gap junction-generated signaling activates IFN and NF-κb pathways in cancer cells.
a, Cytokine array analysis of conditioned media collected after 24 h co-culture of human astrocytes with control or Cx43-depleted MDA231-BrM2 cells. Log2 fold-changes were plotted. b, Schematic of co-culture conditioned media collection and human astrocyte re-isolation (left) ELISA of IFNα and TNFα in CM from astrocyte co-cultures with the indicated MDA231-BrM2 cells (right) All values are mean ± S.E.M. (≥2 independent experiments with 4 total replicates). c, Relative levels of cleaved caspase 3 in MDA231-BrM2 cells treated with various concentrations of carboplatin (Carbo) in the presence or absence of 10 units/ml (39 units/ng) IFNαA or 10 pg/ml TNFα. All values are mean ± S.E.M. (5 technical replicates over 3 independent experiments). d, STAT1 levels in control and STAT1-knockdown LLC BrM and 393N1 cells e. Quantification of BLI signal from brain metastases formed by syngeneic LLC-BrM control, or STAT1-knockdown cells. (Data are from 2 independent experiments with 12-15 mice total per group). f, NF-κB renilla luciferase reporter assay in MDA231-BrM cells expressing control pBABE or SR-IκBα vector. Vlues are mean ± S.E.M. (3 technical replicates).
Extended Figure 9. Gap junctions initiate cytosolic DNA response in astrocytes.
a, Control or Cx43-deplated H2030-BrM3 cells were co-cultured for 18 h with or without astrocytes, and subjected to immunobloting analysis of phosphorylated TBK1 and IRF3 (n=3 independent experiments). b, Immunoblot of mouse astrocytes depleted on STING with short hairpins or control (non-silencing) sh. c, Mouse IFNa and TNFa were quantitated in the conditioned medium after co-culture (b) by ELISA. (2 independent experiments with 3 replicates each). d, LLC BrM growth in syngeneic C57Bl6 mice hosts wild-type (+/+) or knock-out (−/−) for STING. Diameter of brain metastases (d) Scale bar, 50 μm. Brains from all mice (n = 22) were sectioned, immunostained, and measured. All GFP(+) brain metastases were quantitated (2.8 +/− 0.67 metastases per +/+ mouse; 1.6 +/− 0.55 in STING −/− mice). e, Quantification of dsDNA in the indicated cellular fractions from 2×10⁷ H2030-BrM3, MDA231-BrM2 or Human Astrocyte cells. Values are mean ± S.E.M. (n=3 biological replicates; 2 independent experiments). f, Ratio of cytosolic dsDNA and nuclear dsDNA in indicated cancer cells and non-neoplastic cells. g, Representative image of immunofluorescent staining of dsDNA, GFP, Cox IV (mitochondria marker) in MDA-BrM2 cells. h, cGAMP identification. The peak at 4.47 min contains all 3 SRM transitions specific for cGAMP. RT: retention time, AA: automatically integrated peak area. i, j, EdU labeled MDA231-BrM2 cells were co-cultured with astrocytes for 6 h. Transfer of EdU-labeled DNA from cancer cells to astrocytes was visualized using confocal microscopy (i), or quantified by flow cytometry (j). k, Immunoblot of H2030-BrM3 cells depleted of cGAS with short hairpins or control (non-silencing) sh. l, Human astrocytes (Astro), were cultured for 18 h with or without H2030 BrM cells (BrM) expressing control shRNA (Ctrl sh) or shRNA targeting cGAS; Human IFNa and TNFa were quantitated in the conditioned medium by ELISA (l). (2 independent experiments in triplicate). m, Quantification of BLI signal from brain metastases formed by H2030 BrM3 cells depleted of cGAS with two independent sh. (Data are from 2 independent experiments with 6 mice total per group).
Extended Figure 10. Inhibition of Gap Junction Activity Prevents Brain Metastatic Outgrowth.
a-d, Following treatment with Tonabersat (Tona) or meclofenamate (Meclo) (a), brain metastasis (b), primary tumour growth in mammary fat pads (c), or lung metastasis (d) was quantified by BLI. Values are mean ± S.E.M. (2 independent experiments with 10 mice total in each group). e, Human astrocytes were treated with Tonabersat or Meclofenamate at 200 uM and 100 uM, respectively for 12 h prior to transfection with cGAMP (4 μg/ml) with Lipofectamine 2000, or Lipofectamine alone.Conditioned media was collected 18 h later and assayed for human TNFαand IFNα by ELISA. (2 biological replicates). f, Knockdown of Cx43 and PCDH7 in MDA231-BrM2 cells with tet-on inducible short hairpin RNAs (shRNA), as assessed by RT-PCR (f) and western immunoblotting (g), after doxycycline treatment in vitro. 2 independent experiments. h, Brain ex vivo Bioluminescent imaging (BLI) 14 days after inoculation of MDA231-BrM2 cells (n = 10 mice).
Supplementary Material
ACKNOWLEDGEMENTS
We thank D. Macalinao and other members of the Massagué lab for insightful discussions. This work was supported by NIH grants P01-CA129243, U54-163167 and P30 CA008748, DOD Innovator award W81XWH-12-0074, the Alan and Sandra Gerry Metastasis Research Initiative (J.M.), the MSKCC Clinical Scholars Training Program (A.B.), the Solomon R. and Rebecca D. Baker Foundation (A.B), and by the Susan G. Komen Organization (X.J.).
Footnotes
AUTHOR STATEMENTS
Q.C., A.B. and J.M. conceptualized the project and designed the experiments. Q.C. and A.B. performed the experiments. X.J., M.V., E.E.E., A.L.S., L.J. and R.P. assisted with the experiments and bioinformatics analysis. H.S. and J.C. performed the LC-MS/MS analysis, and K.X. the time-lapse confocal imaging. A.B., Q.C. and J.M. wrote the paper.
RNA Seq Data (Fig. 3a, Extended Data Fig. 7a-c) are deposited in NCBI GEO GSE79256. The authors declare no financial interests in connection with this work.
REFERENCES
- 1.Gavrilovic IT, Posner JB. Brain metastases: epidemiology and pathophysiology. J Neurooncol. 2005;75:5–14. doi: 10.1007/s11060-004-8093-6. [DOI] [PubMed] [Google Scholar]
- 2.Stelzer KJ. Epidemiology and prognosis of brain metastases. Surg Neurol Int. 2013;4:S192–202. doi: 10.4103/2152-7806.111296. [DOI] [PMC free article] [PubMed] [Google Scholar]
- 3.Bos PD, et al. Genes that mediate breast cancer metastasis to the brain. Nature. 2009;459:1005–1009. doi: 10.1038/nature08021. [DOI] [PMC free article] [PubMed] [Google Scholar]
- 4.Eichler AF, et al. The biology of brain metastases-translation to new therapies. Nat Rev Clin Oncol. 2011;8:344–356. doi: 10.1038/nrclinonc.2011.58. [DOI] [PMC free article] [PubMed] [Google Scholar]
- 5.Kienast Y, et al. Real-time imaging reveals the single steps of brain metastasis formation. Nat Med. 2010;16:116–122. doi: 10.1038/nm.2072. [DOI] [PubMed] [Google Scholar]
- 6.Valiente M, et al. Serpins promote cancer cell survival and vascular co-option in brain metastasis. Cell. 2014;156:1002–1016. doi: 10.1016/j.cell.2014.01.040. [DOI] [PMC free article] [PubMed] [Google Scholar]
- 7.Giaume C, Koulakoff A, Roux L, Holcman D, Rouach N. Astroglial networks: a step further in neuroglial and gliovascular interactions. Nat Rev Neurosci. 2010;11:87–99. doi: 10.1038/nrn2757. [DOI] [PubMed] [Google Scholar]
- 8.Sofroniew MV, Vinters HV. Astrocytes: biology and pathology. Acta Neuropathol. 2010;119:7–35. doi: 10.1007/s00401-009-0619-8. [DOI] [PMC free article] [PubMed] [Google Scholar]
- 9.Kim SJ, et al. Astrocytes upregulate survival genes in tumor cells and induce protection from chemotherapy. Neoplasia. 2011;13:286–298. doi: 10.1593/neo.11112. [DOI] [PMC free article] [PubMed] [Google Scholar]
- 10.Wu J, et al. Cyclic GMP-AMP is an endogenous second messenger in innate immune signaling by cytosolic DNA. Science. 2013;339:826–830. doi: 10.1126/science.1229963. [DOI] [PMC free article] [PubMed] [Google Scholar]
- 11.Theis M, Giaume C. Connexin-based intercellular communication and astrocyte heterogeneity. Brain Res. 2012;1487:88–98. doi: 10.1016/j.brainres.2012.06.045. [DOI] [PubMed] [Google Scholar]
- 12.Nguyen DX, et al. WNT/TCF signaling through LEF1 and HOXB9 mediates lung adenocarcinoma metastasis. Cell. 2009;138:51–62. doi: 10.1016/j.cell.2009.04.030. [DOI] [PMC free article] [PubMed] [Google Scholar]
- 13.Winslow MM, et al. Suppression of lung adenocarcinoma progression by Nkx2-1. Nature. 2011;473:101–104. doi: 10.1038/nature09881. [DOI] [PMC free article] [PubMed] [Google Scholar]
- 14.Oshima A. Structure and closure of connexin gap junction channels. FEBS Lett. 2014;588:1230–1237. doi: 10.1016/j.febslet.2014.01.042. [DOI] [PubMed] [Google Scholar]
- 15.Yoshida K, Yoshitomo-Nakagawa K, Seki N, Sasaki M, Sugano S. Cloning, expression analysis, and chromosomal localization of BH-protocadherin (PCDH7), a novel member of the cadherin superfamily. Genomics. 1998;49:458–461. doi: 10.1006/geno.1998.5271. [DOI] [PubMed] [Google Scholar]
- 16.Kim SY, Chung HS, Sun W, Kim H. Spatiotemporal expression pattern of non-clustered protocadherin family members in the developing rat brain. Neuroscience. 2007;147:996–1021. doi: 10.1016/j.neuroscience.2007.03.052. [DOI] [PubMed] [Google Scholar]
- 17.Gaspar LE, et al. Time from treatment to subsequent diagnosis of brain metastases in stage III non-small-cell lung cancer: a retrospective review by the Southwest Oncology Group. J Clin Oncol. 2005;23:2955–2961. doi: 10.1200/JCO.2005.08.026. [DOI] [PubMed] [Google Scholar]
- 18.Gaspar LE, Scott C, Murray K, Curran W. Validation of the RTOG recursive partitioning analysis (RPA) classification for brain metastases. Int J Radiat Oncol Biol Phys. 2000;47:1001–1006. doi: 10.1016/s0360-3016(00)00547-2. [DOI] [PubMed] [Google Scholar]
- 19.Yagi T, Takeichi M. Cadherin superfamily genes: functions, genomic organization, and neurologic diversity. Genes Dev. 2000;14:1169–1180. [PubMed] [Google Scholar]
- 20.Osswald M, et al. Brain tumour cells interconnect to a functional and resistant network. Nature. 2015;528:93–98. doi: 10.1038/nature16071. [DOI] [PubMed] [Google Scholar]
- 21.Sin WC, et al. Astrocytes promote glioma invasion via the gap junction protein connexin43. Oncogene. 2015 doi: 10.1038/onc.2015.210. [DOI] [PubMed] [Google Scholar]
- 22.Luker KE, et al. Kinetics of regulated protein-protein interactions revealed with firefly luciferase complementation imaging in cells and living animals. Proc Natl Acad Sci U S A. 2004;101:12288–12293. doi: 10.1073/pnas.0404041101. [DOI] [PMC free article] [PubMed] [Google Scholar]
- 23.Beahm DL, et al. Mutation of a conserved threonine in the third transmembrane helix of alpha- and beta-connexins creates a dominant-negative closed gap junction channel. J Biol Chem. 2006;281:7994–8009. doi: 10.1074/jbc.M506533200. [DOI] [PubMed] [Google Scholar]
- 24.Heiman M, et al. A translational profiling approach for the molecular characterization of CNS cell types. Cell. 2008;135:738–748. doi: 10.1016/j.cell.2008.10.028. [DOI] [PMC free article] [PubMed] [Google Scholar]
- 25.Boehm JS, et al. Integrative genomic approaches identify IKBKE as a breast cancer oncogene. Cell. 2007;129:1065–1079. doi: 10.1016/j.cell.2007.03.052. [DOI] [PubMed] [Google Scholar]
- 26.Cai X, Chiu YH, Chen ZJ. The cGAS-cGAMP-STING pathway of cytosolic DNA sensing and signaling. Mol Cell. 2014;54:289–296. doi: 10.1016/j.molcel.2014.03.040. [DOI] [PubMed] [Google Scholar]
- 27.Stetson DB, Medzhitov R. Recognition of cytosolic DNA activates an IRF3- dependent innate immune response. Immunity. 2006;24:93–103. doi: 10.1016/j.immuni.2005.12.003. [DOI] [PubMed] [Google Scholar]
- 28.Harks EG, et al. Fenamates: a novel class of reversible gap junction blockers. J Pharmacol Exp Ther. 2001;298:1033–1041. [PubMed] [Google Scholar]
- 29.Jin M, et al. Effects of meclofenamic acid on limbic epileptogenesis in mice kindling models. Neurosci Lett. 2013;543:110–114. doi: 10.1016/j.neulet.2013.03.029. [DOI] [PubMed] [Google Scholar]
- 30.Chan WN, et al. Identification of (−)-cis-6-acetyl-4S-(3-chloro-4-fluoro-benzoylamino)- 3,4-dihydro-2,2-dimethyl-2H-benzo[b]pyran-3S-ol as a potential antimigraine agent. Bioorg Med Chem Lett. 1999;9:285–290. doi: 10.1016/s0960-894x(98)00728-8. [DOI] [PubMed] [Google Scholar]
- 31.Herdon HJ, et al. Characterization of the binding of [3H]-SB-204269, a radiolabelled form of the new anticonvulsant SB-204269, to a novel binding site in rat brain membranes. Br J Pharmacol. 1997;121:1687–1691. doi: 10.1038/sj.bjp.0701331. [DOI] [PMC free article] [PubMed] [Google Scholar]
- 32.Read SJ, Smith MI, Hunter AJ, Upton N, Parsons AA. SB-220453, a potential novel antimigraine agent, inhibits nitric oxide release following induction of cortical spreading depression in the anaesthetized cat. Cephalalgia. 2000;20:92–99. doi: 10.1046/j.1468-2982.2000.00022.x. [DOI] [PubMed] [Google Scholar]
- 33.Damodaram S, Thalakoti S, Freeman SE, Garrett FG, Durham PL. Tonabersat inhibits trigeminal ganglion neuronal-satellite glial cell signaling. Headache. 2009;49:5–20. doi: 10.1111/j.1526-4610.2008.01262.x. [DOI] [PMC free article] [PubMed] [Google Scholar]
- 34.Deeken JF, Loscher W. The blood-brain barrier and cancer: transporters, treatment, and Trojan horses. Clin Cancer Res. 2007;13:1663–1674. doi: 10.1158/1078-0432.CCR-06-2854. [DOI] [PubMed] [Google Scholar]
- 35.Pitz MW, Desai A, Grossman SA, Blakeley JO. Tissue concentration of systemically administered antineoplastic agents in human brain tumors. J Neurooncol. 2011;104:629–638. doi: 10.1007/s11060-011-0564-y. [DOI] [PMC free article] [PubMed] [Google Scholar]
- 36.Lim E, Lin NU. Updates on the Management of Breast Cancer Brain Metastases. Oncology (Williston Park) 2014;28 [PubMed] [Google Scholar]
- 37.Taimur S, Edelman MJ. Treatment options for brain metastases in patients with non- small-cell lung cancer. Curr Oncol Rep. 2003;5:342–346. doi: 10.1007/s11912-003-0077-8. [DOI] [PubMed] [Google Scholar]
- 38.Hirano S, Suzuki ST, Redies C. The cadherin superfamily in neural development: diversity, function and interaction with other molecules. Front Biosci. 2003;8:d306–355. doi: 10.2741/972. [DOI] [PubMed] [Google Scholar]
- 39.Patel SJ, King KR, Casali M, Yarmush ML. DNA-triggered innate immune responses are propagated by gap junction communication. Proc Natl Acad Sci U S A. 2009;106:12867–12872. doi: 10.1073/pnas.0809292106. [DOI] [PMC free article] [PubMed] [Google Scholar]
- 40.Ablasser A, et al. Cell intrinsic immunity spreads to bystander cells via the intercellular transfer of cGAMP. Nature. 2013;503:530–534. doi: 10.1038/nature12640. [DOI] [PMC free article] [PubMed] [Google Scholar]
- 41.Demaria O, et al. STING activation of tumor endothelial cells initiates spontaneous and therapeutic antitumor immunity. Proc Natl Acad Sci U S A. 2015;112:15408–15413. doi: 10.1073/pnas.1512832112. [DOI] [PMC free article] [PubMed] [Google Scholar]
- 42.Woo SR, et al. STING-dependent cytosolic DNA sensing mediates innate immune recognition of immunogenic tumors. Immunity. 2014;41:830–842. doi: 10.1016/j.immuni.2014.10.017. [DOI] [PMC free article] [PubMed] [Google Scholar]
- 43.Sauer JD, et al. The N-ethyl-N-nitrosourea-induced Goldenticket mouse mutant reveals an essential function of Sting in the in vivo interferon response to Listeria monocytogenes and cyclic dinucleotides. Infect Immun. 2011;79:688–694. doi: 10.1128/IAI.00999-10. [DOI] [PMC free article] [PubMed] [Google Scholar]
- 44.Zhang XH, et al. Selection of bone metastasis seeds by mesenchymal signals in the primary tumor stroma. Cell. 2013;154:1060–1073. doi: 10.1016/j.cell.2013.07.036. [DOI] [PMC free article] [PubMed] [Google Scholar]
- 45.Wilson AA, et al. Lentiviral delivery of RNAi for in vivo lineage-specific modulation of gene expression in mouse lung macrophages. Mol Ther. 2013;21:825–833. doi: 10.1038/mt.2013.19. [DOI] [PMC free article] [PubMed] [Google Scholar]
- 46.Anders S, et al. Count-based differential expression analysis of RNA sequencing data using R and Bioconductor. Nat Protoc. 2013;8:1765–1786. doi: 10.1038/nprot.2013.099. [DOI] [PubMed] [Google Scholar]
- 47.Kim D, et al. TopHat2: accurate alignment of transcriptomes in the presence of insertions, deletions and gene fusions. Genome Biol. 2013;14:R36. doi: 10.1186/gb-2013-14-4-r36. [DOI] [PMC free article] [PubMed] [Google Scholar]
- 48.Love MI, Huber W, Anders S. Moderated estimation of fold change and dispersion for RNA-seq data with DESeq2. Genome Biol. 2014;15:550. doi: 10.1186/s13059-014-0550-8. [DOI] [PMC free article] [PubMed] [Google Scholar]
- 49.Gatza ML, et al. A pathway-based classification of human breast cancer. Proc Natl Acad Sci U S A. 2010;107:6994–6999. doi: 10.1073/pnas.0912708107. [DOI] [PMC free article] [PubMed] [Google Scholar]
Associated Data
This section collects any data citations, data availability statements, or supplementary materials included in this article.


