

Abstract
Transmission of olfactory information to higher brain regions is mediated by olfactory bulb (OB) projection neurons, the mitral and tufted cells. Although mitral/tufted cells are often characterized as the OB counterpart of cortical projection neurons (also known as pyramidal neurons), they possess several unique morphological characteristics and project specifically to the olfactory cortices. Moreover, the molecular networks contributing to the generation of mitral/tufted cells during development are largely unknown. To understand the developmental patterns of gene expression in mitral/tufted cells in the OB, we performed transcriptome analyses targeting purified OB projection neurons at different developmental time points with next-generation RNA sequencing (RNA-seq). Through these analyses, we found 1,202 protein-coding genes that are temporally differentially-regulated in developing projection neurons. Among them, 388 genes genes temporally changed their expression level only in projection neurons. The data provide useful resource to study the molecular mechanisms regulating development of mitral/tufted cells. We further compared the gene expression profiles of developing mitral/tufted cells with those of three cortical projection neuron subtypes, subcerebral projection neurons, corticothalamic projection neurons, and callosal projection neurons, and found that the molecular signature of developing olfactory projection neuron bears resemblance to that of subcerebral neurons. We also identified 3,422 events that change the ratio of splicing isoforms in mitral/tufted cells during maturation. Interestingly, several genes expressed a novel isoform not previously reported. These results provide us with a broad perspective of the molecular networks underlying the development of OB projection neurons.
Keywords: olfactory bulb, mitral cell, neuronal development, pyramidal neuron, cell-type specific transcriptome, RNA-seq, alternative splicing
Introduction
The sense of smell influences our mood, emotion, behavior, and health. The OB is the first relay station of odor signals generated by olfactory sensory neurons, and olfactory information must go through the OB before reaching higher brain regions (Mori and Sakano, 2011). In the mouse main OB there are two basic populations of projection neurons, mitral cells and tufted cells, mediating the transmission of olfactory information to the olfactory cortex (Nagayama et al., 2014). Mitral/tufted cells are often presented as the OB counterpart of cortical pyramidal neurons. However, the mitral/tufted cells are generated in the embryonic brain earlier than cortical pyramidal neurons and morphologically differ from cortical neurons in several respects. For example, while cortical pyramidal neurons typically possess apical and basal dendrites that receive axonal synapses, mitral/tufted cells possess two characteristic apical dendrites: 1) a primary apical dendrite that extends radially and arborizes in a single glomerulus where it receives input from olfactory sensory neurons; and 2) secondary dendrites that extend horizontally in the external plexiform layer (EPL). The secondary dendrites make reciprocal dendrodendritic synapses with a population of interneurons, granule cells and the apical dendrites with periglomerular cells, both of which modulate mitral/tufted cell activity (Nagayama et al., 2014). Despite our understanding of their anatomy, the molecular mechanisms regulating mitral/tufted cell development remain largely unknown.
A constellation of molecular networks contributes to the generation of neuronal diversity in the mammalian brain. The genome-wide transcriptome analysis reveals the myriad molecules expressed in target regions, in specific types of cells, and in single cells. It has been applied to a wide variety of animals including human, monkey, rat, and mouse, and provided us with a comprehensive view of the spatiotemporal dynamics of gene expression needed to identify the molecular networks unique to specific neuronal types (Okaty et al., 2011). Regarding the olfactory system, RNAs expressed in the developing mouse OB from embryonic day (E) 11 to postnatal day (P) 0 were previously identified, revealing approximately 5,570 genes that temporally change their expression level (Campbell et al., 2011). While understanding the temporal framework of gene expression is critical, spatial information is necessary to discriminate the molecules and pathways involved in development of specific types of neurons. To fill this void, we performed transcriptome analyses that specifically targeted the developing mitral/tufted cells.
Neurotensin (NTS) is a neuropeptide expressed by developing mitral/tufted cells (Kiyama et al., 1991). In a transgenic mouse in which the Nts allele was replaced with Nts-IRES-tauGfp (Nts-Gfp), only the mitral/tufted cells express GFP in the main OB during development (Walz et al., 2006). In this study, we utilized this transgenic mouse and performed genome-wide transcriptome analysis against GFP+ cells purified with FACS from Nts-Gfp mice at different embryonic days from E13 to P0. This work provides a comprehensive and systematic characterization of the spatiotemporal dynamics of the molecular signatures underlying mitral/tufted cell development in the OB.
Material and methods
Animals
Nts-Gfp mice, created by Dr. Mombaerts' laboratory (Ntstm1Mom/MomJ) (Walz et al., 2006), were obtained from the Jackson Laboratory (Stock#: 006702). The dams were checked every day for a copulation plug. The day on which we found a copulation plug was called E0, and the succeeding days of gestation were numbered in order. Prenatal embryos were harvested after pregnant dams were euthanized by CO2 inhalation, and P0 pups were rapidly decapitated. Whole litters were used to prepare total RNA from purified GFP+ and GFP- cells in the OB at each time point (8, 8, 7, and 8 mice for E13, E15, E17, and P0, respectively). All animal care and use was approved by the Yale University Animal Care and Use Committee.
Immunohistochemistry
Animals were fixed in 4% paraformaldehyde (PFA) overnight. The fixed brains were cryopreserved in 30% sucrose (wt/vol) in 0.1 M phosphate buffer (pH 7.4), and embedded in optimal cutting temperature compound (Sakura Finetek). The olfactory tissues were cut on a cryostat into 20 μm slices and stored at −20 °C until use. The slices were pretreated for 30 min in 0.025 M HCl at 65 °C, and rinsed with 0.1 M borate buffer (pH 8.5), PBS and TBS-T (10 mM Tris-HCl (pH 7.4), 100 mM NaCl with 0.3% Triton-X100 (vol/vol)). The slices were then blocked with blocking buffer (5% normal donkey serum (vol/vol) in TBS-T) at 20 – 25 °C for 1 h and incubated with primary antibodies diluted in blocking buffer overnight at 4 °C. Sections were washed with TBS-T, then incubated with secondary antibodies with 4′6-diamino-2-phenylindole dihydrochrolide (DAPI; Invitrogen) or DRAQ5 (Biostatus Ltd.) for nucleus staining for 1 h. The immunoreacted sections were washed and mounted with Gel/Mount mounting medium (Biomeda).
For primary antibodies, we used chicken anti-GFP (Abcam, #ab13970, immunogen: recombinant full length GFP, dilution 1:1000) and rabbit anti-Tbr1 (Abcam, #ab31940, immunogen: synthetic peptide conjugated to KLH derived from within residues 50 - 150 of Mouse TBR1, dilution 1:5000). Western blot analysis from mouse cardiomyocytes overexpressed with GFP plasmid with the anti-GFP antibody showed a single band (∼25 kDa) corresponding to the molecular weight of GFP. Western blot analysis from mouse hippocampus whole cell lysate with the anti-Tbr1 antibody showed a single band (∼74 kDa) corresponding to the molecular weight of Tbr1. Donkey anti-chicken Cy2 (Jackson Immunochemicals, 1:200) and donkey anti-rabbit Alexa555 (Life Technologies, 1:200) were used as secondary antibodies.
FACS purification and RNA preparation
Once the OB was dissected in cold Hanks' Balanced Salt Solution (HBSS), the tissue was immediately enzymatically digested for 30 minutes using the Papain Dissociation System (Worthington Biochemical Corporation; Lakewood, NJ), according to manufacturer instructions. The cell suspension was maintained on ice (also in dark) until FACS sorting to minimize unwanted transcriptional changes. Dissociated GFP+ and GFP− cells were purified with FACSVantage SE (BD) or MoFlo (Beckman-Coulter). The sorted cells were spun down at 300 rcf for 5 minutes to exclude with the excess buffer. Total RNA was extracted using RNeasy mini kit (Qiagen) and snap frozen at -80C for later analyses.
Library Preparation and Sequencing for mRNA
Optical density values of extracted RNA were measured using NanoDrop (Thermo Scientific) to confirm an A260:A280 ratio above 1.9. RNA integrity number (RIN) was measured using BioAnalyzer (Agilent) RNA 6000 Pico Kit to confirm RIN above 7. The cDNA libraries were prepared using the Ovation RNA-seq System V2 (NuGEN) as per the manufacturer's instructions. The unique barcode sequences were incorporated in the adaptors for multiplexed high-throughput sequencing. The final product was assessed for its size distribution and concentration using BioAnalyzer High Sensitivity DNA Kit (Agilent) and Kapa Library Quantification Kit (Kapa Biosystems). The libraries were pooled and diluted to 2 nM in EB buffer (Qiagen) and then denatured using the Illumina protocol. The denatured libraries were diluted to 10 pM by pre-chilled hybridization buffer and loaded onto TruSeq SR v3 flow cells on an Illumina HiSeq 2000 (Illumina) and run for 75 cycles using a single-read recipe (TruSeq SBS Kit v3, Illumina) according to the manufacturer's instructions. Illumina CASAVA pipeline (released version 1.8, Illumina) was used to obtain de-multiplexed sequencing reads (fastq files) passed the default purify filter. Additional quality filtering used FASTX-Toolkit (http://hannonlab.cshl.edu/fastx_toolkit) to keep only reads that have at least 80% of bases with a quality score of 20 or more (conducted by fastq_quality_filter function) and reads left with more than 10 bases after being trimmed with reads with a quality score of less than 20 (conducted by fastq_quality_trimmer function).
Transcriptome Assembly and Quality Control
A bowtie2 index was built for the GRCm38 genome assembly using bowtie version 2.2.3. The RNA-seq reads of each of the 8 samples were mapped using Tophat version 2.0.9 (Trapnell et al., 2009) supplied by Ensembl annotation file; GRCm38.78.gtf. Each sample's transcripts were assembled and their expression quantified using Cufflinks version 2.2.1 (Trapnell et al., 2010) supplied by GRCm38.78.gtf. The resulting assemblies were merged into a master transcriptome by Cuffmerge which was subsequently used by Cuffquant and Cuffnorm to generate normalized expression in FPKM and count tables for each sample. Normalization was performed via the median of the geometric means of fragment counts across all libraries, as described in Anders and Huber (Anders and Huber, 2010).
Coverage by chromosome of the mapped reads was calculated using the depth function of the samtools version 0.1.19 module. Exon coverage was calculated by using the intersectBed function of the bedtools version 2.20.1 module to intersect the chromosomal depths with the exons in GRCm38.78.gtf. Violin plots were generated using the vioplot version 0.2 R package. The density plots of FPKM values were generated by ggplot2 version 1.0.1 R package. RnaSeqMetrics function under Picard tools (v.1.102; http://picard.sourceforge.net) was used to compute the 5′-3′ coverage bias along gene body as well as the number of bases assigned to various classes of RNA.
The limma version 3.20.9 R package was used to perform quantile normalization of the log2 of the FPKM values of the reliably expressed protein coding genes, where reliably expressed protein coding genes were defined as two or more samples having FPKM >= 1 and protein coding genes were extracted by using the GENCODE Release M4 (GRCm38.p3) gene annotations. A Principal Component Analysis (PCA) plot was generated using the prcomp function of the R version 3.1.1. software. Z-scores of the gene expression values were used to create a heatmap by using the heatmap.2 function of the gplots R package, with parameters “average” for clustering method and 1-correlation for distance.
Differential Expression and Clustering Analysis
The genes given with any of “FAIL”, “LOWDATA”, or “HIGHDATA” frags by Cufflinks quantification status output (ref: http://cole-trapnell-lab.github.io/cufflinks/file_formats/) or with no expression in all samples were excluded from further analyses. Log2+1 transformed FPKM values were used for differential expression analyses. An R package maSigPro (Conesa et al., 2006) was used to identify temporally and spatially differentially expressed genes (DEX) across the developmental axis and/or cell type specificity; using developmental age (E13, E15, E17, and P0) as a quantitative factor and cell type (GFP+ or GFP−) as a qualitative factor. Differentially expressed genes were identified using Polynomial degree=2, R=0.4 and alpha=0.1 as significance cutoffs. R packages edgeR (Robinson et al., 2010) and TCC(Sun et al., 2013) was used to identify genes that are consistently highly expressed in GFP+ cells. Paired gene expression comparison between GFP+ and GFP− cells was conducted at each of 4 developmental stage after excluding genes that were called either temporal or spatial DEX from maSigPro analysis. A corrected p<0.05 was applied to determine significant differences.
Log2FPKM+1 values of 1,202 protein-coding positive DEX (ppDEX) were applied to vegan an R package (http://CRAN.R-project.org/package=vegan) to determine optimal number of clusters. The function cascadeKM was used to create several partitions forming a cascade from a small to a large number of groups formed by k-means based on Calinski criterion index (Calinski and Harabasz, 1974). K-means clustering was performed using MeV software (Howe et al., 2011). Median expression values for each ppDEX clusters were plotted by an R package ggplot2 (Wickham, 2009).
Functional Annotation Enrichment Analysis
Ingenuity Pathway Analysis (IPA, www.qiagen.com/ingenuity) was used to identify upstream regulators associated with genes listed in each of 5 inferred ppDEX clusters. Significance was measured by Fisher's exact test by having q<0.05 cut-off. Likewise, these 5 clusters were compared against 20 distinct clusters identified by Molyneaux et al (Molyneaux et al., 2015). Heatmaps were generated using the heatmap.2 function of the gplots R package.
Alternative Splicing Analysis
The juncBASE (Junction-Based Analysis of Splicing Events) version 0.9 software was used to identify and classify exon-centric alternative splicing events based on splice junction reads from Cufflinks and Cuffmerge (see Transcriptome Assembly above) and exon coordinates from GRCm38.78.gtf. For the identification of alternative splicing events and quantifying of events from each sample (step 5 of juncBASE) the following parameters were used: an sqlite de novo transcript database created from the Cuffmerge output (step 0 of juncBASE) for the “txt_db1” and “txt_db2” parameters and an sqlite transcript database created from the exons in GRCm38.78.gtf for the “txt_db3” parameter. In addition, the pairwise Fisher's Exact test function from juncBASE using the Benjamini & Hockberg multiple-testing correction method across the multiple splicing events tested was used to identify pairwise differentially spliced events. Spatially and temporally differentially spliced events were calculated for each event category: alternative acceptor, alternative donor, alternative first exon, alternative last exon, cassette, intron retention, AA only junction, AD only junction and mutually exclusive spliced events. The counts of the results were displayed using the VennDiagram version 1.6.9 R package.
Cuffdiff was used to identify isoform-centric alternative splicing events across 4 different time points. --min-reps-for-js-test option was set to either 1 or 2 depending on the number of replicates and q<0.05 was used to identify significance.
For the exon specific RT-PCR, an aliquot from the same total RNA that was used in the RNA-seq experiment was reverse transcribed using High Capacity cDNA reverse transcription kit (Life Technologies), and 1 ng of each cDNA was applied to PCR. The following primer pair was designed to target the upstream and downstream exons of the predicted novel alternative exon X, respectively: forward primer, 5′- CCGAATGTTTGCCGACCCTC -3′; reverse primer, 5′-AAGGACGAAGAGCCAGTCTTG -3′. Semiquantitative PCR was performed for 35 cycles (initially 94 °C for 2 min, denaturation at 94 °C for 30 s, annealing at 55 °C for 30 s and 72 °C for 60 s, and then 72 °C for 60 s). The 112-bp and 181-bp products for Clasp1 were applied to a BioAnalyzer High Sensitivity chip (Agilent Technologies) for quantification of each band that is specific to either inclusion or exclusion of an alternative exon.
Data Deposition
The data reported in this paper have been deposited in the Gene Expression Omnibus (GEO) database, www.ncbi.nlm.nih.gov/geo (accession no. GSE70896).
Results
Transcriptional landscape of developing olfactory projection neurons
In order to characterize the gene expression signature in developing OB projection neurons, we used the Nts-Gfp mouse which expresses GFP specifically in developing mitral and tufted cells of the main OB, but not in OB interneurons or in mitral cells of the accessory OB (Walz et al., 2006). Mitral cells, the first neuron to populate the main OB, are generated around E11 ± 2 days (Imamura et al., 2011). During this period, precursors of mitral cells are generated from progenitors in the ventricular zone (VZ) of the presumptive OB, and migrate radially to the intermediate zone (IZ) where they differentiate into mitral cells (Blanchart et al., 2006; Imamura et al., 2011; Imamura and Greer, 2013). At E13, GFP+ cells were found only in the IZ, and expressed TBR1. There were also TBR1+ cells that were GFP−, suggesting that GFP expression starts after TBR1 expression in likely newly born mitral/tufted cells (Fig. 1A1). Therefore, the GFP− cells are a mixed cell population, including both developing projection neurons and other cell types, especially at younger ages including E13. At P0, GFP+ cells localized predominately in the mitral cell layer (MCL) of OB, and some in the superficial granule cell layer (Fig. 1A2). Given that GFP+ cells outside the MCL are TBR1+, they are likely tufted cells migrating toward the EPL.
Figure 1. Purification of developing olfactory bulb projection neurons.
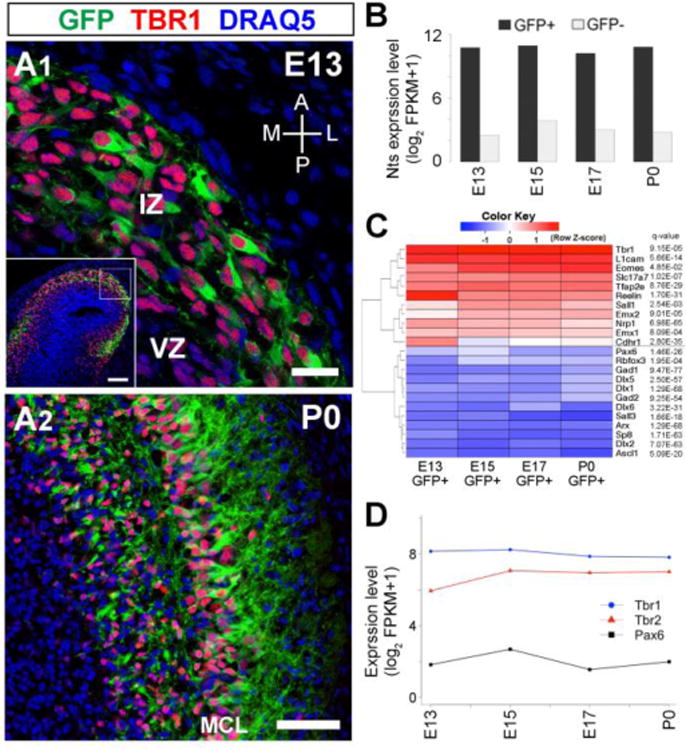
(A) Sections of E13 (A1) and P0 (A2) Nts-GFP mouse OBs immunohistochemically labeled with antibodies to GFP (green) and TBR1 (red). All nuclei are stained with DRAQ5 (blue). Scale bars, 20μm in (A1); 100μm in (inset of A1), and 200μm in (A2). (B) RNA-seq expression profiles for Nts in GFP+ and GFP− cells at each age, confirming purification of cells expressing Nts. (C) Heatmap of expression patterns for genes known to be expressed and not expressed in OB projection neurons; confirming the identity of GFP+ cells as projection neurons. The q-values indicate significances of up-regulation or down-reguation in GFP+ populations. (D) Time course of Tbr1, Tbr2, and Pax6 expression in GFP+ cells.
To characterize the spatiotemporal dynamics of molecular signatures in developing mitral/tufted cells, we purified GFP+ and GFP− cells with FACS from OBs at E13, E15, E17, and at birth (P0). To avoid significant contamination of GFP- cells in the population of GFP+ cells, we only collected cells that represented a departure from major cell populations toward the stronger GFP side. As for GFP- cells, we only collected cells from the lowest GFP intensity. The percentages of cells collected as GFP+ and GFP- cells collected were no more than 15% and 20% of total cells, respectively (Fig. S1A). Then, RNA was extracted from each population for genome-wide transcriptome analysis, RNA-seq analysis. To obtain comprehensive transcriptome information from a limited number of cells, we used NuGEN's Ovation RNA-Seq V2 System which can capture both poly-A and non-poly-A RNAs starting from as low as 500 pg (50 cells equivalent amount) of total RNA. All of the RNA and sequencing libraries were prepared at the same time and sequenced in the same flow cell to eliminate as much as possible any confounding factors. We obtained 17.9 ± 1.2 million high quality reads at 1×75 bp per each sample. Tophat alignment utilized Ensembl reference genome and annotation file (GRCm38, build 38, release 78), which is robust and comprehensive, as it incorporates manual gene annotation by Vega/Havana into its automatic annotation including a comprehensive list of both coding and non-coding genes. The registered number of coding genes is 22,606, non-coding genes is 11,622, pseudogenes is 8,015, and gene transcripts is 103,734 under the current build (Flicek et al., 2013).
We first monitored sequencing quality and robustness across mouse genome/chromosomes. The aligned reads contained minimum ribosomal RNA contamination (approximately 5%). They consisted of approximately 20% of the mouse whole genome, approximately 50% of the exonic regions (transcriptome), and there was minimal 5′ to 3′ bias (Fig. S1B), which can lead to false-positive differential gene expression callings. Interestingly, only 0.4% was transcribed from the Y chromosome, while almost 100% was transcribed from the mitochondrial chromosome (Fig. S1C). The distribution of FPKM values is consistent across samples, with a typical abundance in protein-coding genes over non-coding genes (Fig S1D). The transcription occurred not only within the coding region (∼18%), but also within intronic regions of known protein-coding genes (∼40%), which may suggest the existence of novel alternative splicing isoforms such as intron retention (Fig. S1E). The remaining ∼8% of reads aligned within intergenic regions (Fig. S1E), suggesting the expression of novel transcripts. To assess similarities and differences among samples, we performed a principal component analysis (PCA) analysis. The results demonstrate that samples cluster first according to the type of the cells (PC1: 43.7% explained variance) and second to the age of the mouse (PC2: 18.5% explained variance) (Fig. S1F), indicating genome-wide transcriptional architecture was more influenced by the cell type rather than the developmental stage of the cell.
We evaluated our study with previously known markers of projection neurons and interneurons in the OB. First, expression of Nts was much higher in GFP+ than GFP− at all ages, indicating the success of purification of developing projection neurons expressing Nts (Fig. 1B). We then extended the analysis more broadly to a cohort of genes that are known as markers for specific populations in the OB. Because GFP− cells are a mixed cell population of projection neurons and interneurons in younger ages, we focused our analyses on GFP+ cells. As anticipated, the GFP+ cell population showed significant expression of 11 genes that are known to express in developing OB projection neurons. These genes include Tbr1, Eomes (also known as Tbr2) (Imamura and Greer, 2013), Cdhr1 (Pcdh21) (Nagai et al., 2005), Slc17a7 (vGluT1) (Gabellec et al., 2007), Tfap2e (AP2ε) (Feng et al., 2009), Reelin (Imamura et al., 2006), Emx1, Emx2 (Mallamaci et al., 1998), Sall1 (Harrison et al., 2007), Nrp1, and L1cam (Inaki et al., 2004). While less or no expression was observed for 12 genes whose expression in OB projection neurons is not observed. They are Pax6 (Imamura and Greer, 2013), Rbfox3 (NeuN), Gad2 (Gad65), Gad1 (Gad67) (Imamura et al., 2006), Dlx1, Dlx2, Dlx5 and Dlx6 (Brill et al., 2008), Sall3 (Harrison et al., 2008), Arx (Yoshihara et al., 2005), Sp8 (Waclaw et al., 2006), and Ascl1 (Shaker et al., 2012) (Fig. 1C).
Temporal changes were also evaluated. We previously suggested that TBR1 precedes the expression of TBR2 in mitral cell precursors, which is different from the cortical projection neurons in which the maturational sequence is reversed with TBR2 appearing prior to TBR1 (Imamura and Greer, 2013). Since TBR1 appears prior to GFP in Nts-Gfp mouse OB, Tbr1 expression was always high at all ages examined. In contrast, Tbr2 expression in GFP+ cells at E13 was slightly less than later ages (Fig. 1D). This result indicates that Tbr2 appears later than Tbr1 in GFP+ cells, which is consistent with our previous finding. Together, these data demonstrate that FACS purification based on GFP from Nts-Gfp mice can be utilized to obtain high-quality RNA to resolve transcriptional dynamics of developing mitral/tufted cells.
Differential Gene Expression
We employed R package maSigPro (Conesa et al., 2006) to identify differentially-expressed genes (DEX) across the developmental axis and/or cell type; using developmental age (E13, E15, E17, and P0) as a quantitative factor and cell type (GFP+ or GFP−) as a qualitative factor. Using Polynomial degree=2, R=0.4 and alpha=0.1 as significance cutoffs, we identified 1,514 genes (among 23,792 genes with FPKM>0 at least in one sample = 6.3% of all expressed genes) that were significantly different across ages within GFP+ cells (pDEX) (Table S1), while 1,664 genes (7.0% of all expressed genes) were significantly different with age within GFP− cells (nDEX) (Fig. 2A). Among these, more than two-thirds (1,126, 4.7% of all expressed genes) were common in pDEX and nDEX groups, which are considered to be the genes with the most robust expression changes in the entire OB. Moreover, 388 genes were differentially regulated in GFP+ cells, but did not show significant temporal changes in GFP− cells. These genes that increase or decrease with age only in GFP+ cells are also interesting, as they may represent key regulators of mitral/tufted cell development. Ingenuity Pathway Analysis (IPA) revealed “Axon Guidance Signaling” as the most significant canonical pathway (p=4.13E-04), which is consistent with the fact that interneurons in the OB are mostly anaxonic.
Figure 2. Clustering of genes expressed in developing mitral/tufted cells.

(A) Venn diagram representing the number of genes significantly different across age within GFP+ (pDEX) and GFP− cells (nDEX). (B) Developmental trajectories of genes in NTS cluster that show significantly higher expression in GFP+ than GFP− cells and do not change their expression level during the 6 days analyzed. (C) Developmental trajectories of 5 gene clusters classified with differential expression profiles in GFP+ cells. (D) Lists of the top upstream regulators identified with IPA for the 5 clusters genes expressed in GFP+ cells.
In addition to the temporal DEX (pDEX and nDEX), we explored genes that are spatially differentially expressed at consistent expression levels throughout the developmental periods we monitored. After excluding temporal DEX, we used R packages edgeR (Robinson et al., 2010) and TCC (Sun et al., 2013) to conduct paired gene expression comparison between GFP+ and GFP− cells at each of the 4 developmental stages. This approach identified 881 protein-coding genes significantly and consistently upregulated in GFP+ mitral/tufted cells, which is analogous to the expression profile of Nts gene (q<0.05, Fig. 2B and Table S2). In addition to Nts, these genes included many marker genes for mitral/tufted cells such as Reelin, Slc17a7, and Cntn2 (Tag-1) (Gabellec et al., 2007; Nakajima et al., 2001; Wolfer et al., 1998). This analysis also identified a similar number of genes significantly and consistently down-regulated in mitral/tufted cells (data not shown).
To decipher the developmental signature of the transcriptome within mitral/tufted cells, the downstream analysis focused on the temporal differences in GFP+ cells. Among the 1,514 pDEX genes, only protein-coding genes were extracted (1,202 genes, Table S3, protein-coding positive DEX: ppDEX) for cluster analysis. We further classified these ppDEX genes into distinct clusters based on k-means clustering (Forgy, 1965) (Fig. 2C and Table S4). By calculating the Calinski criterion index (Calinski and Harabasz, 1974), the optimal number of clusters was set at 5 (Fig S2A). Each cluster represented gene expression trajectories either in increasing or decreasing patterns across development (Fig. 2C and Fig. S2B). Furthermore, IPA was used to find potential upstream regulators of each cluster. Top five potential upstream regulators suggested with this analysis were unique to each cluster (Fig. 2D). These results are useful to explore molecular determinants that may regulate developmental events occurring during mitral/tufted cell development and fate determination.
Alternative Splicing Events
We utilized the RNA-seq data to further explore alternative splicing events. Analysis of alternative splicing can be performed using two different approaches; isoform centric approach or exon centric approach (Hooper, 2014). Isoform-centric approaches, including Cuffdiff (Trapnell et al., 2010), will utilize a model that assumes genes are expressing arbitrarily many isoforms through alternative splicing, but the accuracy and the sensitivity will be dependent on sequencing methods and depths. Our Cuffdiff analysis predicted 1,850 isoform switches, 551 promoter switches, 1,087 CDS switches, respectively, when the temporal changes were taken into account in GFP+ cells (Fig. 3A). Exon-centric approaches, including JuncBASE (Brooks et al., 2011), will consider an inclusion ratio of each individual exon, which can be included in multiple transcript isoforms and excluded in another set of isoforms. We find the latter is more robust in predicting comprehensive alternative splicing events, so we extended our focus on this latter data set.
Figure 3. Alternative splicing events in developing mitral/tufted cells.
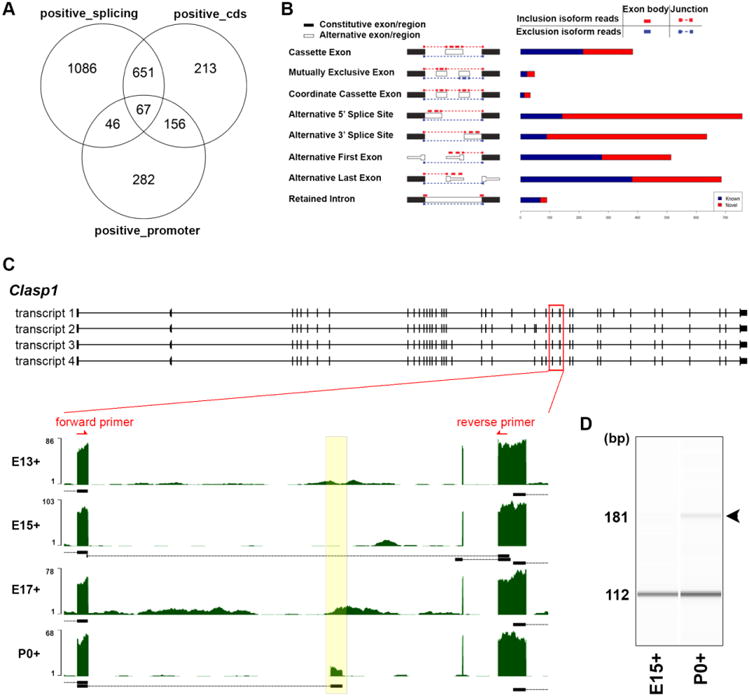
(A) Venn diagram describing the total number of significant regulatory events identified with Cuffdiff analysis. (B) Numbers of known (blue) and newly identified (red) temporally regulated splicing events identified with JuncBASE analysis. Diagram of each event is adapted from the manual of JuncBASE (REF). (C) Reads coverage in the Clasp1 gene region including a novel exon X. The yellow box highlights the temporal coverage of mRNA-seq reads mapped to exon X. Black bars/boxes underneath the exonic read distribution indicate exon junctions. Red arrows depict location of exon-specific PCR primers. (D) Exon-specific PCR of the cassette exons flanking exon X in the mouse OB at E15 and P0.
Using JuncBASE, we analyzed eight basic splicing modalities: cassette exon, mutually exclusive exon, coordinate cassette exons, alternative 5′ or 3′ splice site, alternative first or last exon, and retained intron (Fig. 3B). We found a total of 3,422 alternative splicing events that were significantly differentially regulated across the developmental time points, among which alternative acceptor and alternative donor events were the the most frequent among 8 different modalities (757 and 636, respectively). Additionally, alternative splicing events were split into known and novel groups (Fig. 3B), 1,304 and 2,118 events were defined as known or novel events, respectively.
From these novel groups predicted by JuncBASE, we confirmed the expression of as-yet-unknown isoforms. As an example, we identified a novel cassette exon of Clasp1 gene, a microtubule-associated protein involved in the regulation of microtubule dynamics (Galjart, 2005). There are four transcripts registered for mouse Clasp1. We detected reads that span an exon common to all Clasp1 transcript variants (exon 26, 28, 25, and 26, respectively) and a cassette exon not previously reported; hereafter we refer to this new exon as exon X (Fig. 3C). Exon X consists of 69 base pairs, and therefore, inserts a novel 23 amino acids sequences into known CLASP1 isoforms. We previously employed RNA-seq analysis against the cells in developing mouse primary somatosensory neocortex (Fertuzinhos et al., 2014). However, the expression of a CLASP1 isoform with exon X was not identified. While Clasp1 is a ubiquitously expressed gene, expression of exon X may be specific to cells in the OB. We also found that exon X expression was temporally regulated. Among the GFP+ cell populations, the junction that connects exon X and the previous exon was detected only at P0, while total Clasp1 mRNA expression level was not significantly changed during development. We confirmed this observation by exon specific RT-PCR analysis comparing E15 and P0. A 112 base pair fragment without exon X was amplified from both RNAs purified from P0 and E15 GFP+ cell, while a 181 base pair fragment containing exon X was amplified only from RNAs purified from P0 GFP+ cells (Fig. 3D).
In addition, we identified a novel cassette exon of Creb1 gene, cAMP responsive element binding protein 1 (Fig. S3). No Creb1 transcript with this exon has been previously predicted. Like exon X of Clasp1, this exon was not included in the Creb1 isoforms expressed in developing mouse primary somatosensory cortex (Fertuzinhos et al., 2014). Because CREB1 is a transcription factor, this isoform that is a novel find in the OB may regulate the transcription of genes that endow characteristic features of OB projection neurons. All significantly differentially spliced events based on Fisher's pair wise comparisons are summarized in Table S5.
Concordant Gene Expression Signature between Developing Mitral/Tufted cells and Neocortical Projection Neurons
Since the OB emerges from the anterior tip of the telencephalic vesicle during embryonic development (Miller et al., 2010), mitral/tufted cells are often presented as the OB counterpart of cortical projection neurons. Comparison of the temporal dynamics of molecular signatures of developing projection neurons in the cerebral cortex and OB will inform us about the similarity of molecular expression patterns in these neurons. Several studies have performed genome-wide transcriptome analyses on developing cortical projection neurons (Cahoy et al., 2008; Darmanis et al., 2015; van de Leemput et al., 2014). In particular, a recent report from Dr. Arlotta's laboratory is suited for the comparison with our data because the age and methods used were similar to those we employed here (Molyneaux et al., 2015). The authors sub-classified the developing cortical projection neurons at E15.5, E16.5, E18.5 and P1 based on the expression patterns of 3 transcription factors; callosal projection neurons (CPN) (BCL11Blow, TLE4low, SATB2high), subcerebral projection neurons (ScPN) (BCL11Bhigh, TLE4low, SATB2low), and corticothalamic/subplate neurons (CThPN) (BCL11Bmed, TLE4high, SATB2low), and purified each cell population using FACS. To determine whether there is any significant and concordant gene expression signature between the temporally differentially-regulated genes in mitral/tufted cells (pDEX genes) and the specific gene clusters of the reported cortical projection neurons, we performed Fisher's exact test between each of the 5 k-means clusters of pDEX and the curated 20 gene sets of distinct neuronal specification signatures provided by Molyneaux et al. (Molyneaux et al., 2015). The result revealed that there was a significant concordance between the gene sets of clusterD and Molyneaux's cluster18 (p=2.96E-12), which was one of the ScPN signature clusters, and showed significant concordance also with clusterC (p=7.72E-07) and clusterE (p=1.35E-05). It is noteworthy that both clusterD and Molyneaux's cluster18 consist of genes that increase gradually during development (Fig. 4), while clusterD did not show significant concordance with Molyneaux's cluster5 (p>0.05) and 9 (p=0.05) consisting of genes gradually increasing in CPN and CThPN, respectively. ClusterA and clusterB were significantly concordant with Molyneaux's cluster19 (p=7.92E-12 and 8.14E-10, respectively) that is a cell-type independent cluster. These results indicate that the molecular signature of developing olfactory projection neuron bears a stronger resemblance to that of ScPN than CPN or CThPN. This is consistent with the finding that developing mitral/tufted cells showed the highest Bcl11b and the lowest Satb2 expression levels at E13; FPKM values of Bcl11b, Tle4, and Satb2 in GFP+ cells at E13 are 99.7, 12.8, and 0.04, respectively.
Figure 4. Comparison of gene clusters between developing OB and cortical projection neurons.
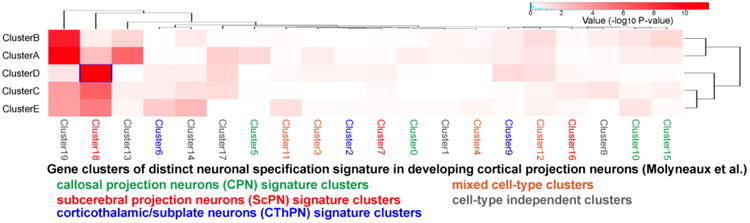
A heatmap representing the concordance between the gene sets of 5 clusters of developing OB projection neurons and 20 clusters of developing cortical projection neurons reported by Molyneaux et al (2015). Fisher's exact test was performed to evaluate statistical significance.
Discussion
Here, we revealed the temporal dynamics of molecular signatures in developing projection neurons in the mouse OB. We identified 2,052 genes that are temporally differentially-expressed in the developing OB over 6 days, from E13 to P0. Previous microarray experiments reported 5,570 genes that temporally change their expression level in the developing OB from E11 to P0 (Campbell et al., 2011). Although the difference in the number of identified genes may be due to the different methods, it is also possible it reflects changes in OB development from E11 to E13. In fact, the microarray analysis found genes that increase or decrease expression level between E11 and E13 and are unchanged thereafter. The authors classified these up-regulated and down-regulated genes into cluster2 and cluster6, respectively. We found that 20.7% (182/881) of genes listed in the NTS cluster, which shows significantly higher expression in GFP+ than GFP− cells and does not change expression level during the 6 days analyzed, were also found in cluster2 of the microarray analysis. Since mitral cells are mostly generated between E10 and E12, these genes may be involved in the generation of mitral cells.
The general laminar organization and elaborate morphologies of OB projection neurons have been well known for several decades, but we continue to lack insight into their developmental mechanisms. Previous studies revealed the timeline of anatomical changes of developing mitral cells; following mitral cell generation, cells with definitive axons and dendrites appear around E12 or E13 (Blanchart et al., 2006; Hinds, 1972), dendrites integrate with olfactory sensory neuron axons to form protoglomeruli around E16 (Treloar et al., 1999), and synapse formation in glomeruli and olfactory cortex is robust during late embryonic and early postnatal stages (Hinds and Hinds, 1976). The next step is to understand the molecular determinants and pathways regulating the specific anatomical changes occurring during mitral/tufted cell development. A significant finding of our analysis is identification of 1,202 protein-coding genes temporally regulated in developing mitral/tufted cells. It is generally suggested that subsets of neurotransmitter receptors and synaptic mRNAs are often appear at the later stages of neuronal mauration. In this study, we classified the 1,202 genes into 5 different clusters with different temporal regulation patterns. In doing so we found several mRNAs of genes associated with synapse development, such as syntaxin10, syntaxin12, and synaptopodin, in clusterD that represents gradually increased expression during development. On the other hand, most of mRNAs for neurotransmitter receptors, such as GABA receptors and glutamate receptors, are listed in NTS clusters. This may indicate that signals from neurotransmitter receptors stimulate synapse maturation in developing mitral/tufted cells.
We also performed the s analysis suggesting upstream regulators that may regulate expression of genes listed in each 5 cluster. For example, suggested top 2 upstream regulators for genes in clusterA were Rtn4, and Eomes (Tbr2), which were found in clusterA and D, respectively. ClusterA and D include the genes whose mRNA levels gradually decrease and increase in developing mitral/tufted cells, respectively. Since RTN4 is also known as a negative regulator of neurite outgrowth, down-regulation of Rtn4 gene expression may be a critical step to down-regulate the expression of other genes in clusterA and to initiate the neurite outgrowth in developing mitral/tufted cells. In contrast, Eomes may negatively regulate expression of genes in clusterA to promote the differentiation of mitral/tufted cells. Our IPA analysis also shed light on many molecules that are not included in either NTS cluster or clustersA-E as potential upstream regulators. For example, Itgb1 was ranked as the most significant upstream regulator for clusterD. ITGB1 activation is known to be required for axonal formation (Lei et al., 2012). Although its gene expression stays consistently high in all samples we analyzed (data available in the GEO (accession no. GSE70896)), increased activation of the ITGB1 protein across the time might be associated with the maturation of mitral/tufted cells. Further studies are necessary to reveal the importance of these molecules in development of OB projection neurons. Together with the anatomical timeline, the results have a strong potential to provide a new foundation for understanding the molecular pathways involved in each event.
In the developing cerebral cortex the identities of projection neuron subtypes are largely determined by a combination of expressed transcription factors (Kwan et al., 2012; Molyneaux et al., 2007; Shibata et al., 2015) Our analysis also suggested that the temporal dynamics of molecular signatures in developing mitral/tufted cells bears a strong resemblance to that of ScPN, which consists largely of neocortical projection neurons located in deep-layer 5 and extending projections to the brainstem and spinal cord. The development of ScPN is controlled by a transcription factor, BCL11B, also known as CTIP2 (Arlotta et al., 2005). Here we found that Bcl11b is highly expressed by developing mitral/tufted cells as well. Albeit the background strain used by Dr. Arlotta's laboratory, CD1, was different from Nts-Gfp mouse, 129×C57BL/6J, no strain difference in development of mitral/tufted cells has been suggested. Therefore, the molecular pathways regulated by Bcl11b for the differentiation of ScPN may also play important roles in development of mitral/tufted cells.
In contrast, mitral/tufted cells possess a unique dendritic morphology as well as characteristic axonal projection patterns; projecting to the ventral telencephalon, olfactory cortex, which is not innervated by cortical projection neurons. Information on molecular pathways unique to the developing OB projection neurons is necessary to understand how these characteristic features are acquired. In addition to Bcl11b, development of ScPN is regulated by another transcription factor, FEZF2 (also known as FEZL or ZFP312), expressed by layer 5 projection neurons (Chen et al., 2005a; Chen et al., 2005b; Molyneaux et al., 2005). In contrast, layer 6 projection neurons express TBR1 that promotes the identity of CthPN and represses ScPN fates by reducing expression of Fezf2 and Bcl11b (Han et al., 2011; McKenna et al., 2011). Interestingly, developing OB projection neurons express all three of these transcription factors. Although the mechanisms of how Fezf2 and Bcl11b slip through TBR1-mediated suppression remain to be elucidated, the novel combination of transcription factors may activate unique molecular pathways in developing mitral/tufted cells. For example, unlike cortical projection neurons, developing mitral cells express Tbr1 prior to Tbr2 which is involved in dendritic specification during postnatal development (Mizuguchi et al., 2012).
In addition, we found several previously unknown isoforms in the analyses of unreported alternative splicing. Such highly dynamic splicing events may be an underlying mechanism for mitral/tufted cells to acquire characteristic properties.
Defects in the development of the OB are expected to cause severe impairment in mammalian olfaction. In fact, olfactory dysfunction is a major symptom of Kallmann and CHARGE syndromes that are frequently associated with the malformation of OB (Koenigkam-Santos et al., 2011; Pinto et al., 2005). Mutations in Chd7, an ATP-dependent chromatin remodeling enzyme and a potential regulator of gene expression, that cause CHARGE syndrome have been identified (Lalani et al., 2006). However, the role of CHD7 in OB development remains largely unknown. Here, we also identified Chd7 is included in the clusterD, which represents increased expression during the development of mitral/tufted cells (Fig. S2B). Significantly higher expression of Chd7 at E15, E17 and P0 than E13 was independently confirmed by quantitative real-time PCR (qRT-PCR) (Fig. S4). These suggest possible roles for CHD7 in the development of OB projection neurons, and that the genes co-clustered with Chd7 might be either upstream or downstream regulators of Chd7.
Conclusions
In this study, we generated a temporally-dynamic and cell-type-specific RNA-seq data set within the mouse OB. Our analysis provides fundamental information about the spatiotemporal dynamics of molecular signatures during OB projection neuron development. This information can be used to reveal: 1) the molecular mechanisms regulating mitral/tufted cell development; 2) the molecular pathways that endow mitral/tufted cells with characteristic anatomical features; and 3) the molecular functions in olfactory dysfunction diseases.
Supplementary Material
Highlights.
We performed transcriptome analysis targeting developing OB projection neurons.
1,202 protein-coding genes are temporally regulated in OB projection neurons.
These genes were classified into 5 co-expression clusters.
We compared the molecular signatures of OB and cortical projection neurons.
We identified several genes expressing a novel isoform not previously reported.
Acknowledgments
We thank Yale Flow Cytometry Core for cell sorting and Yale Center for Genome Analysis (YCGA) for performing Illumina sequencing. This work is supported by the NIH-NIDCD DC011134 and 2014 Pilot Grant from the CHARGE Syndrome Foundation to FI, and the NIH-NIMH MH103339 and MH106934 to NS, and NIH-NIDCD DC012441, DC13791 and DC00210 to CAG.
Footnotes
Publisher's Disclaimer: This is a PDF file of an unedited manuscript that has been accepted for publication. As a service to our customers we are providing this early version of the manuscript. The manuscript will undergo copyediting, typesetting, and review of the resulting proof before it is published in its final citable form. Please note that during the production process errors may be discovered which could affect the content, and all legal disclaimers that apply to the journal pertain.
References
- Anders S, Huber W. Differential expression analysis for sequence count data. Genome Biol. 2010;11:R106. doi: 10.1186/gb-2010-11-10-r106. [DOI] [PMC free article] [PubMed] [Google Scholar]
- Arlotta P, Molyneaux BJ, Chen J, Inoue J, Kominami R, Macklis JD. Neuronal subtype-specific genes that control corticospinal motor neuron development in vivo. Neuron. 2005;45:207–221. doi: 10.1016/j.neuron.2004.12.036. [DOI] [PubMed] [Google Scholar]
- Blanchart A, De Carlos JA, López-Mascaraque L. Time frame of mitral cell development in the mice olfactory bulb. J Comp Neurol. 2006;496:529–543. doi: 10.1002/cne.20941. [DOI] [PubMed] [Google Scholar]
- Brill MS, Snapyan M, Wohlfrom H, Ninkovic J, Jawerka M, Mastick GS, Ashery-Padan R, Saghatelyan A, Berninger B, Götz M. A dlx2- and pax6-dependent transcriptional code for periglomerular neuron specification in the adult olfactory bulb. J Neurosci. 2008;28:6439–6452. doi: 10.1523/JNEUROSCI.0700-08.2008. [DOI] [PMC free article] [PubMed] [Google Scholar]
- Brooks AN, Yang L, Duff MO, Hansen KD, Park JW, Dudoit S, Brenner SE, Graveley BR. Conservation of an RNA regulatory map between Drosophila and mammals. Genome Res. 2011;21:193–202. doi: 10.1101/gr.108662.110. [DOI] [PMC free article] [PubMed] [Google Scholar]
- Cahoy JD, Emery B, Kaushal A, Foo LC, Zamanian JL, Christopherson KS, Xing Y, Lubischer JL, Krieg PA, Krupenko SA, Thompson WJ, Barres BA. A transcriptome database for astrocytes, neurons, and oligodendrocytes: a new resource for understanding brain development and function. J Neurosci. 2008;28:264–278. doi: 10.1523/JNEUROSCI.4178-07.2008. [DOI] [PMC free article] [PubMed] [Google Scholar]
- Calinski T, Harabasz J. A dendrite method for cluster analysis. Communications in Statistics. 1974;3:1–27. [Google Scholar]
- Campbell GR, Baudhuin A, Vranizan K, Ngai J. Transcription factors expressed in olfactory bulb local progenitor cells revealed by genome-wide transcriptome profiling. Mol Cell Neurosci. 2011;46:548–561. doi: 10.1016/j.mcn.2010.12.012. [DOI] [PMC free article] [PubMed] [Google Scholar]
- Chen B, Schaevitz LR, McConnell SK. Fezl regulates the differentiation and axon targeting of layer 5 subcortical projection neurons in cerebral cortex. Proc Natl Acad Sci U S A. 2005a;102:17184–17189. doi: 10.1073/pnas.0508732102. [DOI] [PMC free article] [PubMed] [Google Scholar]
- Chen JG, Rašin MR, Kwan KY, Šestan N. Zfp312 is required for subcortical axonal projections and dendritic morphology of deep-layer pyramidal neurons of the cerebral cortex. Proc Natl Acad Sci U S A. 2005b;102:17792–17797. doi: 10.1073/pnas.0509032102. [DOI] [PMC free article] [PubMed] [Google Scholar]
- Conesa A, Nueda MJ, Ferrer A, Talon M. maSigPro: a method to identify significantly differential expression profiles in time-course microarray experiments. Bioinformatics. 2006;22:1096–1102. doi: 10.1093/bioinformatics/btl056. [DOI] [PubMed] [Google Scholar]
- Darmanis S, Sloan SA, Zhang Y, Enge M, Caneda C, Shuer LM, Hayden Gephart MG, Barres BA, Quake SR. A survey of human brain transcriptome diversity at the single cell level. Proc Natl Acad Sci U S A. 2015;112:7285–7290. doi: 10.1073/pnas.1507125112. [DOI] [PMC free article] [PubMed] [Google Scholar]
- Feng W, Simoes-de-Souza F, Finger TE, Restrepo D, Williams T. Disorganized olfactory bulb lamination in mice deficient for transcription factor AP-2epsilon. Mol Cell Neurosci. 2009;42:161–171. doi: 10.1016/j.mcn.2009.06.010. [DOI] [PMC free article] [PubMed] [Google Scholar]
- Fertuzinhos S, Li M, Kawasawa YI, Ivic V, Franjic D, Singh D, Crair M, Sestan N. Laminar and temporal expression dynamics of coding and noncoding RNAs in the mouse neocortex. Cell reports. 2014;6:938–950. doi: 10.1016/j.celrep.2014.01.036. [DOI] [PMC free article] [PubMed] [Google Scholar]
- Flicek P, Ahmed I, Amode MR, Barrell D, Beal K, Brent S, Carvalho-Silva D, Clapham P, Coates G, Fairley S, Fitzgerald S, Gil L, Garcia-Giron C, Gordon L, Hourlier T, Hunt S, Juettemann T, Kahari AK, Keenan S, Komorowska M, Kulesha E, Longden I, Maurel T, McLaren WM, Muffato M, Nag R, Overduin B, Pignatelli M, Pritchard B, Pritchard E, Riat HS, Ritchie GR, Ruffier M, Schuster M, Sheppard D, Sobral D, Taylor K, Thormann A, Trevanion S, White S, Wilder SP, Aken BL, Birney E, Cunningham F, Dunham I, Harrow J, Herrero J, Hubbard TJ, Johnson N, Kinsella R, Parker A, Spudich G, Yates A, Zadissa A, Searle SM. Ensembl 2013. Nucleic Acids Res. 2013;41:D48–55. doi: 10.1093/nar/gks1236. [DOI] [PMC free article] [PubMed] [Google Scholar]
- Forgy EW. Cluster analysis of multivariate data: efficiency versus interpretability of classifications. Biometrics. 1965;21:768–769. [Google Scholar]
- Gabellec MM, Panzanelli P, Sassoe-Pognetto M, Lledo PM. Synapse-specific localization of vesicular glutamate transporters in the rat olfactory bulb. Eur J Neurosci. 2007;25:1373–1383. doi: 10.1111/j.1460-9568.2007.05400.x. [DOI] [PubMed] [Google Scholar]
- Galjart N. CLIPs and CLASPs and cellular dynamics. Nat Rev Mol Cell Biol. 2005;6:487–498. doi: 10.1038/nrm1664. [DOI] [PubMed] [Google Scholar]
- Han W, Kwan KY, Shim S, Lam MM, Shin Y, Xu X, Zhu Y, Li M, Sestan N. TBR1 directly represses Fezf2 to control the laminar origin and development of the corticospinal tract. Proc Natl Acad Sci U S A. 2011;108:3041–3046. doi: 10.1073/pnas.1016723108. [DOI] [PMC free article] [PubMed] [Google Scholar]
- Harrison SJ, Nishinakamura R, Monaghan AP. Sall1 Regulates Mitral Cell Development and Olfactory Nerve Extension in the Developing Olfactory Bulb. Cereb Cortex. 2007 doi: 10.1093/cercor/bhm191. [DOI] [PubMed] [Google Scholar]
- Harrison SJ, Parrish M, Monaghan AP. Sall3 is required for the terminal maturation of olfactory glomerular interneurons. J Comp Neurol. 2008;507:1780–1794. doi: 10.1002/cne.21650. [DOI] [PMC free article] [PubMed] [Google Scholar]
- Hinds JW. Early neuron differentiation in the mouse of olfactory bulb. I. Light microscopy. J Comp Neurol. 1972;146:233–252. doi: 10.1002/cne.901460207. [DOI] [PubMed] [Google Scholar]
- Hinds JW, Hinds PL. Synapse formation in the mouse olfactory bulb. I. Quantitative studies. J Comp Neurol. 1976;169:15–40. doi: 10.1002/cne.901690103. [DOI] [PubMed] [Google Scholar]
- Hooper JE. A survey of software for genome-wide discovery of differential splicing in RNA-Seq data. Human genomics. 2014;8:3. doi: 10.1186/1479-7364-8-3. [DOI] [PMC free article] [PubMed] [Google Scholar]
- Howe EA, Sinha R, Schlauch D, Quackenbush J. RNA-Seq analysis in MeV. Bioinformatics. 2011;27:3209–3210. doi: 10.1093/bioinformatics/btr490. [DOI] [PMC free article] [PubMed] [Google Scholar]
- Imamura F, Ayoub AE, Rakic P, Greer CA. Timing of neurogenesis is a determinant of olfactory circuitry. Nat Neurosci. 2011;14:331–337. doi: 10.1038/nn.2754. [DOI] [PMC free article] [PubMed] [Google Scholar]
- Imamura F, Greer CA. Pax6 regulates Tbr1 and Tbr2 expressions in olfactory bulb mitral cells. Mol Cell Neurosci. 2013;54:58–70. doi: 10.1016/j.mcn.2013.01.002. [DOI] [PMC free article] [PubMed] [Google Scholar]
- Imamura F, Nagao H, Naritsuka H, Murata Y, Taniguchi H, Mori K. A leucine-rich repeat membrane protein, 5T4, is expressed by a subtype of granule cells with dendritic arbors in specific strata of the mouse olfactory bulb. J Comp Neurol. 2006;495:754–768. doi: 10.1002/cne.20896. [DOI] [PubMed] [Google Scholar]
- Inaki K, Nishimura S, Nakashiba T, Itohara S, Yoshihara Y. Laminar organization of the developing lateral olfactory tract revealed by differential expression of cell recognition molecules. J Comp Neurol. 2004;479:243–256. doi: 10.1002/cne.20270. [DOI] [PubMed] [Google Scholar]
- Kiyama H, Sato M, Emson PC, Tohyama M. Transient expression of neurotensin mRNA in the mitral cells of rat olfactory bulb during development. Neurosci Lett. 1991;128:85–89. doi: 10.1016/0304-3940(91)90765-l. [DOI] [PubMed] [Google Scholar]
- Koenigkam-Santos M, Santos AC, Versiani BR, Diniz PR, Junior JE, de Castro M. Quantitative magnetic resonance imaging evaluation of the olfactory system in Kallmann syndrome: correlation with a clinical smell test. Neuroendocrinology. 2011;94:209–217. doi: 10.1159/000328437. [DOI] [PubMed] [Google Scholar]
- Kwan KY, Sestan N, Anton ES. Transcriptional co-regulation of neuronal migration and laminar identity in the neocortex. Development. 2012;139:1535–1546. doi: 10.1242/dev.069963. [DOI] [PMC free article] [PubMed] [Google Scholar]
- Lalani SR, Safiullah AM, Fernbach SD, Harutyunyan KG, Thaller C, Peterson LE, McPherson JD, Gibbs RA, White LD, Hefner M, Davenport SL, Graham JM, Bacino CA, Glass NL, Towbin JA, Craigen WJ, Neish SR, Lin AE, Belmont JW. Spectrum of CHD7 mutations in 110 individuals with CHARGE syndrome and genotype-phenotype correlation. American journal of human genetics. 2006;78:303–314. doi: 10.1086/500273. [DOI] [PMC free article] [PubMed] [Google Scholar]
- Lei WL, Xing SG, Deng CY, Ju XC, Jiang XY, Luo ZG. Laminin/beta1 integrin signal triggers axon formation by promoting microtubule assembly and stabilization. Cell research. 2012;22:954–972. doi: 10.1038/cr.2012.40. [DOI] [PMC free article] [PubMed] [Google Scholar]
- Mallamaci A, Iannone R, Briata P, Pintonello L, Mercurio S, Boncinelli E, Corte G. EMX2 protein in the developing mouse brain and olfactory area. Mech Dev. 1998;77:165–172. doi: 10.1016/s0925-4773(98)00141-5. [DOI] [PubMed] [Google Scholar]
- McKenna WL, Betancourt J, Larkin KA, Abrams B, Guo C, Rubenstein JL, Chen B. Tbr1 and Fezf2 regulate alternate corticofugal neuronal identities during neocortical development. J Neurosci. 2011;31:549–564. doi: 10.1523/JNEUROSCI.4131-10.2011. [DOI] [PMC free article] [PubMed] [Google Scholar]
- Miller AM, Treloar HB, Greer CA. Composition of the migratory mass during development of the olfactory nerve. J Comp Neurol. 2010;518:4825–4841. doi: 10.1002/cne.22497. [DOI] [PMC free article] [PubMed] [Google Scholar]
- Mizuguchi R, Naritsuka H, Mori K, Yoshihara Y. Tbr2 deficiency in mitral and tufted cells disrupts excitatory-inhibitory balance of neural circuitry in the mouse olfactory bulb. J Neurosci. 2012;32:8831–8844. doi: 10.1523/JNEUROSCI.5746-11.2012. [DOI] [PMC free article] [PubMed] [Google Scholar]
- Molyneaux BJ, Arlotta P, Hirata T, Hibi M, Macklis JD. Fezl is required for the birth and specification of corticospinal motor neurons. Neuron. 2005;47:817–831. doi: 10.1016/j.neuron.2005.08.030. [DOI] [PubMed] [Google Scholar]
- Molyneaux BJ, Arlotta P, Menezes JR, Macklis JD. Neuronal subtype specification in the cerebral cortex. Nat Rev Neurosci. 2007;8:427–437. doi: 10.1038/nrn2151. [DOI] [PubMed] [Google Scholar]
- Molyneaux BJ, Goff LA, Brettler AC, Chen HH, Brown JR, Hrvatin S, Rinn JL, Arlotta P. DeCoN: genome-wide analysis of in vivo transcriptional dynamics during pyramidal neuron fate selection in neocortex. Neuron. 2015;85:275–288. doi: 10.1016/j.neuron.2014.12.024. [DOI] [PMC free article] [PubMed] [Google Scholar]
- Mori K, Sakano H. How is the olfactory map formed and interpreted in the mammalian brain? Annu Rev Neurosci. 2011;34:467–499. doi: 10.1146/annurev-neuro-112210-112917. [DOI] [PubMed] [Google Scholar]
- Nagai Y, Sano H, Yokoi M. Transgenic expression of Cre recombinase in mitral/tufted cells of the olfactory bulb. Genesis. 2005;43:12–16. doi: 10.1002/gene.20146. [DOI] [PubMed] [Google Scholar]
- Nagayama S, Homma R, Imamura F. Neuronal organization of olfactory bulb circuits. Front Neural Circuits. 2014;8:98. doi: 10.3389/fncir.2014.00098. [DOI] [PMC free article] [PubMed] [Google Scholar]
- Nakajima D, Nakayama M, Kikuno R, Hirosawa M, Nagase T, Ohara O. Identification of three novel non-classical cadherin genes through comprehensive analysis of large cDNAs. Brain Res Mol Brain Res. 2001;94:85–95. doi: 10.1016/s0169-328x(01)00218-2. [DOI] [PubMed] [Google Scholar]
- Okaty BW, Sugino K, Nelson SB. Cell type-specific transcriptomics in the brain. J Neurosci. 2011;31:6939–6943. doi: 10.1523/JNEUROSCI.0626-11.2011. [DOI] [PMC free article] [PubMed] [Google Scholar]
- Pinto G, Abadie V, Mesnage R, Blustajn J, Cabrol S, Amiel J, Hertz-Pannier L, Bertrand AM, Lyonnet S, Rappaport R, Netchine I. CHARGE syndrome includes hypogonadotropic hypogonadism and abnormal olfactory bulb development. J Clin Endocrinol Metab. 2005;90:5621–5626. doi: 10.1210/jc.2004-2474. [DOI] [PubMed] [Google Scholar]
- Robinson MD, McCarthy DJ, Smyth GK. edgeR: a Bioconductor package for differential expression analysis of digital gene expression data. Bioinformatics. 2010;26:139–140. doi: 10.1093/bioinformatics/btp616. [DOI] [PMC free article] [PubMed] [Google Scholar]
- Shaker T, Dennis D, Kurrasch DM, Schuurmans C. Neurog1 and Neurog2 coordinately regulate development of the olfactory system. Neural Dev. 2012;7:28. doi: 10.1186/1749-8104-7-28. [DOI] [PMC free article] [PubMed] [Google Scholar]
- Shibata M, Gulden FO, Sestan N. From trans to cis: transcriptional regulatory networks in neocortical development. Trends in genetics : TIG. 2015;31:77–87. doi: 10.1016/j.tig.2014.12.004. [DOI] [PMC free article] [PubMed] [Google Scholar]
- Sun J, Nishiyama T, Shimizu K, Kadota K. TCC: an R package for comparing tag count data with robust normalization strategies. BMC bioinformatics. 2013;14:219. doi: 10.1186/1471-2105-14-219. [DOI] [PMC free article] [PubMed] [Google Scholar]
- Trapnell C, Pachter L, Salzberg SL. TopHat: discovering splice junctions with RNA-Seq. Bioinformatics. 2009;25:1105–1111. doi: 10.1093/bioinformatics/btp120. [DOI] [PMC free article] [PubMed] [Google Scholar]
- Trapnell C, Williams BA, Pertea G, Mortazavi A, Kwan G, van Baren MJ, Salzberg SL, Wold BJ, Pachter L. Transcript assembly and quantification by RNA-Seq reveals unannotated transcripts and isoform switching during cell differentiation. Nature biotechnology. 2010;28:511–515. doi: 10.1038/nbt.1621. [DOI] [PMC free article] [PubMed] [Google Scholar]
- Treloar HB, Purcell AL, Greer CA. Glomerular formation in the developing rat olfactory bulb. J Comp Neurol. 1999;413:289–304. [PubMed] [Google Scholar]
- van de Leemput J, Boles NC, Kiehl TR, Corneo B, Lederman P, Menon V, Lee C, Martinez RA, Levi BP, Thompson CL, Yao S, Kaykas A, Temple S, Fasano CA. CORTECON: a temporal transcriptome analysis of in vitro human cerebral cortex development from human embryonic stem cells. Neuron. 2014;83:51–68. doi: 10.1016/j.neuron.2014.05.013. [DOI] [PubMed] [Google Scholar]
- Waclaw RR, Allen ZJ, 2nd, Bell SM, Erdelyi F, Szabo G, Potter SS, Campbell K. The zinc finger transcription factor Sp8 regulates the generation and diversity of olfactory bulb interneurons. Neuron. 2006;49:503–516. doi: 10.1016/j.neuron.2006.01.018. [DOI] [PubMed] [Google Scholar]
- Walz A, Omura M, Mombaerts P. Development and topography of the lateral olfactory tract in the mouse: imaging by genetically encoded and injected fluorescent markers. J Neurobiol. 2006;66:835–846. doi: 10.1002/neu.20266. [DOI] [PubMed] [Google Scholar]
- Wickham H. ggplot 2. Springer-Verlag; New York: 2009. [Google Scholar]
- Wolfer DP, Giger RJ, Stagliar M, Sonderegger P, Lipp HP. Expression of the axon growth-related neural adhesion molecule TAG-1/axonin-1 in the adult mouse brain. Anat Embryol (Berl) 1998;197:177–185. doi: 10.1007/s004290050129. [DOI] [PubMed] [Google Scholar]
- Yoshihara S, Omichi K, Yanazawa M, Kitamura K, Yoshihara Y. Arx homeobox gene is essential for development of mouse olfactory system. Development. 2005;132:751–762. doi: 10.1242/dev.01619. [DOI] [PubMed] [Google Scholar]
Associated Data
This section collects any data citations, data availability statements, or supplementary materials included in this article.