. 2016 Sep 13;5:e18605. doi: 10.7554/eLife.18605

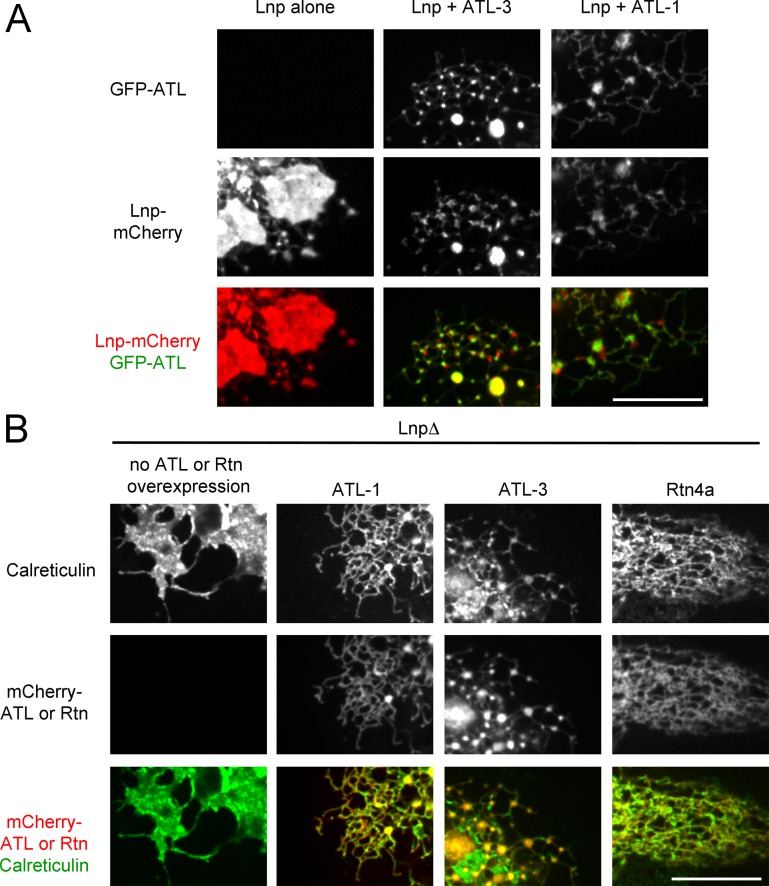
Figure 10. Interplay of ATL, Lnp, and Rtn.

(A) Peripheral ER in U2OS cells stably expressing Lnp-mCherry alone or together with GFP-ATL-3 or GFP-ATL-1. Scale bar = 10 micron. (B) Peripheral ER in Lnp-lacking U2OS cells expressing GFP-calreticulin. Where indicated, the cells also stably expressed mCherry-tagged ATLs or Rtn4a. Scale bar = 10 micron.

DOI: http://dx.doi.org/10.7554/eLife.18605.025

Figure 10.

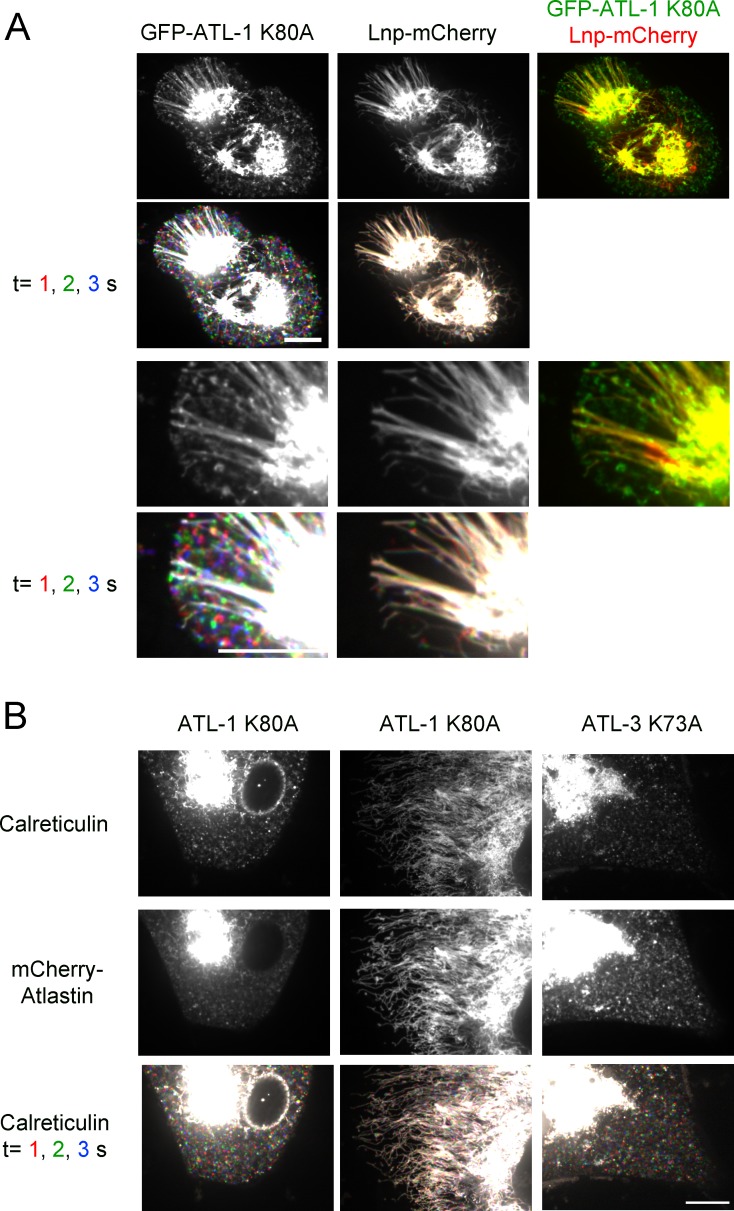
Figure 10—figure supplement 1. ATL acts upstream of Lnp in U2OS cells.

Figure 10—figure supplement 1.

(A) Peripheral ER in U2OS cells stably expressing Lnp-mCherry and GFP-ATL-1 K80A (GTPase defective mutant). The second and fourth rows show three time points. Stationary pixels appear white, while those moving appear in colors. The top five panels depict two entire cells, while the bottom five panels show magnifications of the peripheral ER of these cells. Scale bars = 10 µm. (B) Peripheral ER in Lnp-lacking U2OS cells expressing GFP-calreticulin. The cells also stably express mCherry-tagged ATL mutants defective in GTPase activity. The bottom row shows three time points. Scale bar = 10 µm.