. 2016 Sep 13;5:e18605. doi: 10.7554/eLife.18605

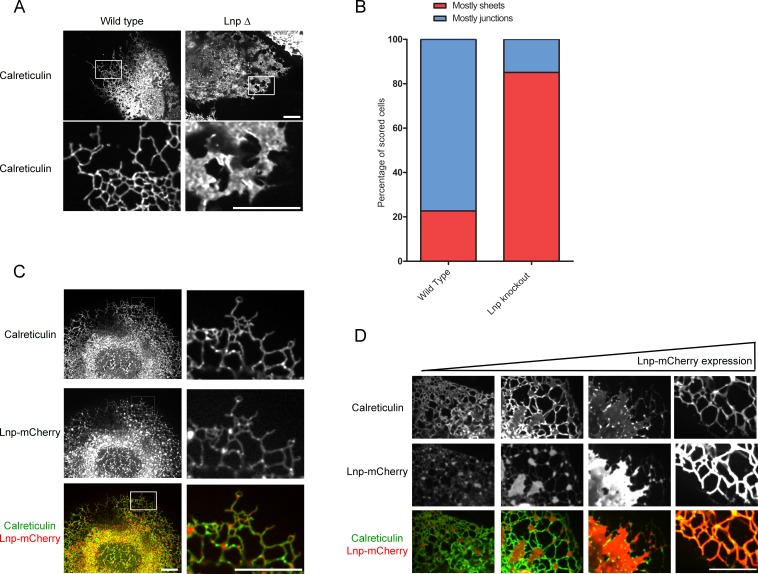
Figure 8. Lnp determines the abundance of three-way tubular junctions in mammalian cells.

(A) Views of wild type U2OS and Lnp-deleted (LnpΔ) cells expressing GFP-calreticulin from the endogenous promoter. LnpΔ cells were generated by CRISPR targeting the start codon of the LNP gene. The bottom row shows magnifications of the boxed areas of the peripheral ER. Scale bars = 10 µm. (B) Quantification of the LNP deletion phenotype depicted in A. Wild type and LnpΔ cells were scored blindly for the appearance of peripheral ER. (C) Peripheral ER in a LnpΔ cell expressing GFP-calreticulin, as well as stably expressing a low level of Lnp-mCherry. Scale bars = 10 µm. (D) As in (C), but with cells expressing increasing levels of Lnp-mCherry (left to right). Scale bars = 10 µm.

DOI: http://dx.doi.org/10.7554/eLife.18605.021

Figure 8.

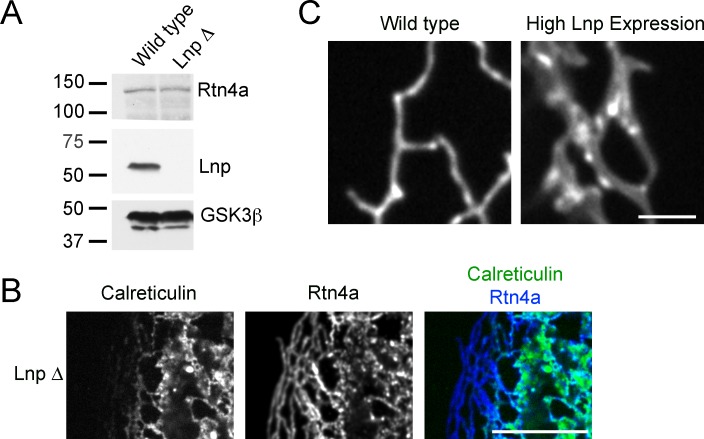
Figure 8—figure supplement 1. ER morphology in U2OS cells lacking or overexpressing Lnp.

Figure 8—figure supplement 1.

(A) Extracts of wild type U2OS cells and a Lnp-deleted U2OS clonal cell line were analyzed by immunoblotting with Lnp and Rtn4 antibodies. Equal amounts of total protein were loaded, and GSK3β was used as a loading control. (B) Peripheral ER in a U2OS cell lacking Lnp expressing GFP-calreticulin from the endogenous promoter. The cells were fixed and analyzed for GFP fluorescence and for endogenous Rtn4a, using specific antibodies and fluorescently labeled secondary antibodies. Scale bar = 10 µm. (C) Peripheral ER in wild type U2OS cells and cells highly expressing Lnp-mCherry. The ER is visualized by GFP-calreticulin expressed under the endogenous promoter. Scale bar = 2 µm.