Abstract
Efficient digestion and absorption of nutrients by the intestine requires a very large apical surface area, a feature that is enhanced by the presence of villi, fingerlike epithelial projections that extend into the lumen. Prior to villus formation, the epithelium is a thick pseudostratified layer. In mice, villus formation begins at embryonic day (E)14.5, when clusters of mesenchymal cells form just beneath the thick epithelium. At this time, analysis of the flat lumenal surface reveals a regular pattern of short apical membrane invaginations that form in regions of the epithelium that lie in between the mesenchymal clusters. Apical invaginations begin in the proximal intestine and spread distally, deepening with time. Interestingly, mitotically rounded cells are frequently associated with these invaginations. These mitotic cells are located at the tips of the invaginating membrane (internalized within the epithelium), rather than adjacent to the apical surface. Further investigation of epithelial changes during membrane invagination reveals that epithelial cells located between mesenchymal clusters experience a circumferential compression, as epithelial cells above each cluster shorten and widen. Using a computational model, we examined whether such forces are sufficient to cause apical invaginations. Simulations and in vivo data reveal that proper apical membrane invagination involves intraepithelial compressive forces, mitotic cell rounding in the compressed regions and apico-basal contraction of the dividing cell. Together, these data establish a new model that explains how signaling events intersect with tissue forces to pattern apical membrane invaginations that define the villus boundaries.
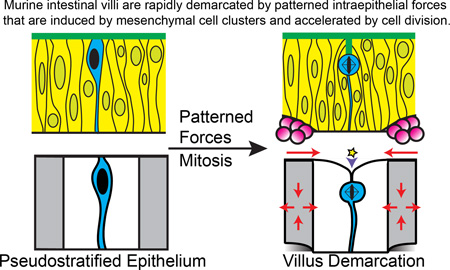
Graphical Abstract
Introduction
The intestine requires an enormous surface area for effective nutrient absorption. Multiple morphological adaptations contribute to this large absorptive surface, including the remarkable length of the intestine (2–4 meters in humans),1 convolution of its mucosa into fingerlike projections known as villi,2–4 and the presence of thousands of microvilli on the apical surface of each epithelial cell.5 Factors that severely reduce intestinal absorptive surface, whether due to congenital (e.g., short bowel syndrome, microvillus atrophy) or traumatic (e.g., necrotizing enterocolitis, volvulus) etiologies can result in intestinal failure, a life-threatening condition for which there are few treatment options.6–8
The presence of villi has been estimated to provide a 6.5-fold amplification of intestinal surface area in humans.1 Interestingly, the number of villi appears to be largely established by the time of birth; in rodent models of intestinal resection, adaptation consists largely of growth in villus length and girth with little increase in villus number.9–11 Thus, the active generation of villi that occurs in fetal life provides the best opportunity for investigation of the morphogenic and molecular pathways required for villus formation.
In mice, the first intestinal villi emerge at embryonic day (E)14.5. At this time, the epithelium is over 50 µm thick with nuclei located at staggered positions, a feature that led early investigators to conclude that the epithelium is stratified.2,4,12 Furthermore, it was thought that villus domains are established via changes in epithelial cell polarity that result in the formation of de novo secondary lumens between cell layers and subsequent fusion of these isolated lumens with the primary lumen.2 These long-held notions of villus morphogenesis have recently been dispelled; new evidence from 3D imaging studies reveals a single-layered pseudostratified epithelium with no evidence for disconnected secondary lumens.13
It is well established that villus formation involves signaling cross-talk between the intestinal epithelium and the underlying mesenchyme.13–16 One of the key signals for initiating villus formation is Hedgehog (Hh). Hh ligands secreted from the epithelium stimulate nearby mesenchymal cells to form clusters beneath and closely associated with the epithelium.15–17 These clusters form in a patterned array, beginning in the duodenum and spreading distally, towards the colon; their pattern appears to be controlled by a self-organizing Turing field that depends on Bmp signaling.17 Importantly, while Bmp signals organize the distribution of mesenchymal clusters, patterning of the villus boundaries in the overlying epithelium is independent of Bmp signal transduction by epithelial cells.17 Therefore, additional components are required to explain how villus domains are defined in the epithelium.
It is also important to consider the speed of villus demarcation. In the mouse, it takes approximately 36 hours (from E14.5 to E16.0) for the initial wave of clusters to propagate from pylorus to cecum.16 Because the intestine is 30 mm long at E15.5, this morphogenic wave must move at a speed of over 800 µm per hour, nearly 15 µm per minute.
To begin to address the mechanisms by which the thick pseudostratified epithelium could be rapidly parsed into separate villus domains, we examined the earliest apical surface deformations in the intestinal epithelium and detected a patterned array of short apical membrane invaginations, or folds, that initiate proximally and spread distally, deepening with time. These folds, which represent the first signs of villus morphogenesis, form predominantly in regions of the epithelium that are not in direct contact with the pre-existing mesenchymal clusters.
Further investigation of these initial apical deformations reveals that they are frequently associated with the presence of rounded mitotic cells, suggesting a relationship between cell division and villus morphogenesis. Cell divisions play an important role in apical expansion in at least two other in vivo systems: the developing zebrafish neural keel, where apical polarization during cell division establishes the central lumen18,19 and formation of the Drosophila tracheal placode, where mitotic cell rounding facilitates rapid invagination of epithelial regions that are under passive circumferential compression.20,21 We therefore tested whether either of these two models could explain the invaginations associated with villus morphogenesis in the developing intestinal epithelium.
We show here that the process of villus morphogenesis closely resembles tracheal placode invagination from morphological, temporal, and mechanical perspectives. We identify epithelial cell shape changes adjacent to mesenchymal clusters that can exert patterned intraepithelial pressure to initiate apical invaginations. We further demonstrate a robust association between apical invaginations and mitotic cells; these cells undergo “internalized cell rounding”, a process by which mitosis-associated cell rounding is accompanied by rapid depression of the apical surface.21,22 These in vivo observations were used to develop a computational model that allowed further exploration of the mechanical forces required for apical invagination.
Together, our data suggest a new model for villus morphogenesis, in which signaling events, initiated by a regular array of mesenchymal clusters, produce a pattern of intraepithelial mechanical forces that, when triggered by mitotic cells, promote rapid apical invaginations. This model establishes a mechanism by which a mesenchymal pattern can be rapidly transferred to the epithelium to establish villus boundaries.
Materials and Methods
Mice
All protocols for mouse experiments were approved by the University of Michigan Unit for Laboratory Animal Medicine. Animals were maintained in accordance with the guidelines of the University of Michigan, Ann Arbor, Michigan, and all applicable federal, state, local, and institutional laws, regulations, policies, principles, and standards (including accreditation) governing animal research. All protocols for mouse experiments were approved by the University of Michigan Unit for Laboratory Animal Medicine. C57BL/6 mice were obtained from Charles River (strain 027).
Intestinal Explant Culture
Intestines were harvested between E13.5 and E14.5 and dissected in cold DPBS (Sigma D8537). Culturing was performed utilizing transwells (Costar 3428) as a scaffold. BGJb media (Invitrogen 12591-038) containing 1% penicillin-streptomycin (vol/vol) (Invitrogen 15140-122) and 0.1 mg/mL ascorbic acid was placed into contact with the transwell membrane. Intestines were cultured for up to 24 hours at 37°C with 5% CO2.
Antibodies, Plasmids, and Reagents
Antibodies used were rabbit anti-aPKC 1:250 (Santa Cruz sc-216), mouse anti-α-tubulin 1:1000 (Sigma T6199), mouse anti-β-catenin 1:500 (Sigma C-7207), rabbit anti-cleaved caspase 3 1:150 (Cell Signaling 9664), rabbit anti-Crumbs3 1:250 (gift of Dr. Ben Margolis), mouse anti-E-cadherin 1:1000 (Invitrogen 13-1900), mouse anti-Ezrin 1:1500 (Sigma E8897), rabbit anti-Ki67 1:500 (Novocastra NCL-Ki67p), rabbit anti-pMLCK 1:200 (Cell Signaling 3674), rabbit anti-PDGFRα 1:200 (Santa Cruz sc-338), mouse anti-pHH3 1:1000 (Millipore 05-806), rabbit anti-pHH3 1:1000 (Millipore 06-570). Secondary antibodies used were Alexa Fluor 488/555/647-conjugated anti-mouse and anti-rabbit and Alexa Fluor 568 Phalloidin (Life Technologies A34055).
Tissue Immunofluorescence
After fixing overnight in 4% paraformaldehyde in PBS at 4°C, intestines were washed in PBS, embedded in paraffin, and sectioned at 5 µm. Samples were deparaffinized and 10 mM sodium citrate used for antigen retrieval. Primary antibody incubation was performed overnight at 4°C, followed by secondary antibody for 30 minutes at room temperature. Samples were imaged on a Nikon E800 (20× objective) and a Nikon A1 Confocal (20× objective, water; 60× objective, oil). Adobe Photoshop was used for image processing.
Vibratome Sectioning and Immunofluorescence
After fixation, intestines were embedded in 7% (wt/vol) low-melting agarose (Sigma A9414) in PBS and sectioned at 100 µm. Primary antibody incubation was performed overnight at 4°C, followed by secondary antibody incubation for two hours at room temperature. Samples were mounted in Prolong Gold (Life Technologies P36930) and imaged on a Nikon A1 Confocal (20× objective, water). Image processing was done using Imaris 8.0.
Scanning Electron Microscopy
After harvest, intestines were fixed at 4°C in 2.5% gluteraldehyde overnight and washed in Sorenson’s phosphate buffer (0.1 M, pH 7.4). Overnight treatment with hexamethyldisilazane was followed by mounting and sputter coating with gold. An Amray 1910 FE Scanning Electron Microscope was used to examine samples, with images taken using Semicaps 2000 software. Image processing was done using Adobe Photoshop.
Computational Model
Modeling was done using the finite element method (FEM), which is a mesh based discretization technique for solving partial differential equations.23 The computational results in this paper were generated using the FEM package Abaqus (version 6.14.1), which was used to solve the equations governing the mechanical deformation of the epithelium. The pre-villus epithelium was modeled as a 2D geometry (Supplementary Figure 3) and we assumed a hyper-elastic Holzapfel-Gasser-Ogden material model with spatially varying material properties (Supplementary Table 1).
Statistical Analysis
All graphs were made and statistical analyses performed using Prism 6. Statistical tests were used as indicated in the figure legends.
Results
Apical expansion during villus morphogenesis
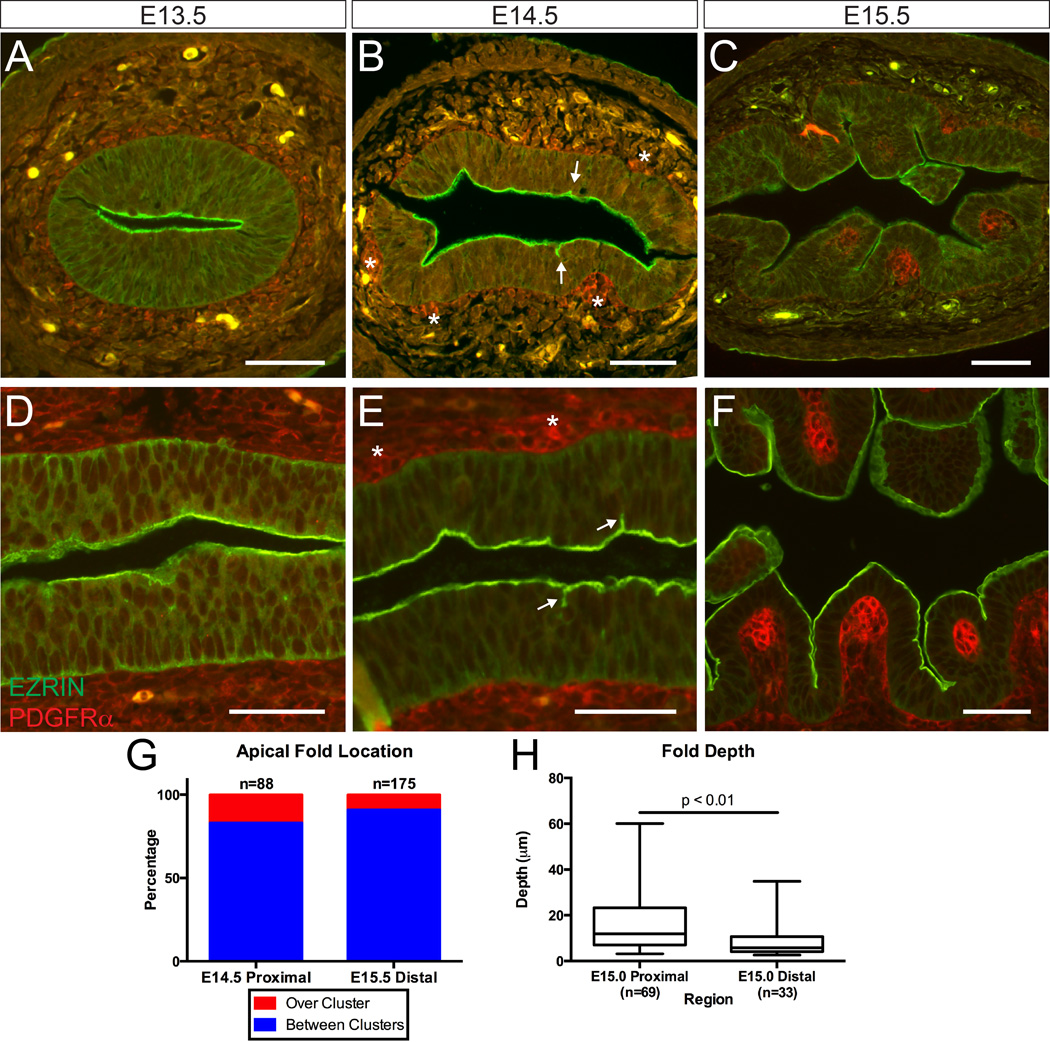
We previously documented that villus morphogenesis involves expansion of the main lumen rather than formation and fusion of disconnected secondary lumens.13 To further explore the initial changes in the apical surface that accompany this expansion, we examined this process in E13.5 to E15.5 intestines utilizing antibodies to EZRIN, an apical surface protein,24 and PDGFRα, a marker of the mesenchymal clusters involved in villus patterning.16 Both cross sections (Figure 1A–C) and longitudinal sections (Figure 1D–F) of tissue were examined.
Figure 1. Temporal analysis of the intestinal apical surface during villus initiation.
(A–C) Cross-sections and (D–F) longitudinal sections of the murine small intestine at (A, D) E13.5, (B, E) E14.5, and (C, F) E15.5 stained with EZRIN (green) and PDGFRα (red). Initial deformations appear at E14.5 (B and E, arrows). Mesenchymal clusters are marked with asterisks. Folds deepen to clearly demarcate villi by E15.5. Scale bar = 50 µm. (G) Quantification of fold location relative to mesenchymal clusters at the morphogenic front of villus development at E14.5 and E15.5. (H) Box and whisker plots comparing fold depth in the E15.0 proximal and distal intestines showing the maximum, minimum, and median of the data sets (p = 0.0026, unpaired t-test).
At E13.5, the epithelium is uniformly pseudostratified and the apical surface is flat; mesenchymal clusters are not detectable (Figure 1A and D). At E14.5, mesenchymal clusters are visible in the proximal, but not distal intestine. Clusters are tightly associated with the overlying epithelium, sitting in small alcoves and slightly deforming the basal surface of the pseudostratified epithelium (Figure 1B and E, asterisks). The apical surface, however, remains flat, with occasional short extensions of EZRIN staining oriented perpendicularly to the lumenal surface in the proximal intestine (Figure 1B and E, arrows). By E15.5, these apical extensions are deeper and a field of regularly patterned villi cover the proximal intestine, such that each villus is closely associated with a mesenchymal cluster (Figure 1C and F). All of these events first occur in the proximal intestine and, after about one day, are present distally, consistent with previous findings that villus formation occurs in a proximal to distal wave.2,16
Spatiotemporal characterization of apical lumen expansion
The spatial patterning of EZRIN positive apical extensions was then examined. These experiments were performed using an intestinal explant culture; in such explants, the rate of villus morphogenesis slows, allowing greater resolution of the morphogenic process.16 The location of apical extensions relative to mesenchymal clusters was quantified. In the proximal E14.5 and distal E15.5 intestine, where the morphogenic front of villus emergence is located, over 80% of the apical deformations are found in epithelial regions that lie between, rather than over clusters (Figure 1G).
A spatiotemporal correlation was also apparent between the depth of apical extensions and their location along the proximal-distal axis: at E15.0, midway through the morphogenic process, these indentations are deeper in the proximal compared with distal regions of the same intestine (Figure 1H). This mirrors the established pattern of cluster formation, as clusters first form in the proximal duodenum and spread in a wave-like fashion down the intestine over a 36 hour period (E14.5 to E16.0).16 Because clusters are known to mark the core of villus domains,16 these short apical extensions appear to represent the initial boundaries between villi.
Three-dimensional visualization of apical surface changes
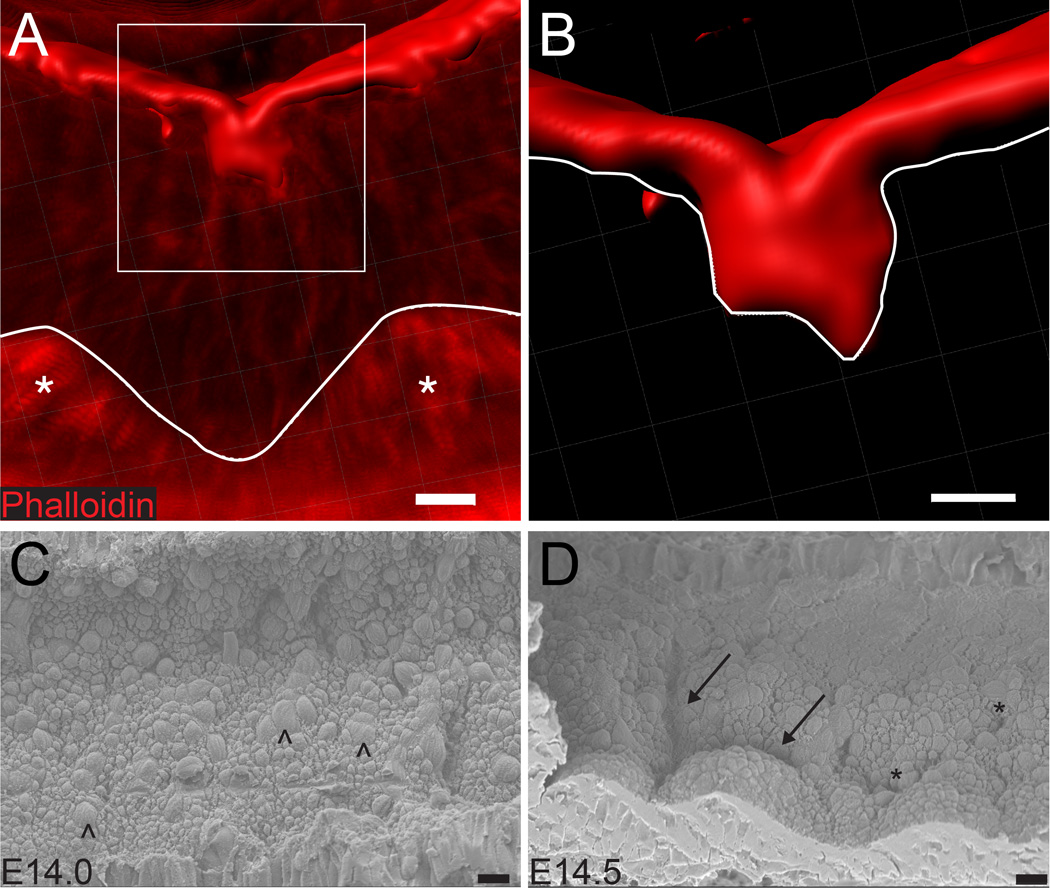
To better understand the three-dimensional structure and pattern of apical surface extensions during initial villus demarcation, two approaches were taken. First, thick (100 µm) vibratome sections were stained with phalloidin to mark the apical F-actin network. Confocal Z stacks were generated and reconstructed in three dimensions to determine the shape of individual extensions (Figure 2A–B). These studies establish that the smallest extensions consist of closely opposed double-membrane folds or invaginations, with little lumenal space between membranes. Importantly, as these folds deepen, they remain continuous with the apical surface. Previous work has established that the apical surface remains continuous throughout villus development.13
Figure 2. Three-dimensional analysis of apical invaginations.
(A) Reconstruction of the apical surface (phalloidin, red) indicating an early fold located between two clusters (asterisks). Images were obtained by confocal scanning of a 100 µm thick vibratome section of the E14.5 intestine, and the 3D view was reconstructed using Imaris. The basement membrane is traced with a white line. (B) Inset of box in (A), the underside of the apical surface is traced with a white line. The fold represents an invagination of the apical surface; two membrane faces are visible. Scale bar = 10 µm. (C, D) Scanning electron micrographs of the apical surface at E14.0 and E14.5. In both images, proximal is on the left and distal is on the right. (C) At E14.0, although cell boundaries are visible, the overall surface is flat. Occasional larger cell profiles represent mitotic cells (arrowheads). (D) At E14.5, deeper folds (arrows) clearly outline nascent villi. Nearby, shallower, disconnected invaginations (asterisks) are visible. Because the rate of cluster spread is 30 mm over 36 hours, or 15 µm per minute,16 the morphogenic wave can travel this 150 µm field in approximately 10 minutes. Scale bar = 10 µm.
To further appreciate the patterning of these invaginations, intestines from embryos ranging from E14.0 to E14.5 were longitudinally opened and scanning electron microscopy (SEM) was used to image the apical surface. In E14.0 intestines, the surface is flat, though cellular outlines are visible (Figure 2C). Beginning in the duodenum at E14.5, a dramatic transition can be observed along the proximal to distal axis; domes surrounded by deep creases are located more proximally to areas of disconnected invaginations (Figure 2D). The field seen in this image, which appears to represent the transitional front of the morphogenic wave, measures slightly more than 150 µm. Assuming that this wave moves at a constant speed between E14.5 and E15.5, we calculate that the entire morphological transition (from right to left) that is pictured in Figure 2D should take place in about 10 minutes.
Apical surfaces are not extended by apoptosis
The data above indicate that apical invaginations appear beginning at E14.5 in a spatiotemporally controlled pattern in the developing intestine and that these invaginations are likely nascent villus demarcations. We next sought a mechanism to explain the appearance of these invaginations. During morphogenesis of the Drosophila leg, apoptosis facilitates epithelial folding by coupling cell death to the transmission of physical forces.25 Additionally, in the early neural ectoderm, apoptosis generates force to assist tissue bending before neural tube closure.26,27 To determine whether localized apoptosis might cause apical folding during villus morphogenesis, we examined the pattern of cleaved Caspase 3 staining in E14.5 intestines. This analysis revealed that the frequency of apoptosis is very low both before and during villus morphogenesis (Supplementary Figure 1). The rare apoptotic figures scattered throughout the epithelium do not appear to correspond with apical surface extensions or mesenchymal clusters. Therefore, the establishment of villus domains is not determined by localized patterns of apoptosis.
Apical folds are associated with dividing cells
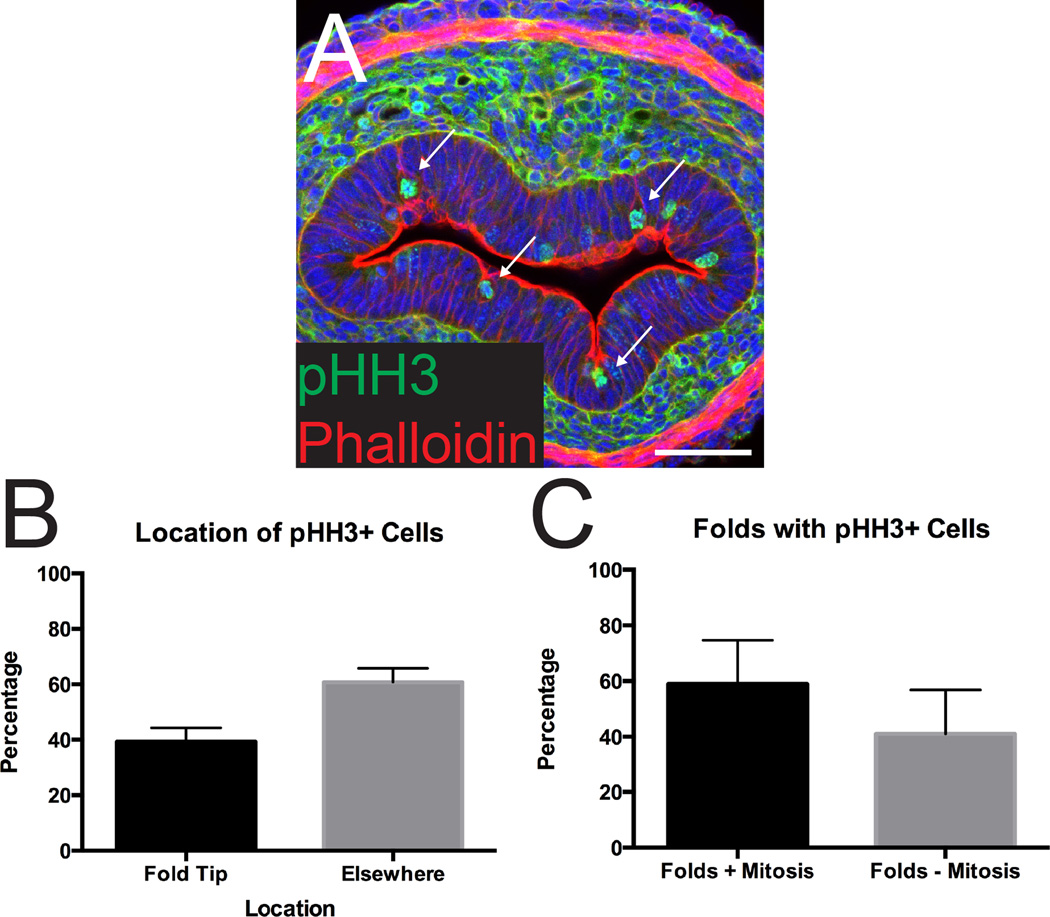
Another event that has been associated with the generation of new apical surfaces is mitosis.18,19,21,22,28–30 We therefore examined the distribution of dividing epithelial cells during the process of apical expansion. Interestingly, 40% of pHH3+ mitotic figures were found at the tips of invaginations (Figure 3A–B). This association is remarkable considering that the tips of these folds constitute a small proportion of the total apical surface (Figure 3A). Moreover, approximately 60% of folds have an associated cell division (Figure 3C).
Figure 3. Apical folds are associated with dividing cells.
(A) Cross-section of the intestine stained with pHH3 (green) and phalloidin (red). Many apical folds are associated with mitotic cells (arrows). Note that phalloidin also stains the outer smooth muscle layer and there is some background from antibody trapping in the mesenchymal connective tissue. Scale bar = 50 µm. (B) Quantification of the location of dividing (pHH3+) cells in the epithelium at E14.5. Forty percent of invaginations are associated with a dividing cell. (C) Quantification of the number of folds associated with a dividing cell. Sixty percent of folds are associated with a cell division event. Error bars represent standard deviation.
Because these data suggest a potential mechanistic link between mitotic cells and membrane invaginations, we examined two mechanisms by which mitotic cells promote apical expansion in other systems. First, a new lumenal surface can form de novo between daughter cells during cell division; this happens in the zebrafish neural keel,18,19 in the formation of bile canaliculi in vitro and in vivo,28 and in isolated epithelial cells plated in a thick 3D matrix.29,30 Alternatively, cell division can accelerate the process of apical invagination, as in the Drosophila tracheal placode.21
Dividing cells at folds are not enriched for apical components
In lumen-forming cell divisions, intracellular collections of apical components such as CRB3 and Pard3 are observed at the two poles of the dividing cells. During cytokinesis, these components traffic along the mitotic spindle to initiate lumen formation between daughter pronuclei.18,19,29 To examine CRB3 distribution during cell division in the intestinal epithelium, we studied its localization in sections co-stained with α-TUBULIN (Supplementary Figure 2). No intracellular staining was found in the 30 divisions examined. Though not definitive, these data suggest that the mitotic cells at apical invaginations are not likely to be generating apical surfaces de novo. Thus, we explored whether mitosis-associated invagination could provide an explanation for lumenal expansion, as in the Drosophila tracheal placode.
Apical intestinal invagination resembles Drosophila tracheal placode invagination
Prior to invagination in the Drosophila tracheal placode, intercalating cells around the presumptive placode expand the surrounding epithelium, placing a passive intraepithelial compressive force on placode cells. As described by Kondo and Hayashi, as a cell within this compressed region begins mitosis, the circumferential pressure causes its apical contact to shrink and the rounded cell moves away from the apical surface while retaining a T-shaped apical extension (Supplementary Figure 8 in Kondo and Hayashi21). This is referred to as “internalized cell rounding” and is distinct from surface cell rounding that typically characterizes mitosis in a pseudostratified epithelium. Overall, these events cause a rapid inward folding of the apical surface. The defining morphological and physical characteristics of this model include the presence of internalized mitotic cell rounding and a source of patterned intraepithelial pressure.20,21
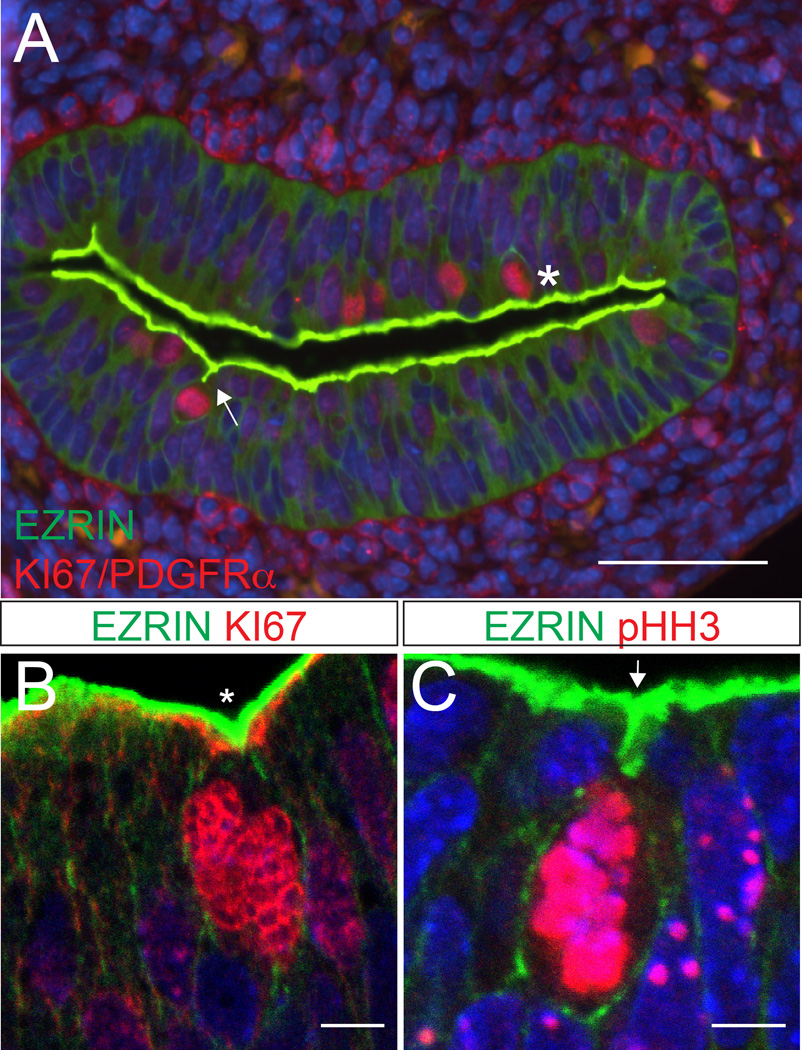
Examination of rounded mitotic cells in the intestinal epithelium at E14.5 and E15.5 revealed two distinct morphologies. Mitotic cells that are not associated with apical invaginations round up directly adjacent to the main lumenal surface, as expected in a pseudostratified epithelium (Figure 4A, asterisk). Some of these cells are associated with a small V-shaped indentation of the apical surface (Figure 4B), although internalized cell rounding is not observed. In contrast, rounded mitotic cells associated with initial apical invaginations are positioned well below the apical surface and are connected to the main lumen by a short T-shaped apical fold that stains with apical markers such as EZRIN. The rounded cell retains a very small EZRIN-positive apical surface at the tip of the invagination (Figure 4A, C). These cells are morphologically indistinguishable from those previously noted in the Drosophila tracheal placode. Such internally rounded cells cannot be detected prior to cluster formation at E14.5.
Figure 4. Two types of cell division in the intestinal epithelium.
(A) Cross-section of the intestine at E14.5. A subset of dividing cells (KI67, red) are associated with a T-shaped invagination of the apical surface (arrow). Other rounded mitotic cells are adjacent to a flat or V-shaped (asterisk) surface indentation. Apical surface is stained with antibodies to EZRIN (green). Clusters are also stained with antibodies to PDGFRα (red). Scale bar = 50 µm. (B, C) Confocal images of dividing cells (KI67 or pHH3, red) adjacent to a (B) V-shaped (asterisk) or (C) T-shaped (arrow) apical indentations (EZRIN, green). This T-shaped indentation is reminiscent of internalized cell rounding described in the Drosophila tracheal placode.21 Scale bar = 5 µm.
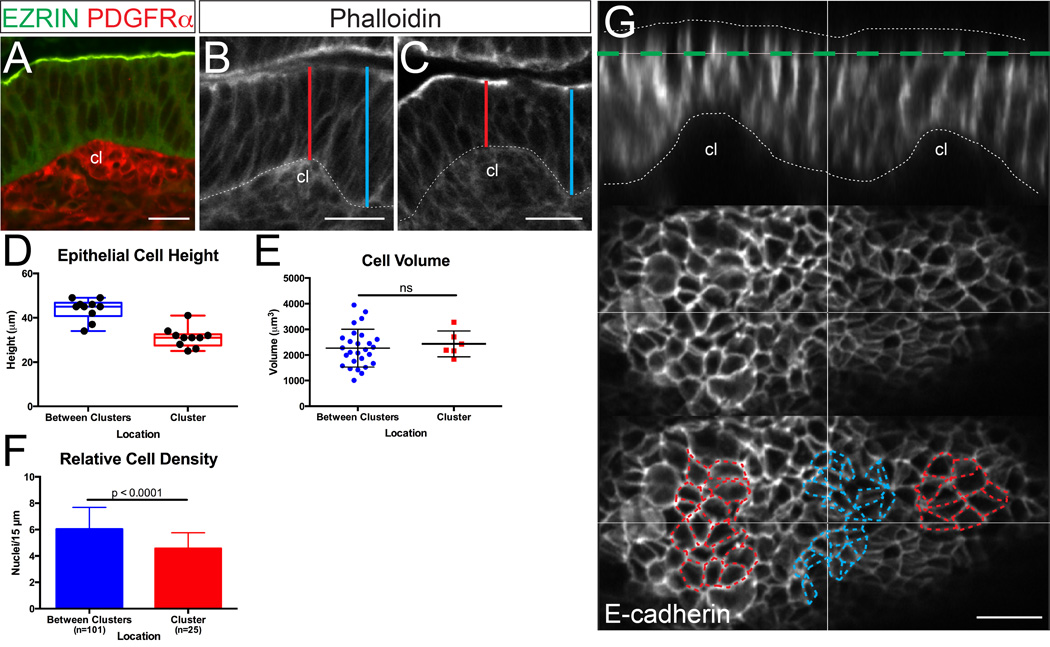
Tracheal placode invagination takes place in the context of passive compression of presumptive placode cells due to expansion of the surrounding epithelium.21 If a similar process occurs in the intestinal epithelium, a source of compressive pressure is required. Because initial intestinal invaginations are consistently located between clusters (Figure 1G), an attractive hypothesis is that a cluster-dependent pattern of intraepithelial compression is generated. As demonstrated above, analysis of the epithelium prior to apical invagination reveals that the basal surface of the epithelium is deformed into soft alcoves above the clusters, even while the apical surface remains flat (Figures 1E, 2C–D, 3A, 4A, 5A–C and 5G). As pointed out in a previous study17 all of these soft alcoves are associated with the presence of mesenchymal clusters, suggesting that the clusters form these deformations. Early investigators noted this deformation as well and suggested that clusters “push up” into the overlying epithelium.2 However, another plausible explanation for these basal deformations could be that clusters signal to overlying epithelial cells to cause them to change shape. Indeed, measurements show that epithelial cells overlying clusters are up to 30% shorter than those in the inter-cluster regions at a time when minimal to no deformation is detectable at the apical surface (Figure 5D). Though the “cluster push” hypothesis is not ruled out by these findings, such pushing would also require a motor force as well as a substrate for traction, neither of which has been documented. Together, the bulk of the data presented here and elsewhere16,17 support the hypothesis that signals from the clusters cause shape changes in overlying epithelial cells, causing those cells to shorten and widen. Since clusters are known to be tightly associated with the basement membrane16, they may, in fact, be pulled up by the epithelial shape-induced deformations.
Figure 5. Epithelial cells above mesenchymal clusters are shorter and wider.
(A) Example of the basal epithelial deformation that is created by a small mesenchymal cluster (cl, labeled with PDGFRα, red), at a time when the apical surface above the cluster (labeled with EZRIN, green) remains flat. (B,C) Sections are stained with phalloidin (white). Cluster-induced basal deformations are not seen in the absence of mesenchymal clusters17 and can be easily discerned in phalloidin-stained sections. Lines show the points of measurement of epithelial cell height over (red) and adjacent to (blue) basal deformations caused by clusters (cl). Some sections that were used for measurement were co-stained with the cluster marker, PDGFRα. Scale bar = 20 µm. (D) Box and whisker plots comparing epithelial cell height over mesenchymal clusters and between clusters, showing the maximum, minimum, and median of the data sets. (E) Comparison of cell volume over and between clusters (p > 0.05, unpaired t test). Error bars represent standard deviation. (F) Quantification of epithelial nuclei per unit apical surface (“Relative Cell Density”) above and between clusters (p < 0.0001, unpaired t test). Error bars represent standard deviation. (G) Cross-section through the epithelium (E-cadherin, white, and outlined) just after cluster formation. Bottom panels are projections of the plane highlighted in green. Note that cells over clusters (outlined in red) appear expanded circumferentially relative to cells between clusters (outlined in blue). Scale bar = 15 µm.
To accommodate this basal to apical shortening, cell volume must rapidly decrease, or cells must widen circumferentially. To examine these possibilities, Imaris image analysis software was first used to compare the volume of cells over clusters and between clusters. While individual volume is quite variable, these measurements reveal a similar range of volumes in both locations (Figure 5E), arguing against volume change as a compensation for this rapid change in cell height. Similarly, in other morphogenic systems characterized by rapid cell shape changes, cell volume is constant.31–33
Because of the non-linear elastic response of the cytoplasm,34 the vertical shortening of these cells would predict a lateral increase in cell width. To determine if this effect is observed in the intestinal epithelium, the number of epithelial cells (nuclei) per unit apical length was determined in regions overlying mesenchymal clusters and in regions between clusters. These measurements revealed a lower density of nuclei per unit of apical surface in regions over clusters, suggesting that cells in this region are indeed wider (Figure 5F). Additionally, we utilized confocal microscopy to image longitudinally opened, whole-mount E15.0 intestines; in this manner the apical surface could be directly examined at the front of the morphogenic wave of clusters. Confocal slices through this epithelium, stained with E-cadherin to mark cell outlines, reveal that epithelial cells directly over clusters are circumferentially expanded, relative to the intervening epithelial cells, which appear more compacted (Figure 5F). Thus, epithelial cell shape changes initiated by the presence of mesenchymal clusters appear to exert a patterned field of compressive forces on the intervening epithelium.
Computational model of the mechanics of apical invagination
To explore whether this pattern of forces could potentially explain the patterning and morphology of initial apical folds, a two-dimensional (plane strain) finite element model of the intestine was constructed, using the commercial software Abaqus 6.14.1. The epithelium contains two structural layers with differing mechanical properties: the thin apical layer contains the cross-linked actin-rich cytoskeleton network and the cell body layer represents the rest of the epithelium. In this model, these layers are represented by regions of different mechanical properties (Supplementary Table 1). The geometric dimensions of this model were estimated from previous experimental observations of the developing intestine. The thickness of the pre-villus epithelium has been established to be 50 µm13 with an apical terminal web of 1 µm.35 Mesenchymal clusters are approximately 30 µm wide and 70 µm apart.16 For this reason, 15 µm is defined as a half-cluster region for each flanking region of this segment. Because mitotic cells are associated with invaginations in vivo, some simulations also included a rectangular region of 10 µm by 18 µm with an apical contact width of 1 µm to represent a mitotic cell. The dimensions of this model are shown in Supplementary Figure 3.
The mechanical stiffness of each region of the model was selected based on previous studies. The modulus of the actin-rich apical layer was chosen to be 10 kPa based on the measurements of the Young’s modulus of actin stress fibers.36 The modulus of the cell body layer was chosen to be 0.5 kPa based on measurements of the Young’s modulus of cytoplasm.34 The epithelial cytoplasm was assumed to be nearly incompressible, with Poisson’s ratio of 0.495. During mitotic cell rounding, the apical actin web is disassembled, allowing the cell cortex to be stiffer than the surrounding epithelial cells, such that the dividing cell can displace neighbors to accommodate rounding.37 Therefore, the apical contact of the mitotic cell was modeled as a compliant spot with an 80% reduction in modulus compared with the rest of the apical surface.
Because the modeled region represents a repeating unit of the intestinal epithelium, symmetric boundary conditions were used for the left and right boundaries. To model the cluster-mediated cell shortening effects that cause basal deformations, as observed in the in vivo developing epithelium, the apical surface above the clusters was constrained vertically such that the clusters would deform only the basal surface of the epithelium. Because the inter-cluster epithelial cells do not shorten, the basal inter-cluster boundary was fixed. These idealized assumptions in the model reflect hypotheses that similar conditions possibly constrain the intestinal epithelium.
To mimic the changes in cell shape that occur above mesenchymal clusters, an inelastic growth strain was applied, as is common in mechanical models of growing tissues.38,39 Cell signaling leads to the shortening and widening of epithelial cells in the cluster region, which is represented by a growth strain that is positive in the lateral direction and negative in the vertical direction. To model the unchanged thickness of the apical surface during this process, only a positive lateral growth strain was applied to the apical surface above the clusters.
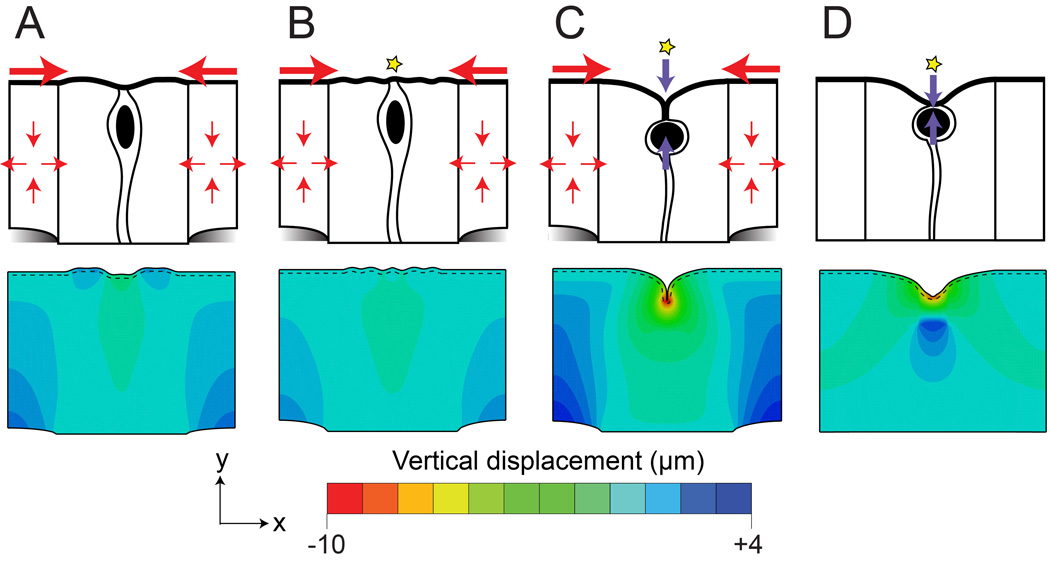
In initial simulations, we tested whether cluster-mediated expansion is sufficient to cause apical invaginations in the inter-cluster regions. As shown in Figure 6A (Supplemental Movie 1), when cluster-dependent strain was applied, the apical surface exhibited a wave-like pattern, but no pronounced invagination. Because our in vivo observations (Figure 3 and 4) as well as work in the Drosophila trachea21 suggest that mitotic cells might assist the invagination process, we next modeled a mitotic cell at the apical surface, as a small compliant region (yellow star in Figure 6), to represent cytoskeletal changes (disassembly of the apical actin network) during mitosis. However, no invagination was seen in these simulations (Figure 6B and Supplemental Movie 2), suggesting that another feature is necessary in the model.
Figure 6. A computational model to investigate the forces involved in fold development.
(A–D) FEM plots from the simulations run in Abaqus, with apical surface emphasis added (dashed lines). The values of the vertical component of the displacement correspond to the colors on the heat map. Line drawings above summarize the results. (A, B) Compression from the clusters alone or in combination with a defect in stiffness to represent a mitotic cell is insufficient to cause an invagination. (C) Addition of a vertical contraction at a mitotic cell generates a fold with similar morphology to that observed in vivo (compare with Figure 4, panel C). The combination of these three factors result in cell division-mediated invaginations in the intestinal epithelium. (D) Cell rounding in the absence of cell expansion results in a broader invagination that resembles V-shaped folds (compare with Figure 4, panel B). Movies of these simulations are also provided (Supplemental Movies 1–4).
Kondo and Hayashi report that invagination is associated with downward movement of the rounded mitotic cell into the epithelium, giving rise to internally rounded mitotic cells,21 a feature clearly detected in the murine intestine. Recent work in the zebrafish otic primordium further confirms that in a pseudostratified epithelium, at the points of strain, mitotically rounded cells contract along the apical-basal axis.22 Therefore, additional simulations included a negative inelastic growth strain (contraction) applied in the vertical direction to both the small apical contact and the cytoplasmic region containing the cell. Combining these three features (cluster-dependent strain, a compliant apical defect and vertical contraction) results in a fold with closely opposed membrane, similar to the T-shaped folds observed in vivo (Figure 6C, Supplemental Movie 3).
Finally, to explore whether mitosis (both the compliant apical defect that models rounding and the vertical contraction that accompanies rounding) is sufficient to form invaginations, we ran simulations with these two features alone, but without cluster expansion. Interestingly, in this case, the apical surface deformed with a rounded indentation (Figure 6D, Supplemental Movie 4), reminiscent of the V-shaped folds observed at some dividing cells that are apically located and not associated with invaginations (Figure 4B), and also similar in appearance to mitotic cells that are present prior to clusters formation at E14.5. Together, these simulations suggest that intraepithelial forces produced by cluster-mediated epithelial shape changes and internalized mitotic cell rounding are sufficient to produce apical invaginations that mirror those seen at membrane invaginations in vivo.
In vivo evidence for enriched actin in basal processes of mitotic cells
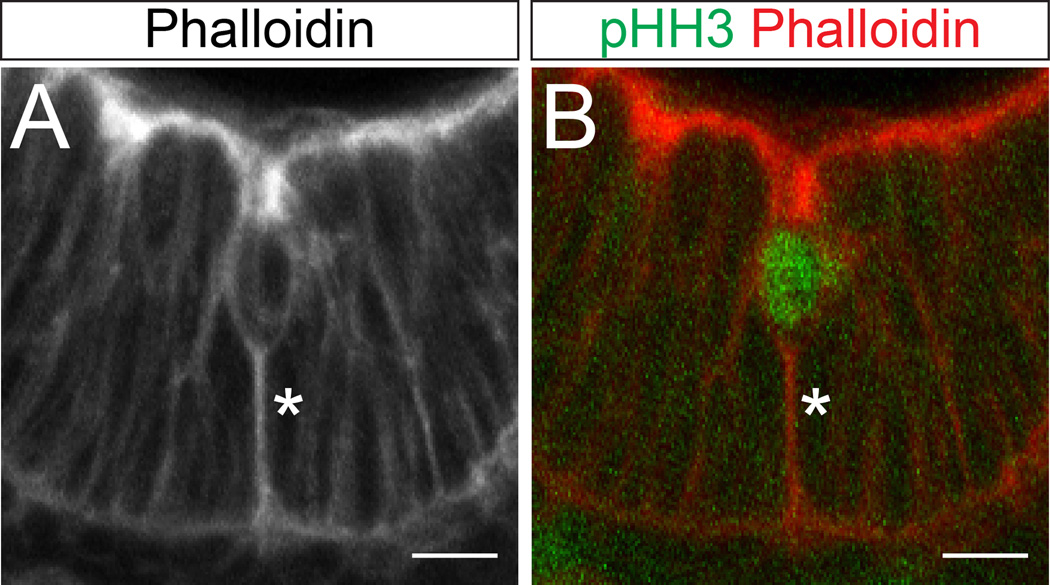
As shown in Figure 4C, mitotic cells at apical intestinal folds are reduced in height and “internalized”; they connect to the main lumenal surface by a short extension of apically stained membrane, a feature that they share with mitotic cells that facilitate invagination in the Drosophila tracheal placode.21 Active apical-basal shortening of mitotic cells in the context of the developing otic epithelium has also been demonstrated by Hoijman et al., and in that study, the basal process of the mitotic cell was found to be enriched in filamentous actin.22 Since our computational model predicts that a contraction oriented in the apical-basal direction at the position of the mitotically rounded cell is critical for proper folding, we examined E14.5 and E15.5 intestinal sections stained with phalloidin (which marks F-actin). Enhanced actin staining was indeed detected in the basal processes of cells dividing at invaginations (Figure 7), potentially indicating an active downward force.
Figure 7. F-actin enrichment in mitotic cells located at T-folds.
(A) A mitotically rounded cell at a T-fold, stained with phalloidin to mark F-actin. Note the tether of F-actin (asterisk) from the base of the cell body to the basal surface. Also note that the top of the cell body is well below the apical surface of the epithelium (internalized cell rounding). (B) The same cell, with phalloidin in red and pHH3 in green. Scale bar = 20 µm.
Discussion
The morphological events involved in villus formation were first described several decades ago. However, the use of thin sections to document the dramatic epithelial changes that occur during this process led to the incorrect conclusions that the early epithelium is stratified and that de novo lumen formation is an important feature of villus morphogenesis.2,4,12 The work described here utilizes recently redefined parameters regarding intestinal morphogenesis: the epithelium prior to remodeling is a single pseudostratified epithelial cell layer and lumenal expansions are invaginations of the apical surface.13 Within this revised context, we suggest a new model to account for initial epithelial changes during establishment of the villus domains.
We propose that demarcation of the first villi involves formation of patterned epithelial invaginations that, in turn, require inputs from cell-cell signaling events combined with intraepithelial compressive forces. First, Hh signals from the thick pseudostratified epithelium cause sub-epithelial mesenchymal clusters to form.16 The positioning of these clusters is determined by a self-organizing Turing field mechanism that is driven by mesenchymal Bmp signaling.17 Over the next 36 hours, these clusters spread in a proximal to distal wave over the length of the intestine.16,17 As they form, clusters signal to the overlying epithelium, causing these cells to change shape, shortening in the apical-basal dimension and expanding laterally. We propose that these localized shape changes over the clusters generate an intraepithelial compressive force on cells located between clusters. Within these pressurized regions, mitotic cell rounding causes rapid invagination of the apical surface.
This process of mitosis-assisted invagination is faithfully recapitulated by our computational model, demonstrating that intraepithelial mechanical forces are sufficient to result in invaginations similar to those seen in vivo. Three features are required to recapitulate the fold structure in silico: pressure from expansion of the clusters, compliancy of the apical surface due to cortical actin changes in the rounded cell, and a vertical displacement of the mitotic cell in the apical-basal dimension. Removal of any of these components from the computational model results in a failure of a typical T-like invagination to occur.
Overall, the apical invagination accompanying villus morphogenesis shares many features with tracheal placode invagination in Drosophila. First, the process is accompanied by a patterned field of intraepithelial forces that place a passive compressive force on the regions that will indent. In the intestine, this compression likely arises from the lateral expansion of epithelial cells over clusters. Second, mitotic cells are associated with invaginations in both cases. Third, these cells have a characteristic appearance in sectioned material, previously defined as “internalized cell rounding.”21 That is, these cells round up and enter mitosis well beneath the main surface of the epithelium, but remain connected to the lumen by the apical membrane fold. Finally, the process of invagination is very fast in both cases, taking place over a period of minutes. Live cell imaging of Drosophila tracheal placode invagination shows that the initiation of mitosis in a cell within the constricted region releases the stored resistance of central cells and results in a rapid invagination.21 In the intestine, we propose that similar forces result in the rapid demarcation of villus boundaries.
The revised model that we propose here for apical invagination in the mouse relies on the intersection of tissue mechanics with soluble signals to pattern the location of villus domains. The combined action of tissue forces and signaling is also seen during morphogenesis of the chick intestine, but the mechanistic details of that process exhibit interesting differences in chick and mouse. This might not be surprising, as it has been noted that over evolutionary time, villi likely arose independently in birds and mammals as morphological adaptations to assist nutrient absorption.40 During “villification” in the chick, mechanical forces from the developing muscle layers actively set the pattern for the eventual location of clusters and villi.41 Formation of an inner circular smooth muscle deforms the epithelium into longitudinal ridges, and subsequent development of an outer longitudinal layer forces those ridges into zig-zags. These progressive epithelial deformations serve to trap localized maxima of Hh ligand secreted from the epithelium. Hh signals then induce the expression of mesenchymal cluster factors, such as Bmp4, which promote villus emergence from the arms of the zig-zags.40,41 Thus, in the chick, mechanical forces establish a pattern of epithelial deformations that then direct, via signaling, the formation of mesenchymal clusters and villi.
In contrast, in mammalian species studied to date (mouse, rat, pig, and human), the epithelium never forms zig-zags, though in some cases, a few longitudinal pre-villus ridges are observed.42–45 Additionally, in the mouse and human, formation of muscle layers does not coincide with villus formation; thus, muscle-induced tension does not play a patterning role.17,42,43 Rather, as demonstrated here in the mouse, a patterned field of mesenchymal clusters forms prior to any epithelial deformation, but the presence of these clusters provides subsequent mechanical input to the epithelium. That is, these clusters signal to overlying epithelial cells to promote cell shape changes, thereby creating a pattern of intraepithelial forces that determine where villus boundaries will lie. Elucidating the exact nature of these mesenchymally-derived morphogenic signals will be an important goal for future investigations.
It is also noteworthy that by the time villi initiate in the chick, epithelial cells have already adopted a short columnar structure.41,46 Indeed, this flexible structure is probably required for effective muscular deformation of the epithelium that is needed to create the deep alcoves that can trap Hh signals.40,41 In contrast, mouse villi arise directly from a 50 µm thick pseudostratified epithelium. Thus, villus development in the mouse requires a mechanism to quickly fold this thick epithelium in a patterned manner that corresponds with the established pattern of mesenchymal clusters. We propose that the use of mitosis-associated epithelial folding facilitates this transition to rapidly generate the initial villus domains.
Supplementary Material
Insight Box.
Fingerlike projections called villi amplify the surface area of the intestine to permit efficient nutrient absorption. In the mouse, villus formation involves precise folding of a thick pseudostratified epithelium into a series of individual villus domains. The process is extremely rapid; boundaries of individual villi are determined on the timescale of several minutes. In this study, we provide novel insight into this complex morphogenic process by developing a predictive computational model of cytoskeletal force-generated fold formation that is based on in vivo observations. This model explains how patterning cues are transferred from the underlying mesenchyme to the overlying epithelium and cause rapid morphogenic changes to the overlying epithelial structure that define the boundaries of the first villi.
Acknowledgments
The authors would like to thank the University of Michigan Microscopy and Image Analysis Laboratory for assistance with preparing and imaging samples. We also would like to thank Drs. Linda Samuelson, Jason Spence, Daniel Teitelbaum, Kristen Verhey, Katherine Walton, and Yukiko Yamashita for discussions. Support was provided by NIH F30 DK100125 and the University of Michigan Medical Scientist Training Program (AMF) and NIH R01 DK089933 (DLG).
Footnotes
Competing Interests
The authors declare no conflicts of interest
Author Contributions
Contributed to concepts, approaches: AMF, SKS, YS, KT, ASG, SR, KG, SS, BM, DLG
Performed experiments: AMF, MNG, SW
Performed computations: SKS, YS, SR
Analyzed data: AMF, SKS, SR, KG, SS, DLG
Prepared the manuscript: AMF, SKS, DLG
Edited the manuscript: AMF, SKS, KG, DLG
References
- 1.Helander HF, Fändriks L. Scandinavian Journal of Gastroenterology. 2014;49:681–689. doi: 10.3109/00365521.2014.898326. [DOI] [PubMed] [Google Scholar]
- 2.Mathan M, Moxey PC, Trier JS. Am. J. Anat. 1976;146:73–92. doi: 10.1002/aja.1001460104. [DOI] [PubMed] [Google Scholar]
- 3.Moxey PC, Trier JS. The Anatomical Record. 1979;195:463–482. doi: 10.1002/ar.1091950307. [DOI] [PubMed] [Google Scholar]
- 4.Madara JL. Comprehensive Physiology. Hoboken, NJ, USA: John Wiley & Sons, Inc; 2010. [Google Scholar]
- 5.Sauvanet C, Wayt J, Pelaseyed T, Bretscher A. Annu. Rev. Cell Dev. Biol. 2015;31:593–621. doi: 10.1146/annurev-cellbio-100814-125234. [DOI] [PubMed] [Google Scholar]
- 6.Goulet O, Ruemmele F, Lacaille F, Colomb V. J. Pediatr. Gastroenterol. Nutr. 2004;38:250–269. doi: 10.1097/00005176-200403000-00006. [DOI] [PubMed] [Google Scholar]
- 7.Goulet O, Ruemmele F. YGAST. 2006;130:S16–S28. doi: 10.1053/j.gastro.2005.12.002. [DOI] [PubMed] [Google Scholar]
- 8.Stelzner M, Chen DC. Rejuvenation Research. 2006;9:20–25. doi: 10.1089/rej.2006.9.20. [DOI] [PubMed] [Google Scholar]
- 9.Clarke R. J Embryol Exp Morph. 1967;17:131–138. [PubMed] [Google Scholar]
- 10.Forrester JM. J. Anat. 1972;111:283–291. [PMC free article] [PubMed] [Google Scholar]
- 11.Helmrath MA, VanderKolk WE, Can G, Erwin CR, Warner BW. J. Am. Coll. Surg. 1996;183:441–449. [PubMed] [Google Scholar]
- 12.Toyota T, Yamamoto M, Kataoka K. Arch. Histol. Cytol. 1989;52:51–60. doi: 10.1679/aohc.52.51. [DOI] [PubMed] [Google Scholar]
- 13.Grosse AS, Pressprich MF, Curley LB, Hamilton KL, Margolis B, Hildebrand JD, Gumucio DL. Development. 2011;138:4423–4432. doi: 10.1242/dev.065789. [DOI] [PMC free article] [PubMed] [Google Scholar]
- 14.Karlsson L, Lindahl P, Heath JK, Betsholtz C. Development. 2000;127:3457–3466. doi: 10.1242/dev.127.16.3457. [DOI] [PubMed] [Google Scholar]
- 15.Kolterud A, Grosse AS, Zacharias WJ, Walton KD, Kretovich KE, Madison BB, Waghray M, Ferris JE, Hu C, Merchant JL, Dlugosz AA, Kottmann AH, Gumucio DL. Gastroenterology. 2009;137:618–628. doi: 10.1053/j.gastro.2009.05.002. [DOI] [PMC free article] [PubMed] [Google Scholar]
- 16.Walton KD, Kolterud A, Czerwinski MJ, Bell MJ, Prakash A, Kushwaha J, Grosse AS, Schnell S, Gumucio DL. Proc. Natl. Acad. Sci. U.S.A. 2012;109:15817–15822. doi: 10.1073/pnas.1205669109. [DOI] [PMC free article] [PubMed] [Google Scholar]
- 17.Walton KD, Whidden M, Kolterud A, Shoffner SK, Czerwinski MJ, Kushwaha J, Parmar N, Chandhrasekhar D, Freddo AM, Schnell S, Gumucio DL. Development. 2016;143:427–436. doi: 10.1242/dev.130112. [DOI] [PMC free article] [PubMed] [Google Scholar]
- 18.Tawk M, Araya C, Lyons DA, Reugels AM, Girdler GC, Bayley PR, Hyde DR, Tada M, Clarke JDW. Nature. 2007;446:797–800. doi: 10.1038/nature05722. [DOI] [PubMed] [Google Scholar]
- 19.Buckley CE, Ren X, Ward LC, Girdler GC, Araya C, Green MJ, Clark BS, Link BA, Clarke JDW. The EMBO Journal. 2013;32:30–44. doi: 10.1038/emboj.2012.305. [DOI] [PMC free article] [PubMed] [Google Scholar]
- 20.Nishimura M, Inoue Y, Hayashi S. Development. 2007;134:4273–4282. doi: 10.1242/dev.010397. [DOI] [PubMed] [Google Scholar]
- 21.Kondo T, Hayashi S. Nature. 2013;494:125–129. doi: 10.1038/nature11792. [DOI] [PubMed] [Google Scholar]
- 22.Hoijman E, Rubbini D, Colombelli J, Alsina B. Nat Comms. 2015;6:7355. doi: 10.1038/ncomms8355. [DOI] [PubMed] [Google Scholar]
- 23.Hughes TJ. The finite element method: linear static and dynamic finite element analysis. Courier Corporation; 2012. [Google Scholar]
- 24.Fehon RG, McClatchey AI, Bretscher A. 2010:1–12. doi: 10.1038/nrm2866. [DOI] [PMC free article] [PubMed] [Google Scholar]
- 25.Monier B, Gettings M, Gay G, Mangeat T, Schott S, Guarner A, Suzanne M. Nature. 2015;518:245–248. doi: 10.1038/nature14152. [DOI] [PubMed] [Google Scholar]
- 26.Yamaguchi Y, Shinotsuka N, Nonomura K, Takemoto K, Kuida K, Yosida H, Miura M. The Journal of Cell Biology. 2011;195:1047–1060. doi: 10.1083/jcb.201104057. [DOI] [PMC free article] [PubMed] [Google Scholar]
- 27.Yamaguchi Y, Miura M. Cell. Mol. Life Sci. 2012;70:3171–3186. doi: 10.1007/s00018-012-1227-7. [DOI] [PMC free article] [PubMed] [Google Scholar]
- 28.Wang T, Yanger K, Stanger BZ, Cassio D, Bi E. J. Cell. Sci. 2014;127:2483–2492. doi: 10.1242/jcs.139923. [DOI] [PMC free article] [PubMed] [Google Scholar]
- 29.Schlüter MA, Pfarr CS, Pieczynski J, Whiteman EL, Hurd TW, Fan S, Liu C-J, Margolis B. Molecular Biology of the Cell. 2009;20:4652–4663. doi: 10.1091/mbc.E09-02-0137. [DOI] [PMC free article] [PubMed] [Google Scholar]
- 30.Taniguchi K, Shao Y, Townshend RF, Tsai Y-H, DeLong CJ, Lopez SA, Gayen S, Freddo AM, Chue DJ, Thomas DJ, Spence JR, Margolis B, Kalantry S, Fu J, O’Shea KS, Gumucio DL. Stem Cell Reports. 2015;5:954–962. doi: 10.1016/j.stemcr.2015.10.015. [DOI] [PMC free article] [PubMed] [Google Scholar]
- 31.Odell GM, Oster G, Alberch P, Burnside B. Developmental Biology. 1981;85:446–462. doi: 10.1016/0012-1606(81)90276-1. [DOI] [PubMed] [Google Scholar]
- 32.Gelbart MA, He B, Martin AC, Thiberge SY, Wieschaus EF, Kaschube M. Proc. Natl. Acad. Sci. U.S.A. 2012;109:19298–19303. doi: 10.1073/pnas.1205258109. [DOI] [PMC free article] [PubMed] [Google Scholar]
- 33.Polyakov O, He B, Swan M, Shaevitz JW, Kaschube M, Wieschaus E. Biophysical Journal. 2014;107:998–1010. doi: 10.1016/j.bpj.2014.07.013. [DOI] [PMC free article] [PubMed] [Google Scholar]
- 34.Moeendarbary E, Valon L, Fritzsche M, Harris AR, Moulding DA, Thrasher AJ, Stride E, Mahadevan L, Charras GT. Nature Materials. 2013;12:253–261. doi: 10.1038/nmat3517. [DOI] [PMC free article] [PubMed] [Google Scholar]
- 35.Brunser O, Luft JH. Journal of Ultrastructure Research. 1970;31:291–311. doi: 10.1016/s0022-5320(70)90133-4. [DOI] [PubMed] [Google Scholar]
- 36.Lu L, Oswald SJ, Ngu H, Yin FCP. Biophysical Journal. 2008;95:6060–6071. doi: 10.1529/biophysj.108.133462. [DOI] [PMC free article] [PubMed] [Google Scholar]
- 37.Matthews HK, Delabre U, Rohn JL, Guck J, Kunda P, Baum B. Developmental Cell. 2012;23:371–383. doi: 10.1016/j.devcel.2012.06.003. [DOI] [PMC free article] [PubMed] [Google Scholar]
- 38.Li B, Cao YP, Feng XQ, Gao H. Journal of the Mechanics and Physics of Solids. 2011;59:758–774. [Google Scholar]
- 39.Garikipati K. Applied Mechanics Reviews. 2009;62 030801–030801–7. [Google Scholar]
- 40.Shyer AE, Huycke TR, Lee C, Mahadevan L, Tabin CJ. Cell. 2015;161:569–580. doi: 10.1016/j.cell.2015.03.041. [DOI] [PMC free article] [PubMed] [Google Scholar]
- 41.Shyer AE, Tallinen T, Nerurkar NL, Wei Z, Gil ES, Kaplan DL, Tabin CJ, Mahadevan L. Science. 2013;342:212–218. doi: 10.1126/science.1238842. [DOI] [PMC free article] [PubMed] [Google Scholar]
- 42.Lacroix B, Kedinger M, Simon-Assmann P, Haffen K. Gut. 1984;25:925–930. doi: 10.1136/gut.25.9.925. [DOI] [PMC free article] [PubMed] [Google Scholar]
- 43.Matsumoto A, Hashimoto K, Yoshioka T, Otani H. Anatomy and Embryology. 2002;205:53–65. doi: 10.1007/s00429-001-0226-5. [DOI] [PubMed] [Google Scholar]
- 44.Nakamura K, Komuro T. Journal of Electron Microscopy. 1983;32:338–347. [PubMed] [Google Scholar]
- 45.Dekaney CM, Bazer FW, Jaeger LA. The Anatomical Record. 1997;249:517–523. doi: 10.1002/(SICI)1097-0185(199712)249:4<517::AID-AR12>3.0.CO;2-R. [DOI] [PubMed] [Google Scholar]
- 46.Burgess DR. Development. 1975;34:723–740. [PubMed] [Google Scholar]
Associated Data
This section collects any data citations, data availability statements, or supplementary materials included in this article.


