Abstract
This study used novel, force-limited nanoscale tension gauges to investigate how force and substrate stiffness guide cellular decision-making during initial cell attachment and spreading on deformable substrates. The well-established dependence of cell traction and spreading on substrate stiffness has been attributed to levels of force exerted on molecular components in focal contacts. The molecular tension gauges used in this study enabled direct estimates of threshold, pico Newton forces that instructed decision-making at different stages of cell attachment, spreading, and adhesion maturation. Results show that the force thresholds controlling cellular adhesion and spreading transitions depend on substrate stiffness. Reported findings agree qualitatively with a proposed model that attributes rigidity-dependent differences in cell spreading to stiffness-dependent rates of competing biochemical processes. Moreover, estimated magnitudes of force thresholds governing transitions in cell attachment and spreading, based on these in situ measurements, were in remarkable agreement with prior less direct measurements.
Keywords: Tension gauge tethers, integrin, force sensor, adhesion, rigidity sensing
Graphical abstract
The use of innovative nanoscale force probes provided novel insights into how the integration of cellular force sensing and substrate deformation instruct cell attachment and spreading.
Introduction
Cells sense substrate rigidity through integrin-based focal adhesions (FA) to extracellular matrix (ECM) proteins, in order to regulate cell attachment, spreading, and focal adhesion maturation1–4. Cell spreading on nanopatterned and deformable substrates or on micropillar arrays revealed different biophysical triggers that appear to instruct cellular decision-making at different stages of adhesion and spreading5–8. The molecular origins of those biophysical cues, the forces involved, and their dependence on substrate rigidity are still subjects of intensive investigation motivated in part by evidence that the underlying molecular events contribute to stem cell lineage specification and disease9–13.
Diverse studies identified molecular and cellular processes that guide cell behavior at different stages of adhesion and spreading on soft versus rigid substrates. Initial ligation is sufficient to activate integrin clustering without force application14. Studies suggested that tension generated by integrin-actomyosin clutch engagement switches integrin-ligand cross-links to a higher affinity- high tension, signaling-competent state that activates FA maturation, distinguished by vinculin recruitment14.
These integrin-mediated processes are altered by substrate stiffness4. α5β1 integrins reportedly formed fewer, high-affinity crosslinks on softer ECM, and analyses of AFM data suggested that integrin-ligand bonds are weaker in cells on soft versus rigid substrates14. β1 integrin activation was also higher in stem cells on soft substrata versus cells on stiff ECM, and integrins were more extensively internalized9.
Forces on focal contacts are presumed to alter cell adhesion and spreading when they exceed force thresholds regulating underlying biochemical processes5, 7, 15–17. Integrin-mediated cell adhesion and spreading is postulated to occur in three phases governed by membrane tension and forces exerted on integrin bonds5, 7. In the initial attachment phase (P0), ligation activates integrins but in absence of sufficient tension cells remain rounded, preventing cell spreading14, 18. Increased tension on focal contacts activates the cell-spreading phase (P1), which is characterized by the rapid, circumferential extension of lamellipodia with only weak cell contractions7. The extension of excess membrane increases membrane tension5. Upon reaching about 60% of the final spread area, the onset of myosin II activated contractions signal the transition to the contractile phase (P2), which is distinguished by periodic contractions, postulated rigidity sensing, and focal adhesion (FA) maturation. The transitions correspond to changes in integrin bond forces, which in turn may be influenced by substrate stiffness. In some cases, the forces actuating these changes were estimated using optical tweezers or measured changes in membrane tension5, 19. However, determining the force thresholds that activate cellular behavior typically involves external perturbations and biophysical approaches that often lack the sensitivity to quantify relevant cellular or molecular forces.
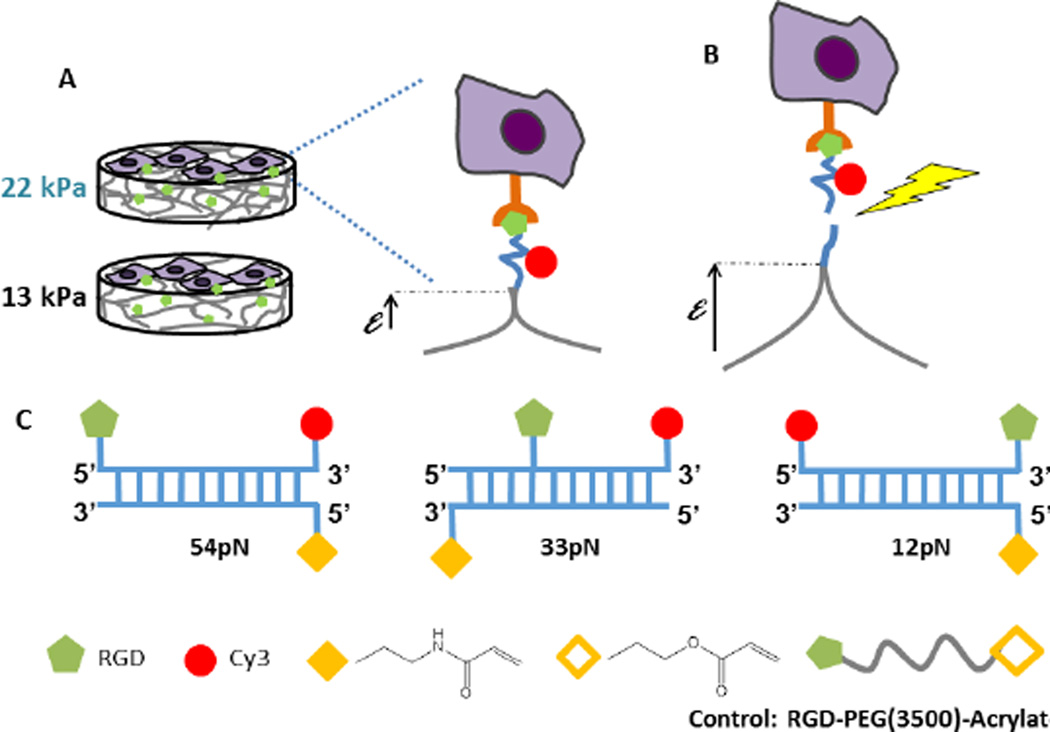
The development of diverse autonomous, noninvasive force reporters has enabled nanoscale in situ measurements of forces exerted on adhesion molecules20–25. Of the reported molecular force sensors, Tension Gauge Tethers (TGTs) are novel force reporters that are based on a double stranded DNA backbone, in which the reporter strand is modified with an adhesion ligand and a fluorescent dye Cy3 (Fig. 1C)25. If force on the TGT exceeds the tension tolerance (Ttol) of the tether, then cells tear the reporter strand off the substrate, and leave dark patches where the Cy3 is removed (Fig. 1B). The ligand position along the reporter strand determines the force threshold for dsDNA rupture (Ttol), which can be tuned from ~12pN to >100pN (Fig. 1C). The TGTs increase the range beyond, for example, than detected by force sensors based on spider silk protein23. When anchored to substrates, TGTs cap the bond tension and TGT rupture reports the force exerted on individual adhesive bonds. The Cy3 reporter can also be imaged at the single molecule level.
Figure 1.
Schematic of the force response of TGTs on soft substrates. (A) Cell attachment to TGT-modified hydrogels with elastic moduli of 13kPa (soft) and 22kPa (rigid). (B) Cells deform the substrates until the tension exceeds tension tolerance (Ttol) and the cells tear off the sensing strand (yellow jagged arrow). (C) DNA duplex tethers with tunable Ttol. The anchor DNA is covalently linked to the gel through polymerizable acrydite monomers (solid yellow diamond). The ‘reporter’ strand contains a 3’ Cy3 dye (red circle) and the location of the RGD peptide along the strand (green pentagon) determines the tension tolerance Ttol. In this study, Ttol values were 12pN, 33pN, or 54pN. The control is a RGD peptide covalently linked to an acrylate group (hollow yellow diamond).
This study used RGD-modified TGTs to investigate the pico Newton threshold forces on individual integrin-ligand bonds required to support cell attachment, and to activate transitions in cell spreading and focal adhesion maturation on deformable hydrogel substrates (Fig. 1A). We report differences in attached cell densities and cell spreading, on soft and stiff gels modified with tension gauges at similar densities. Observations in the first 30minutes revealed that cell adhesion and spreading are regulated by novel coupling between substrate rigidity and force on integrin bonds. Differences in force thresholds that trigger spreading transitions could not be attributed to the bond force alone. We compare these findings with a recent model predicting how stiffness dependent strain rates affect competing biochemical processes controlling cell adhesion17. Our results estimated the force thresholds for the predicted transitions, and characterized an early process not included explicitly in the model.
Results
Covalent TGT attachment on hydrogel substrates
TGTs with Ttol of 12pN, 33pN, and 54pN were coupled to substrates of various moduli, at similar tether densities (Fig. S1). These Ttol values are below the rupture force of individual integrin-RGD bonds26. Tuning the concentration of PEGDA in the pre-polymer solution altered the crosslinking density and the elastic modulus of the resulting hydrogels. Photopolymerized PEGDA solutions of 7 and 10 %(w/w) cross linker yielded substrates with elastic moduli of 13.1 ± 4.3 and 22.0 ± 2.1 kPa, respectively (Fig. 1A). The uniform gel fluorescence indicated homogeneous tether coverage (Fig. S1A).
Analysis of Cy3 fluorescence in the different gels suggested some differences in the RGD densities at different cross-linking density, (Fig. S1B; p<0.05, N=3). Within a stiffness group, the apparent differences in the fluorescence intensities measured with TGTs of different Ttol is partly due to the location of the Cy3 reporter along the DNA backbone, which alters the fluorophore mobility and quantum yield. The latter dependence was apparent from measurements of the TGTs in solution. Between stiffness groups (13kPa versus 22kPa), there were differences in the fluorescence intensity in the gels. This is attributed in part to differences in the local environment, possibly due to altered fluorophore mobility27. As discussed in the Supplemental Information (Methods), specific steps were taken to insure that TGT concentrations prior to polymerization would result in the same final immobilized TGT concentrations in each hydrogel. Despite this, we cannot completely rule out the possibility that intensity differences could be due to some differences in coupling efficiency.
Cell attachment depends on both substrate stiffness and TGT tension tolerance
Cell attachment density (cells/mm2) was assessed for all combinations of gel stiffness and Ttol. Because Ttol is a determined, constant value bond failure is independent of the gel network structure (i.e. mesh size).
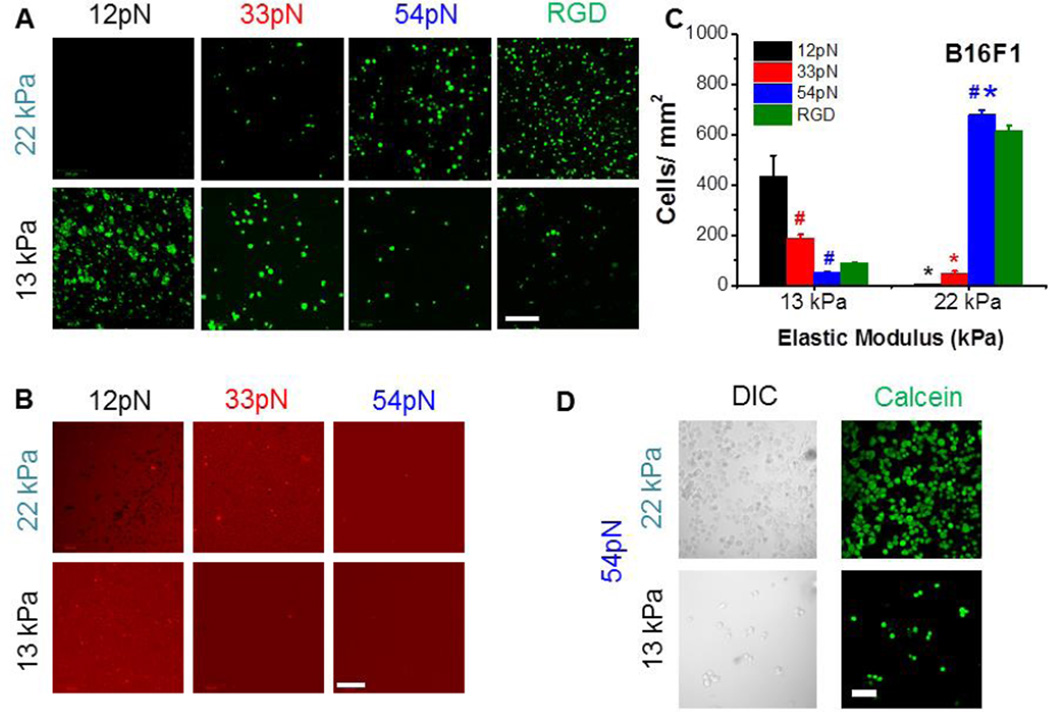
Figure 2A shows images of B16F1 cells and substrates 30 minutes after seeding the same number of cells on each gel. The cells were incubated for 30 minutes on TGT-modified hydrogels, followed by gently washing away unbound cells. Next, we quantified the attached cell densities (cells/mm2), and assessed whether cells extensively ruptured tethers (Fig. 2B). Two different mechanisms appeared to control cell detachment, one being mechanical and the other biochemical. The ‘mechanical’ mechanism involved extensive TGT tear off, apparent from the cell-sized dark patches (footprints) where tether tear-off removed Cy3 (and cells) from the substrate (Fig. 2B). Cells often endocytosed the tethers, and appeared red (Fig. 3B lower panel, S2B,C). The second, biochemically-controlled mechanism was evident from the low cell densities and a lack of obvious dark footprints. The latter behavior suggested that a mechanism(s) other than tether tear-off regulated cell adhesion.
Figure 2.
Confocal images of adherent melanoma cells (B16F1) on soft substrates of different stiffness and tension tolerance. (A) Green designates Calcein A cell staining (Live/Dead assay®). Scale bar 200 µm. (B) Red designates Cy3 from TGT. Scale bar 200 µm. (C) Cell density as a function stiffness and tension tolerance for B16F1. The error bars represent S.E.M. *p<0.05 between different stiffness groups and #p<0.05 between different tether tolerance (at same gel stiffness). (Nexp=3). (D) Comparison of Calcein A cell staining and DIC images on 54pN, 13kPa and 54pN, 22kPa substrates. Scale bar is 50 µm.
Figure 3.
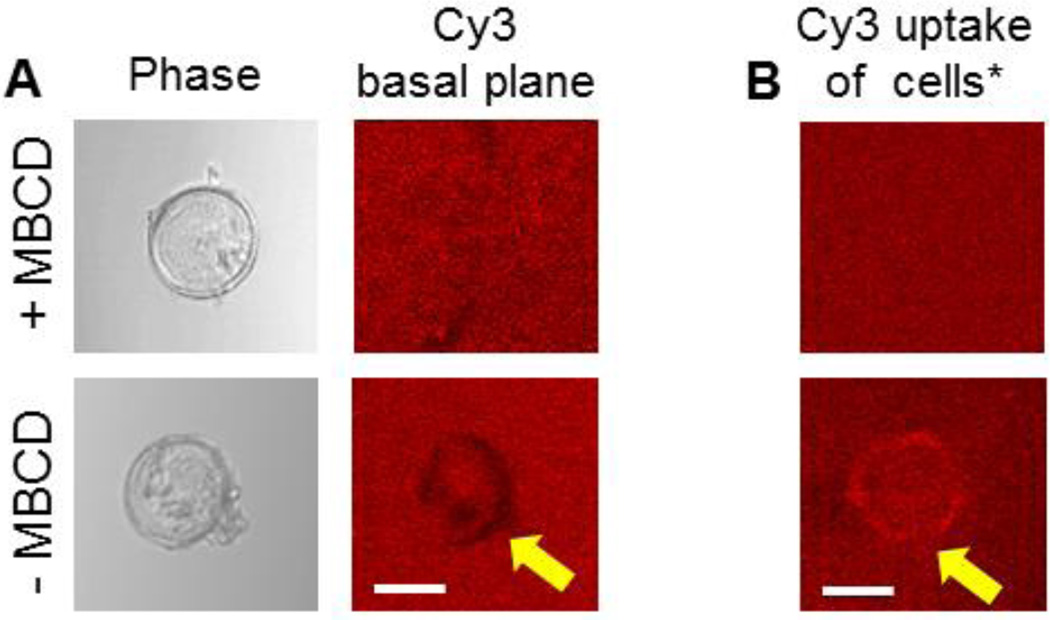
(A) Phase and Cy3 channel images of the basal plane of cell, plated on 13 kPa substrates decorated with 12pN TGT. Cells were plated with and without MBCD treatment. The arrow indicates loss of fluorescence. (B) Cy3 channel images showing the uptake of TGT in cells with and without MBCD treatment. The arrow indicates the gain of fluorescence or the uptake of TGT. Scale bar 50µm. (Nexp=2) *Not the same cells as shown in panel A.
On the stiffer (22kPa) gels, the attached cell densities increased with increasing tether Ttol (Fig. 2C). No cells remained on 12pN TGTs, and there were numerous cell-sized dark footprints in Cy3 images of the gels, indicating that cell detachment resulted from extensive tether tear off (Fig. 2B, top left). The detection of Cy3 fluorescence in cells washed off the substrates (Fig. S2B,E) confirmed tether tear off and endocytosis. On 33pN tethers (22kPa modulus), the cell densities were higher than on 12pN tethers (Fig. 2A,C), and there was less evidence of tether tear off (Figs. 2B, S2H). Numerous cells attached and spread on 54pN TGTs (Fig. 2A,C), and there was no evidence of tether tear-off in the Cy3 images (Fig. 2B, S2E,F,G,I). These trends, and the lack of tear off at Ttol > 34pN agreed with reported cell adhesion on TGT-coated glass25.
Surprisingly, on the softer hydrogels (13kPa) cell densities exhibited the opposite trend-cells adhered to all substrata regardless of Ttol, but the highest cell densities were on the 12pN TGT-coated gels (Fig. 2A,C). The absence of detectable dark footprints on the gels with 54pN tethers (Fig. 2B, S2I) confirmed that the low cell density was not due to TGT tear off. Consistent with this interpretation, the few cells that were attached to 54pN tethers did not internalize Cy3 (Fig. S5B). There were similarly few cell-sized footprints on the 13kPa gels with either 12pN or 33pN tethers (Fig. 2B), but most of the attached cells were red, indicative of some tether tear off and endocytosis (Fig. S5B). Interestingly, there was a higher fraction of attached cells with internalized 33pN tethers on 13kPa versus 22kPa gels (Fig. S5B). Tests with CHOK1 and U87MG cells were qualitatively similar, although the absolute attached cell densities differed quantitatively (p<0.05, Nexp=2) (Figs. S3, S4).
To investigate whether the cells adhering to 12pN tethers on soft (13kPa) gels tore off and endocytosed some tethers, despite the absence of obvious footprints, we imaged Cy3 on the surface underneath cells at higher magnification. As shown in Figure 3A, lower panel, there were some small, dark patches on the substrate at the cell periphery where integrin tension is expected to be highest (Fig. S5A)21. However, tethers under the cell body remained intact. The imaged cells were red (Fig. 3B), indicative of tether endocytosis. Endocytosis was confirmed by the uniform fluorescence observed on imaged substrates under cells treated with 10 mM methyl-β-cyclodextrin (MBCD) (Fig. 3A, top panels), which blocks caveolin-mediated endocytosis. The Cy3 fluorescence at the basal plane beneath the cells with or without MBCD is summarized in Fig. 3B. The MBCD-treated cells did not take up Cy3 (Fig. 3B).
To confirm that the inverse relationship between attached cell densities and Ttol on soft gels was due to the coordinate effects of substrate rigidity and integrin bond tension, rather than different ligand densities, we tested cell attachment and spreading with control, RGD-modified hydrogels. With 13kPa and 22kPa gels modified with the non rupturable PEG-RGD ligand, more cells attached to the stiffer (22kPa) gel (Fig. 2A,C). This was expected, based on reported positive feedback between integrin tension and the activation of a high affinity integrin state and subsequent cell spreading14. Additionally, cells on 13kPa gels fabricated using a higher (2.2µM) 12pN tether concentration during polymerization also remained round. The control measurements confirmed that the low cell densities on soft, TGT-modified gels are not due to differences in ligand accessibility.
Substrate stiffness regulates cell attachment and spreading on intact TGTs
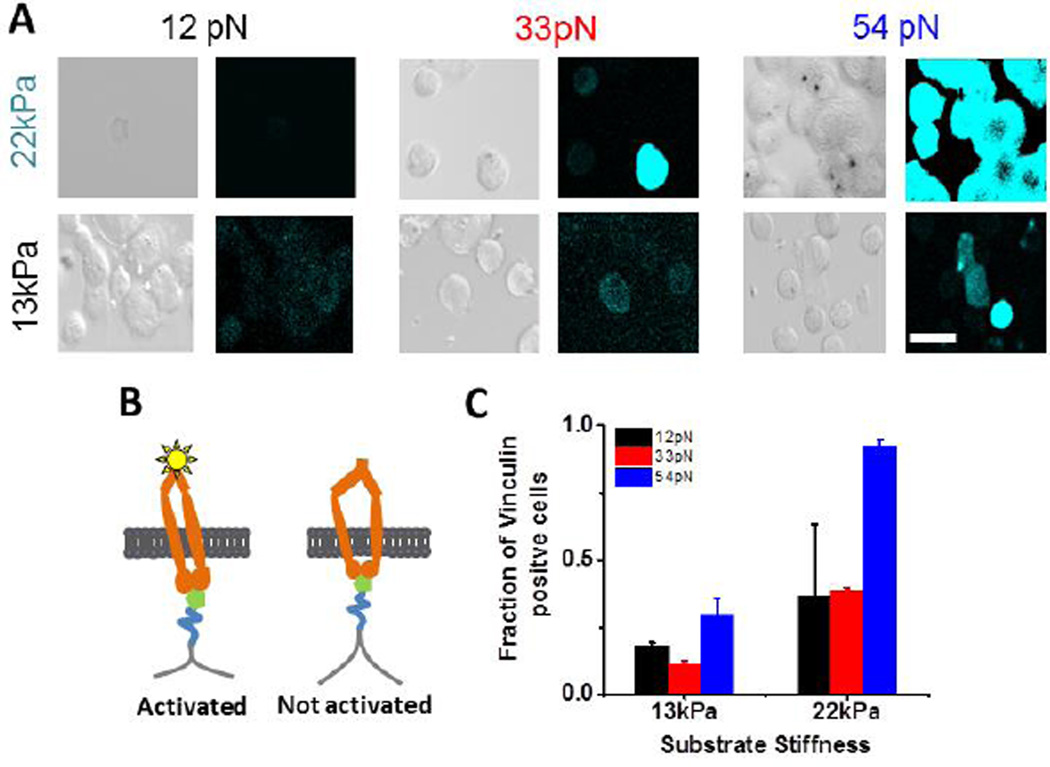
Both membrane and actomyosin-generated tension reportedly influence integrin-mediated cell adhesion and spreading, but at different phases of cell spreading5, 7, 28. To test whether the inability of cells to spread on and rupture 12pN TGTs on 13kPa gels was due to the arrested transitions to spreading P1 and contractile P2 phases, we imaged vinculin at the basal plane (Fig. 4A). Vinculin—an actin binding protein—is a common marker for FAs29. These measurements tested whether nascent focal adhesions formed on compliant, low Ttol substrates.
Figure 4.
(A) DIC and vinculin immunofluorescence (cyan) images at the basal plane of B16F1 cells on substrates of indicated stiffness and tension tolerance, imaged under identical conditions (cropped from images in Fig. S6A). Scale bar 50 µm. (B) Model of RGD binding, integrin activation, and vinculin binding (star). (C) Fraction of vinculin positive cells in the population of attached cells, under different conditions. The error bars represent S.E.M. (Nexp=2, n (cells)12pN,13kPa =30, n33pN,13kPa =36, n54pN,13kPa =36, n12pN,22kPa =8, n33pN,22kPa =36 n54pN,22kPa =45).
Figure 4A shows DIC and vinculin immunofluorescence images at the basal planes of cells on the different substrates 30min after seeding (see also Figures S6 A,B). In all cases within this time frame, vinculin and actin staining were diffuse, but there were clear, substrate-dependent differences. Vinculin was observed at the basal plane of cells on 54pN TGTs, regardless of the substrate stiffness, but a lower fraction of cells on the 13kPa gel exhibited basal vinculin (Fig. 4C). By contrast, although more cells adhered to 12pN tethers on soft gels (than on 54pN tethers, Fig. 2C), they remained round, and there was no vinculin staining at the basal plane (Fig. 4A,C, S6B). On 33pN tethers, the fraction of cells with basal vinculin was higher on 22kPa gels compared to 13kPa gels (Fig. 4A,C).
On 33pN tethers, integrin adhesions recruited basal vinculin on the stiffer 22kPa gels, but the fraction of vinculin positive cells was negligible on the 13kPa gels (Fig. 4A,C, S6B). There was little basal vinculin recruitment or extensive tether rupture on the 13kPa gels, although some cells did tear off and internalize tethers. Thus, softer gels altered both 33pN tether tear-off and vinculin recruitment, relative to cell behavior on 22kPa gels.
Cells on 54pN tethers recruited vinculin to the basal plane (Fig. 4A), but the fraction of vinculin positive cells in the remaining attached cells was lower on the soft gels. The substrate stiffness also influenced whether cells remained attached and spread, or detached without extensive TGT rupture (Fig. 2B). In contrast to cells on 12pN tethers, cells did not rupture and internalize 54pN tethers on soft gels (Fig. S5B). Instead, cells appeared unable to sustain stable integrin adhesions, and large numbers detached (Fig. 2A,C). The densities of cells on soft and rigid substrates were similar on both 54pN TGT and non rupturable RGD substrates (Fig. 2A,C)
Generally, cells spread more on higher Ttol substrates, regardless of the gel stiffness (Table S1). However, the lack of spreading or negligible vinculin recruitment to the basal plane of cells on soft gels with 12pN TGTs indicated that the cells were unable to transition to the spreading P1 phase, and suggested that the spreading transition threshold is between 12pN and 33pN, on the soft gels. This value is slightly lower than the 37pN estimated from measurements of membrane tension at the P1→P2 transition5.
Discussion
These findings revealed nanoscale coupling between substrate stiffness and force threshold controlling transitions in cell adhesion and spreading. This is evidenced by two related trends observed with soft (13kPa) versus stiff (22kPa) gels modified with tethers with different tension tolerance. First, the densities of attached cells on soft gels decreased with increasing tether tolerance, but on stiffer gels, the trend was reversed. Because cells were seeded at identical densities in all cases, these trends reflected mechanical and biochemical responses to substrate mechanics rather than variable cell seeding. Second, observed cell spreading and the extent of tether tear off demonstrated that matrix stiffness altered forces that control cell attachment and spreading.
Our results with 12pN TGTs, in particular, clearly demonstrated that substrate stiffness alters fundamental processes regulating cell behavior. On stiff gels, cells quickly generated sufficient force to extensively rupture tethers and detach, leaving dark footprints on the gels. By contrast, on soft gels, limited tether tear off was confined to regions at the cell periphery. More cells remained attached to 12pN tethers on soft than on stiff gels. Although there was some vinculin detected at the basal plane of the few remaining cells on 22kPa gels with 12pN tethers, cells on 13kPa gels activated negligible basal vinculin recruitment, and there was no evidence of tether tear off. These differences exposed coupling between bond tension, substrate mechanics, and cell biochemistry.
On soft matrices, cells reportedly exhibited extensive β1 integrin internalization9, and bond strengths were below levels needed to stabilize integrin ligation30, 31. The latter behavior is consistent with the decreasing cell densities on soft gels with 33pN and 54pN tethers. A recently proposed ‘dynamic clutch model’ would account for these observations. The model invoked competition between force-dependent rates of integrin-ligand bond rupture and talin unfolding, to account for stiffness-dependent traction and vinculin recruitment to focal adhesions17. Slower force-loading on soft substrates relative to stiff ones would result in more integrin bond rupture before sufficient tension developed to unfold talin and recruit vinculin. Greater integrin bond rupture would increase cell detachment, and decrease tether tear-off and vinculin accumulation, as we observed. Our results are thus consistent with the ‘dynamic clutch model’ predictions. Additionally, the findings enabled estimates of the transition force thresholds and characterized an early step not included explicitly in the model.
Cells on soft gels with 12pN TGTs ruptured and internalized some tethers. However, the 12pN cap was insufficient to activate membrane spreading (P1) on soft gels, and cells remained attached but round (P0). Consistent with the dynamic clutch model, postulated faster force-loading on stiffer (22kPa) gels would increase the load on integrin-RGD bonds faster than the integrin-RGD dissociation rate, resulting in greater 12pN tether tear-off, as observed.
The reduced tear-off and high cell densities on 12pN tethers on soft gels indicated that forces on the surviving tethers were < 12pN. The cells did spread on 33pN and 54pN tethers on the soft gels, suggesting that the 12pN cap arrested cell spreading. We speculate that the low-tension cap impaired actin-clutch engagement. Our results suggest this process requires forces between 12pN and 33pN. This result is in reasonable agreement with optical tweezers measurements of ~10pN forces required to activate an increased in integrin bond strength31.
The lower Cy3 fluorescence from 12pN tethers in 13kPa relative to 22kPa gels could reflect differences in tether density that might bias cell behavior. However, recent results showed that reducing integrin ligand density increased the average force on integrin-talin-actin linkages17 and reduced the substrate stiffness at which talin unfolded and activated vinculin recruitment. The latter trend is opposite our findings, supporting our view that the lack of spreading was not due to insufficient ligand density in the gels.
On 33pN tethers, the substrate stiffness altered the attached cell densities, and the apparent force threshold for the transition from the spreading (P1) to contractile (P2) phase, as evidenced by talin-dependent vinculin recruitment. The cell density was higher on soft relative to stiff gels (Fig. 2A,C), despite similar tether coverage (Fig. S1A, but the fraction of vinculin-positive attached cells on 13kPa gels was significantly lower (Fig. 4A,C, S6A,B). The latter finding agrees with the predicted stiffness-dependent shift towards greater integrin-ligand bond rupture and cell detachment, with correspondingly less talin unfolding and vinculin recruitment17, as we observed.
On soft gels, capping the force at 33pN impaired the transition to P2. In contrast, a higher fraction of adherent cells on 54pN tethers underwent the P2 transition, evidenced by vinculin recruitment to the basal plane (Fig. 4A, C). The latter results suggest a threshold force of ~33pN for the P1→P2 transition, in good agreement with the 37pN estimated from membrane tension measurements5.
The 54pN tethers supported vinculin accumulation at the basal planes of cells on both soft and rigid gels (Fig 4 A, S6A). However, in agreement with the recent model17, a lower fraction of cells activated vinculin recruitment on the soft gel (Fig. 4C). This resulted in more cells detaching due to integrin-RGD dissociation, without extensive tether tear off. The absence of tear off indicated that the force on the nascent focal contacts was below 54pN. Interestingly, recently reported forces in mature focal adhesions exceeded 100pN32.
We attribute the difference in cell densities and spreading on 12pN versus 54pN tethers on soft gels to different force-dependent processes. The dynamic clutch model predicts lower cell densities on 54pN tethers on soft versus stiff gels, because softer substrates favor integrin bond rupture whereas stiffer substrates favor vinculin activation and adhesion stabilization17, as we observed. The few remaining cells (on 54pN TGTs) exhibited the P1→P2 transition, controlled by talin unfolding and marked by vinculin recruitment. By contrast, on soft, 12pN gels, cells appeared unable to engage the actin clutch, and appeared to be decoupled from the mechanical machinery directing cell spreading on 54pN tethers.
Our reported spread cell areas (Table S1) agreed with another report of cell spreading as a function of tension tolerance33. Cell spreading depends both on bond density and tension, and tether failure reduces bond density. Additionally, cell spreading reportedly plateaus on substrates with moduli > ~5kPa17. Thus, spreading differences alone would not reveal the complexity of biochemical processes controlling cell behavior on these substrates.
Postulated mechanisms of rigidity sensing have invoked both strain rates and molecular displacements linked to substrate deformation. Quantized micropillar displacements by attached cells appear to be due to tropomyosin-dependent, rigidity-sensing units that operate during the contractile spreading phase34. Our results are consistent with a model based on postulated stiffness-dependent strain rates17. Although differing strain rates have yet to be verified experimentally, displacement differences alone would not account for the observed destabilized integrin-ligand bonds on soft substrata. Although the use of TGTs alone cannot unambiguously distinguish between mechanisms, these results generated novel insights into mechanically sensitive processes in cell adhesion and spreading.
This study demonstrated the impact of rigidity sensing on both the spreading area and attached cell densities, which reflect coordinated influences of substrate stiffness and receptor biochemistry. Second, we estimated the force thresholds for postulated spreading transitions, and demonstrated quantitatively that the ECM stiffness shifts those thresholds and cell attachment behavior. Third, cell behavior on 12pN tethers revealed an early, low-tension transition that we attribute to actin clutch engagement. In conclusion, these findings, based on autonomously-force-limiting TGTs, exposed novel insights into nano-mechanical coupling between substrate mechanics and integrin-mediated cell adhesion, spreading, and rigidity-sensing.
Supplementary Material
Acknowledgments
NIH 5 RO1 GM097443 (DEL) and NSF 14-30124 (DEL), NIH R01 DK099528 (BACH), NSF 14-30124 (TJH), NIH 1R25 CA154015A (ZR).
Footnotes
Electronic Supplementary Information (ESI) available: [Materials and Methods, Supplementary Figures]. See DOI: 10.1039/x0xx00000x
ASSOCIATED CONTENT
Supporting Information
Materials and Methods, Supplementary Figures., This material is available free of charge via the Internet at http://pubs.acs.org.
Author Contributions
Z.R. and S.P did experiments, analyzed data, and wrote the manuscript. B.H. analyzed data and reviewed the manuscript. D.E.L. analyzed data, wrote and reviewed the manuscript
The authors declare no competing financial interests.
REFERENCES
- 1.Balaban NQ, Schwarz US, Riveline D, Goichberg P, Tzur G, Sabanay I, Mahalu D, Safran S, Bershadsky A, Addadi L, Geiger B. Nat Cell Biol. 2001;3:466–472. doi: 10.1038/35074532. [DOI] [PubMed] [Google Scholar]
- 2.Riveline D, Zamir E, Balaban NQ, Schwarz US, Ishizaki T, Narumiya S, Kam Z, Geiger B, Bershadsky AD. J Cell Biol. 2001;153:1175–1186. doi: 10.1083/jcb.153.6.1175. [DOI] [PMC free article] [PubMed] [Google Scholar]
- 3.Bershadsky AD, Balaban NQ, Geiger B. Annu Rev Cell Dev Biol. 2003;19:677–695. doi: 10.1146/annurev.cellbio.19.111301.153011. [DOI] [PubMed] [Google Scholar]
- 4.Geiger B, Spatz JP, Bershadsky AD. Nature reviews. 2009;10:21–33. doi: 10.1038/nrm2593. [DOI] [PubMed] [Google Scholar]
- 5.Gauthier NC, Fardin MA, Roca-Cusachs P, Sheetz MP. Proc Natl Acad Sci U S A. 2011;108:14467–14472. doi: 10.1073/pnas.1105845108. [DOI] [PMC free article] [PubMed] [Google Scholar]
- 6.Rossier OM, Gauthier N, Biais N, Vonnegut W, Fardin MA, Avigan P, Heller ER, Mathur A, Ghassemi S, Koeckert MS, Hone JC, Sheetz MP. EMBO J. 2010;29:1055–1068. doi: 10.1038/emboj.2010.2. [DOI] [PMC free article] [PubMed] [Google Scholar]
- 7.Wolfenson H, Iskratsch T, Sheetz MP. Biophys J. 2014;107:2508–2514. doi: 10.1016/j.bpj.2014.10.041. [DOI] [PMC free article] [PubMed] [Google Scholar]
- 8.Cavalcanti-Adam EA, Micoulet A, Blummel J, Auernheimer J, Kessler H, Spatz JP. Eur J Cell Biol. 2006;85:219–224. doi: 10.1016/j.ejcb.2005.09.011. [DOI] [PubMed] [Google Scholar]
- 9.Du J, Chen X, Liang X, Zhang G, Xu J, He L, Zhan Q, Feng XQ, Chien S, Yang C. Proc Natl Acad Sci U S A. 2011;108:9466–9471. doi: 10.1073/pnas.1106467108. [DOI] [PMC free article] [PubMed] [Google Scholar]
- 10.Engler AJ, Sen S, Sweeney HL, Discher DE. Cell. 2006;126:677–689. doi: 10.1016/j.cell.2006.06.044. [DOI] [PubMed] [Google Scholar]
- 11.DuFort CC, Paszek MJ, Weaver VM. Nat Rev Mol Cell Biol. 2011;12:308–319. doi: 10.1038/nrm3112. [DOI] [PMC free article] [PubMed] [Google Scholar]
- 12.Lu P, Weaver VM, Werb Z. J Cell Biol. 2012;196:395–406. doi: 10.1083/jcb.201102147. [DOI] [PMC free article] [PubMed] [Google Scholar]
- 13.Butcher DT, Alliston T, Weaver VM. Nat Rev Cancer. 2009;9:108–122. doi: 10.1038/nrc2544. [DOI] [PMC free article] [PubMed] [Google Scholar]
- 14.Friedland JC, Lee MH, Boettiger D. Science. 2009;323:642–644. doi: 10.1126/science.1168441. [DOI] [PubMed] [Google Scholar]
- 15.Vogel V, Sheetz M. Nat Rev Mol Cell Biol. 2006;7:265–275. doi: 10.1038/nrm1890. [DOI] [PubMed] [Google Scholar]
- 16.Takagi J, Springer TA. Immunol Rev. 2002;186:141–163. doi: 10.1034/j.1600-065x.2002.18613.x. [DOI] [PubMed] [Google Scholar]
- 17.Elosegui-Artola A, Oria R, Chen Y, Kosmalska A, Perez-Gonzalez C, Castro N, Zhu C, Trepat X, Roca-Cusachs P. Nat Cell Biol. 2016;18:540–548. doi: 10.1038/ncb3336. [DOI] [PubMed] [Google Scholar]
- 18.Schwarz US, Gardel ML. J Cell Sci. 2012;125:3051–3060. doi: 10.1242/jcs.093716. [DOI] [PMC free article] [PubMed] [Google Scholar]
- 19.Galbraith CG, Yamada KM, Sheetz MP. J Cell Biol. 2002;159:695–705. doi: 10.1083/jcb.200204153. [DOI] [PMC free article] [PubMed] [Google Scholar]
- 20.Borghi N, Sorokina M, Shcherbakova OG, Weis WI, Pruitt BL, Nelson WJ, Dunn AR. Proc Natl Acad Sci U S A. 2012;109:12568–12573. doi: 10.1073/pnas.1204390109. [DOI] [PMC free article] [PubMed] [Google Scholar]
- 21.Morimatsu M, Mekhdjian AH, Adhikari AS, Dunn AR. Nano letters. 2013;13:3985–3989. doi: 10.1021/nl4005145. [DOI] [PMC free article] [PubMed] [Google Scholar]
- 22.Kim TJ, Zheng S, Sun J, Muhamed I, Wu J, Lei L, Kong X, Leckband DE, Wang Y. Curr Biol. 2015;25:218–224. doi: 10.1016/j.cub.2014.11.017. [DOI] [PMC free article] [PubMed] [Google Scholar]
- 23.Grashoff C, Hoffman BD, Brenner MD, Zhou R, Parsons M, Yang MT, McLean MA, Sligar SG, Chen CS, Ha T, Schwartz MA. Nature. 2010;466:263–266. doi: 10.1038/nature09198. [DOI] [PMC free article] [PubMed] [Google Scholar]
- 24.Stabley DR, Jurchenko C, Marshall SS, Salaita KS. Nat Methods. 2012;9:64–67. doi: 10.1038/nmeth.1747. [DOI] [PubMed] [Google Scholar]
- 25.Wang X, Ha T. Science. 2013;340:991–994. doi: 10.1126/science.1231041. [DOI] [PMC free article] [PubMed] [Google Scholar]
- 26.Franz CM, Taubenberger A, Puech PH, Muller DJ. Sci STKE. 2007;2007:pl5. doi: 10.1126/stke.4062007pl5. [DOI] [PubMed] [Google Scholar]
- 27.Lakowicz J. Principles of Fluorescence Spectroscopy. 3rd. Plenum; 2006. [Google Scholar]
- 28.Roca-Cusachs P, Gauthier NC, Del Rio A, Sheetz MP. Proc Natl Acad Sci U S A. 2009;106:16245–16250. doi: 10.1073/pnas.0902818106. [DOI] [PMC free article] [PubMed] [Google Scholar]
- 29.Ezzell RM, Goldmann WH, Wang N, Parasharama N, Ingber DE. Exp Cell Res. 1997;231:14–26. doi: 10.1006/excr.1996.3451. [DOI] [PubMed] [Google Scholar]
- 30.Choi CK, Vicente-Manzanares M, Zareno J, Whitmore LA, Mogilner A, Horwitz AR. Nat Cell Biol. 2008;10:1039–1050. doi: 10.1038/ncb1763. [DOI] [PMC free article] [PubMed] [Google Scholar]
- 31.Jiang G, Huang AH, Cai Y, Tanase M, Sheetz MP. Biophys J. 2006;90:1804–1809. doi: 10.1529/biophysj.105.072462. [DOI] [PMC free article] [PubMed] [Google Scholar]
- 32.Galior K, Liu Y, Yehl K, Vivek S, Salaita K. Nano letters. 2015 doi: 10.1021/acs.nanolett.5b03888. [DOI] [PMC free article] [PubMed] [Google Scholar]
- 33.Chowdhury F, Li IT, Leslie BJ, Doganay S, Singh R, Wang X, Seong J, Lee SH, Park S, Wang N, Ha T. Integrative biology : quantitative biosciences from nano to macro. 2015;7:1265–1271. doi: 10.1039/c5ib00080g. [DOI] [PMC free article] [PubMed] [Google Scholar]
- 34.Wolfenson H, Meacci G, Liu S, Stachowiak MR, Iskratsch T, Ghassemi S, Roca-Cusachs P, O'Shaughnessy B, Hone J, Sheetz MP. Nat Cell Biol. 2015 doi: 10.1038/ncb3277. [DOI] [PMC free article] [PubMed] [Google Scholar]
Associated Data
This section collects any data citations, data availability statements, or supplementary materials included in this article.


