Abstract
Lack of regulation of the eIF4E/eIF4G interaction is a hallmark of cancer. 4EGI-1 binds to eIF4E preventing association to eIF4G via an allosteric mechanism. We use NMR spectroscopy and MD simulations to obtain a mechanistic description of the role of correlated dynamics in this allosteric regulation. We show that binding of 4EGI-1 perturbs native correlated motions and increases correlated fluctuations in part of the eIF4G binding site.
Keywords: Allosterism, NMR spectroscopy, Molecular dynamics, Protein-protein interactions, Inhibitors
Eukaryotic translation initiation factor 4F (eIF4F), the complex of the cap-binding subunit eIF4E, the scaffolding protein eIF4G and the RNA helicase eIF4A, is required for capdependent translation[1]. eIF4E is the least abundant component and therefore the eIF4E/eIF4G interaction determines the level of eIF4F[2].
The eIF4E-binding proteins (4E-BPs) regulate the eIF4E/eIF4G interaction by binding to the same site as eIF4G using the same consensus motif[3]. 4E-BPs act as tumor suppressors[4,5], whereas loss of 4E-BP expression[5,6] and its hyper-phosphorylation[7–12] are correlated with tumorigenesis and cancer growth. Thus a promising strategy for cancer treatment is to develop molecules that mimic 4E-BP activity. Our group has identified an inhibitor, eIF4E/eIF4G interaction inhibitor 1 (4EGI-1), which is a promising drug candidate because it not only displaces eIF4G but also enhances the 4E-BP1/eIF4E association[13,14]. 4EGI-1 inhibits cap-dependent translation and exhibits activity against cancer cell lines and in mouse xenografts[15,16].
4EGI-1 binds to a pocket distal to the eIF4G-binding site, between β2 and α1[17]. The crystal structure suggests two conformations of the binding site. With 0.6 occupancy, binding triggers a structural rearrangement in the H78-L85 region, unfolding a 310-helix and forming an additional turn (H78-S82) in α1, a conformation not seen previously in any eIF4E structure. However, with 0.4 weight, the inhibitor does not cause this structural rearrangement[17]. These findings indicate that 4EGI-1 acts on eIF4E through allosteric regulation by stabilizing conformers that disfavor eIF4G binding. Recently, we showed that 4E-BP1 binds to the eIF4E conformation with the short α-helix1 but allows 4EGI-1 binding as well[14], supporting an inhibitor-induced population shift.
While the mechanism of the allosteric process is unclear, a predominant role of dynamics is suggested by the fact that 4EGI-1 binds to two different conformations and the eIF4G binding site is structurally unperturbed by inhibitor binding[17].
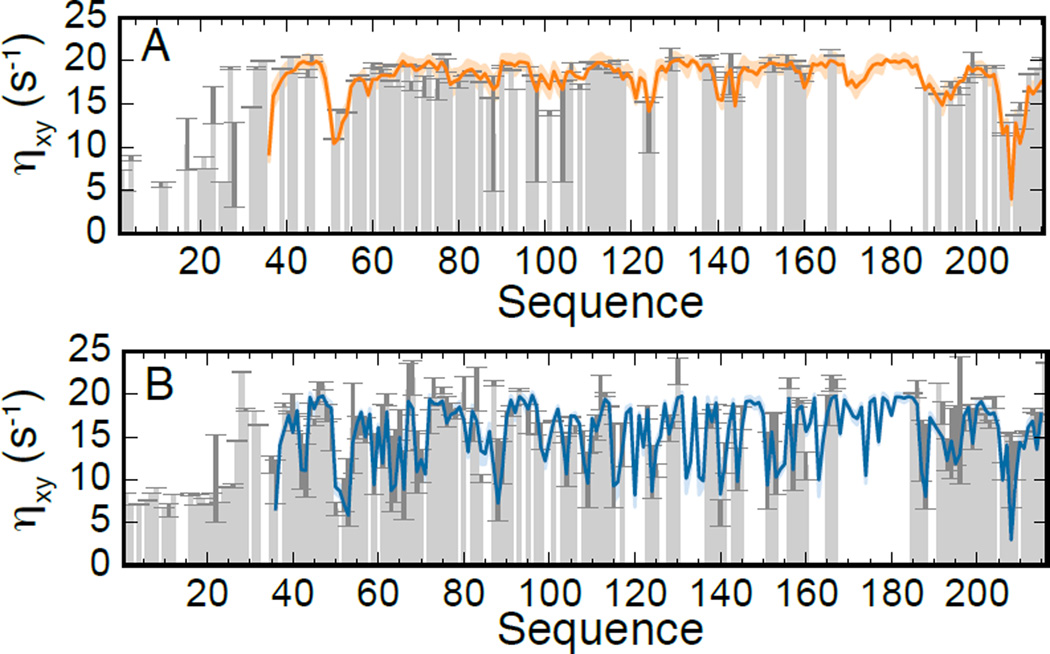
In the present work we use Nuclear Magnetic Resonance (NMR) relaxation data (15N R1 and R2 rates and heteronuclear nOe ratios at 900 MHz in Fig. S4 and CSA/DD cross-correlated transverse cross-relaxation rates at 750 MHz in Fig. 1) in combination with Molecular Dynamics (MD) simulations to describe the population shift occurring upon binding and to understand how changes in dynamics drive the allosteric modulation of the eIF4E/eIF4G interaction.
Figure 1.
CSA/DD cross-correlated cross-relaxation transverse rates (ηxy). Experimental values (grey bars) for the GB1-eIF4E construct before (panel A) and after (panel B) adding 4EGI-1 (200 µM, corresponding to 2× the protein concentration) are reproduced by linear combinations of the values derived from simulations 1 and 2 as described in the text. Pearson correlation coefficient and p-value are 0.80 and 3.44·10−21, and 0.89 and 9.02·10−40 for panel A and B, respectively. Only data on the eI4E chain are shown.
A single set of resonances for all assigned backbone amide peaks in eIF4E is observed[17]. Thus, there is no evidence for slow conformational exchange. There is also no indication for exchange on a µs-ms time scales because the characteristic line broadening due to conformational dynamics occurring on these time scales (Fig. S1) is not detected.
In order to investigate the population equilibrium present in solution, we performed a series of MD simulations. Simulation 1 comprised three 100-ns trajectories at 5 °C. Trajectory A is calculated starting from the eIF4E chain not bound to 4EGI-1 in PDB 4TPW (“free-like” conformation). Trajectories B and C are started from conformations of eIF4E extracted from trajectory A after 50 and 100 ns, with randomly distributed atomic velocities. Similarly, simulation 2 contains three 100-ns trajectories started from the eIF4E chain bound to 4EGI-1 in PDB 4TPW (“bound-like” conformation) and from frames extracted from the former trajectory after 50 and 100 ns. Finally, simulations 1_25C and 2_25C comprise one 100-ns trajectory each, calculated at 25 °C and started from the two chains in PDB 4TPW (see Experimental Procedures in SI).
Due to the lack of optimized force fields for the N7-methylated nucleotide and for 4EGI-1, ligands were removed from the PDB structure and simulations performed using the peptide chains only. As shown in Fig. S3, in analyzing our trajectories we exclude all residues > 180 to eliminate possible errors induced by this simplification of the system (the values corresponding to those residues are nevertheless shown for the sake of completeness).
In all our simulations we do not observe any transition between free-like and bound-like conformations, suggesting that this interconversion occurs on timescales longer than the rotational correlation time τc. Thus, any observed NMR relaxation rate is given by Robs = xfreeRfree + (1 − xfree)Rbound, in which Robs is the measured relaxation rate (R1, R2, nOe or ηxy), Rfree and Rbound the corresponding relaxation rates of the two conformers, and xfree the molar fraction of the free-like conformation. Assuming that good approximations to Rfree and Rbound are calculated from simulation 1 and 2, respectively, a fit to experimental data can be used to estimate xfree and τc.
Using this fit procedure, we obtained xfree = 0.90 ± 0.07 and τc = (17.6 ± 0.5) ns. The latter value is in agreement with the result of the TRACT procedure[17]. In order to validate our results, we applied the same procedure to 13C chemical shifts: SCSobs = xfreeSCSfree + (1 − xfree)SCSbound, in which SCSobs is the measured secondary chemical shift for 13Cα, 13Cβ or 13C’ spins, and SCSfree and SCSbound the corresponding quantities for the free- and bound-like conformers. If approximations to SCSfree and SCSbound are calculated from simulations 1_25C and 2_25C, we find xfree = 0.88 ± 0.02, in agreement with the relaxation-based calculation (Fig. S5). Experimental data and MD trajectories used in the validation step were not used in the first fit. Importantly, the values of xfree determined at 5 and 25 °C are not significantly different, suggesting that the equilibrium between conformations is essentially temperature-independent over our range of temperature.
The stability of the protein sample is very limited when 4EGI-1 is added. In this case, we were able to measure only CSA/DD cross-correlated transverse cross-relaxation rates at 750 MHz (Fig. 1B) within the sample lifetime (< 24 hours).
The comparison of the experimental data in Fig. 1 shows that 4EGI-1 increases the flexibility of eIF4E throughout its sequence, and particularly in regions adjacent to the 4EGI-1 binding site: the loop between β1 and β2, part of helix α1 and the loop between the extended α1 and β3. Using the same fit procedure as above, we obtained τc = (17.0 ± 0.2) ns, in agreement with the value determined from the first set of relaxation data, and xfree = 0.42 ± 0.02. Our attempts to measure accurate secondary 13C chemical shifts in the presence of 4EGI-1 were not successful because of the presence of DMSO used to dissolve the compound (Fig. S14). Thus, the calculated value of xfree has to be considered a rough estimate. Interestingly, this value is remarkably close to the occupancy in the crystal structure[14,17].
In summary, 4EGI-1 stabilizes the bound-like conformation, increasing its population to around 60%. Our model and the absence of Rex contributions suggest that 4EGI-1 affects mostly sub-τc dynamics. Thus, we can describe its allosteric effects by characterizing the difference in dynamics between simulations 1 and 2.
We assessed the extent of correlated fluctuations by examining the magnitude of pairwise cross-correlation coefficients cij of Cα atoms. cij can vary from 1 (completely correlated) to −1 (completely anticorrelated motions)[18,19].
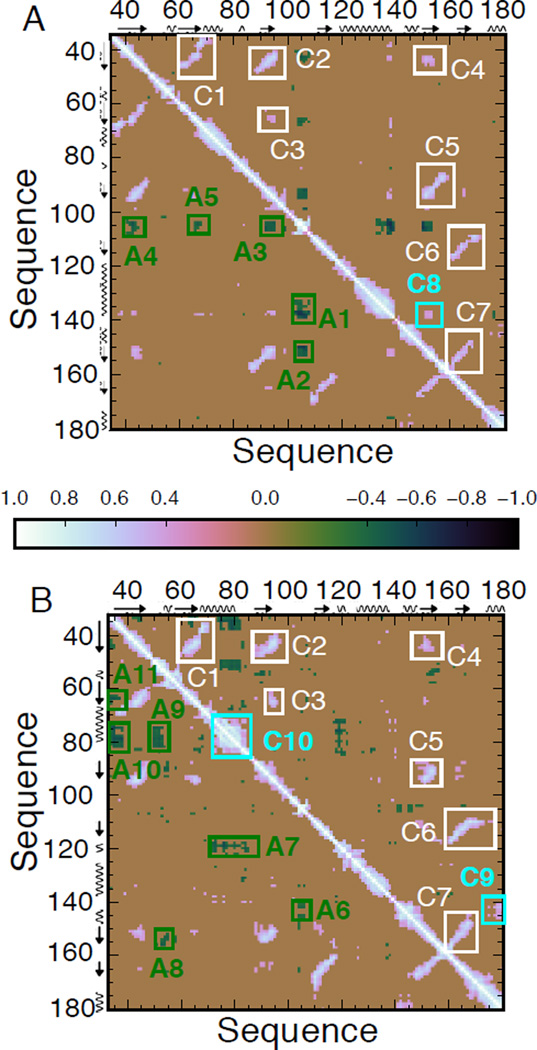
In simulation 1 fluctuations in the β-sheet are strongly correlated from β1 to β6 (C1–C7 in Figures 2A and S6, β7 is in the part of the protein that is excluded from the analysis), in line with recent work suggesting that correlation is a fundamental property of β-sheets[20]. An additional correlation (C8) is found between β5 and the C-terminal part of α2, next to the eIF4G binding site. The loop bearing W102, which binds to the cap, is anticorrelated to several β-strands (A2, A3 and A4), to the N-terminal part of α1 (A5) and, importantly, to the binding site of eIF4G, both directly (A1) and via the β-sheet (C8+A2).
Figure 2.
Dynamical Cross-Correlation Matrix (DCCM) of Cα atoms of residues 35–180 in simulation 1 (A) and 33–180 in simulation 2 (B). We identify 7 correlations between structural elements, marked in white, that are conserved in the two simulations. Other correlations (cyan label) and anticorrelations (green) are found only in one simulation. Cartoon representations of the correlations are given in Fig. S6.
Our results are in agreement with the allosteric pathway connecting W102 to the eIF4G binding site described by Siddiqui et al[21].
Correlations in the β-sheet (C1–C7) are still found in simulation 2 (Figures 2B and S6). However, the C-terminus of α2 is now correlated with α3 (C9) and larger correlations are also detected within the extended α1 (C10). While the W102 loop is anticorrelated only with the 3/10 helix around 145 (A6), anticorrelations are found between the N-terminus and β2 (A11) and α1 (A10). Strong anticorrelations involve elements participating in the structural rearrangements due to 4EGI-1: α1 and the 3/10 helix around 120 (A7); the loop between β1 and β2 and β5 (A8) and α1 (A9). One would expect these couplings to be even stronger if 4EGI-1 was included in the simulation.
In summary, the native network of correlations is fundamentally altered in the bound-like conformation. Couplings of the eIF4G binding site with the cap-binding site are dissolved, whereas new correlations involving α1 (but not α2) emerge. We explored the effect of these correlated motions in a Principal Component Analysis (PCA) of the fluctuations of the cartesian coordinates of Cα atoms. 4 and 6 eigenmodes were retained for simulations 1 and 2 respectively on the basis of the scree plot in Fig. S7.
The 4 modes of simulation 1 involve mostly the loops of the cap-binding site (Fig. S8), residues between α1 and β3, including the 3/10 helix, and in the β4-α2 loop (Fig. S10). α1 and α2 participate to a much smaller extent. The modes involve a similar set of residues as the A1–5 anticorrelations, but the role of helices and β-strands is much more evident in DCCMs, which are normalized by the fluctuation amplitude.
Similar to the NMR data in Fig. 1, Figures S9 and S11 show that the fluctuations are spread across the sequence in simulation 2. Interestingly, dynamics is found for those residues whose side chains were shown to be affected by 4EGI-1 binding[17]. The N-terminal part of α3 as well as the β5-β6 loop are involved in motions. Most of the residues contributing to the correlated dynamics in Fig. 2, particularly C9–10 and A6–11, contribute also to the modes in Fig. S11.
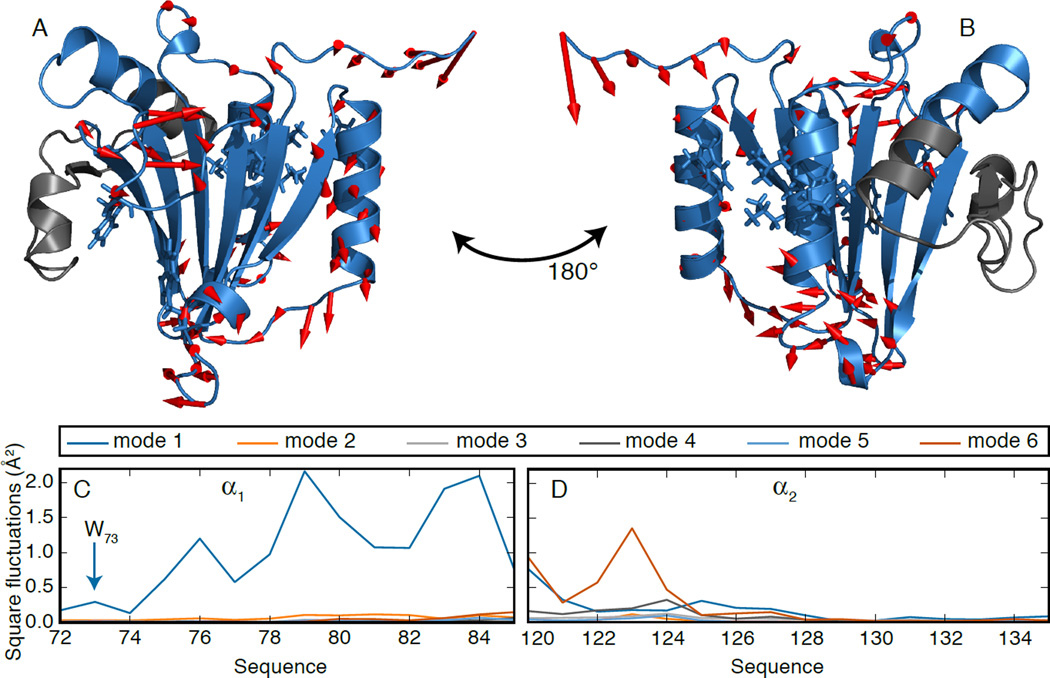
A close look at mode 1 (Fig. 3A–B) shows the role of α1. In fact, similar to A7, A9 and A10 above, the N-terminus and the β1-β2 and β4-α2 loops are anticorrelated with its C-terminal end. The loop bearing W102 also contributes to this mode. Crucially, these motions are transferred to the binding site by correlations within α1 (C10). In fact, fluctuations in α1 are larger in simulation 2 (Fig. 3C) than 1 (Fig. S8), mostly in the C-terminal end, but significantly also for W73 and F72. On the other hand, Fig 3D confirms that motions in the flexible N-terminal end of α2 are hardly transferred to the binding site, which remains rigid.
Figure 3.
(A–B) First PC in simulation 2. The part of the protein not included in the analysis is colored in grey. (C–D) Square fluctuations in α1 (C) and α2 (D) due to the first six modes in simulation 2.
The projection of simulations 1_25C and 2_25C onto the PC space (Fig. S12–S13) is very similar to that of 1 and 2, suggesting that the results of our analysis do not depend on temperature in physiologically-relevant ranges.
Concluding, similar to other proteins[22], structure-encoded dynamics underlie the binding of eIF4E to its partners. 4EGI-1 triggers structural rearrangements that increase the flexibility in α1, coupling its fluctuations to the cap- and 4EGI-1 binding sites and the N-terminus. De facto, this modulates the distance between the two parts of the eIF4G-binding site on α1 and α2, which might result in the inhibitory effect, without affecting the structure of the eIF4G binding site.
This new paradigm for the activity of 4EGI-1, developed using NMR relaxation data and MD simulations and compatible with experimental evidence accumulated over the years[13,14,17,21,23] might inspire alternative routes to the inhibition of the eIF4E/eIF4G interaction. While our work is focused on backbone dynamics, experimental and computational studies on side-chains might be a powerful way of elucidating the details of the mechanism. The pervasive role of the β3-β4 loop in all collective motions might indicate a potential effect of 4EGI-1 on the binding to the cap, a hypothesis that deserves further investigation.
Supplementary Material
Acknowledgments
N.S. acknowledges a European Molecular Biology Organization Long-Term Fellowship (ALTF 612-2013) and a Swiss National Science Foundation Early Postdoc. Mobility Fellowship (P2ELP2_148858). This research was supported by National Institutes of Health Grants PO1 GM047467 and RO1 CA68262, CEA (Commissariat à l'Energie Atomique et aux Energies Alternatives) and CNRS (Centre National de la Recherche Scientifique). MD simulations were performed using the HPC resources of CCRT available by GENCI (Grand Equipement National de Calcul Intensif, project t2015077486).
Contributor Information
Nicola Salvi, Email: nicola.salvi@ibs.fr.
Gerhard Wagner, Email: gerhard_wagner@hms.harvard.edu.
References
- 1.Silvera D, Formenti SC, Schneider RJ. Nat Rev Cancer. 2010;10:254–266. doi: 10.1038/nrc2824. [DOI] [PubMed] [Google Scholar]
- 2.Bhat M, Robichaud N, Hulea L, Sonenberg N, Pelletier J, Topisirovic I. Nat Rev Drug Discov. 2015;14:261–278. doi: 10.1038/nrd4505. [DOI] [PubMed] [Google Scholar]
- 3.Marcotrigiano J, Gingras AC, Sonenberg N, Burley SK. Mol Cell. 1999;3:707–716. doi: 10.1016/s1097-2765(01)80003-4. [DOI] [PubMed] [Google Scholar]
- 4.Martineau Y, Azar R, Bousquet C, Pyronnet S. Oncogene. 2013;32:671–677. doi: 10.1038/onc.2012.116. [DOI] [PubMed] [Google Scholar]
- 5.Petroulakis E, Parsyan A, Dowling RJO, LeBacquer O, Martineau Y, Bidinosti M, Larsson O, Alain T, Rong L, Mamane Y, et al. Cancer Cell. 2009;16:439–446. doi: 10.1016/j.ccr.2009.09.025. [DOI] [PubMed] [Google Scholar]
- 6.Dowling RJO, Topisirovic I, Alain T, Bidinosti M, Fonseca BD, Petroulakis E, Wang X, Larsson O, Selvaraj A, Liu Y, et al. Science. 2010;328:1172–1176. doi: 10.1126/science.1187532. [DOI] [PMC free article] [PubMed] [Google Scholar]
- 7.Barnhart BC, Simon MC. J. Clin. Invest. 2007;117:2385–2388. doi: 10.1172/JCI33107. [DOI] [PMC free article] [PubMed] [Google Scholar]
- 8.Dumstorf CA, Konicek BW, McNulty AM, Parsons SH, Furic L, Sonenberg N, Graff JR. Mol. Cancer Ther. 2010;9:3158–3163. doi: 10.1158/1535-7163.MCT-10-0413. [DOI] [PubMed] [Google Scholar]
- 9.Korets SB, Czok S, Blank SV, Curtin JP, Schneider RJ. Clin. Cancer Res. 2011;17:7518–7528. doi: 10.1158/1078-0432.CCR-11-1664. [DOI] [PubMed] [Google Scholar]
- 10.Furic L, Rong L, Larsson O, Koumakpayi IH, Yoshida K, Brueschke A, Petroulakis E, Robichaud N, Pollak M, Gaboury LA, et al. Proc Natl Acad Sci USA. 2010;107:14134–14139. doi: 10.1073/pnas.1005320107. [DOI] [PMC free article] [PubMed] [Google Scholar]
- 11.Armengol G, Rojo F, Castellví J, Iglesias C, Cuatrecasas M, Pons B, Baselga J, Ramón y Cajal S. Cancer Res. 2007;67:7551–7555. doi: 10.1158/0008-5472.CAN-07-0881. [DOI] [PubMed] [Google Scholar]
- 12.Graff JR, Konicek BW, Lynch RL, Dumstorf CA, Dowless MS, McNulty AM, Parsons SH, Brail LH, Colligan BM, Koop JW, et al. Cancer Res. 2009;69:3866–3873. doi: 10.1158/0008-5472.CAN-08-3472. [DOI] [PubMed] [Google Scholar]
- 13.Moerke NJ, Aktas H, Chen H, Cantel S, Reibarkh MY, Fahmy A, Gross JD, Degterev A, Yuan J, Chorev M, et al. Cell. 2007;128:257–267. doi: 10.1016/j.cell.2006.11.046. [DOI] [PubMed] [Google Scholar]
- 14.Sekiyama N, Arthanari H, Papadopoulos E, Rodriguez-Mias RA, Wagner G, Léger-Abraham M. Proc Natl Acad Sci USA. 2015;112:E4036–E4045. doi: 10.1073/pnas.1512118112. [DOI] [PMC free article] [PubMed] [Google Scholar]
- 15.Yi T, Kabha E, Papadopoulos E, Wagner G. Oncotarget. 2014;5:6028–6037. doi: 10.18632/oncotarget.2112. [DOI] [PMC free article] [PubMed] [Google Scholar]
- 16.Chen L, Aktas BH, Wang Y, He X, Sahoo R, Zhang N, Denoyelle S, Kabha E, Yang H, Freedman RY, et al. Oncotarget. 2012;3:869–881. doi: 10.18632/oncotarget.598. [DOI] [PMC free article] [PubMed] [Google Scholar]
- 17.Papadopoulos E, Jenni S, Kabha E, Takrouri KJ, Yi T, Salvi N, Luna RE, Gavathiotis E, Mahalingam P, Arthanari H, et al. Proc Natl Acad Sci USA. 2014;111:E3187–E3195. doi: 10.1073/pnas.1410250111. [DOI] [PMC free article] [PubMed] [Google Scholar]
- 18.McCammon JA, Harvey SC. Dynamics of Proteins and Nucleic Acids. Cambridge University Press; 1988. [Google Scholar]
- 19.Lange OF, Grubmüller H. Proteins. 2006;62:1053–1061. doi: 10.1002/prot.20784. [DOI] [PubMed] [Google Scholar]
- 20.Bouvignies G, Bernado P, Meier S, Cho K, Grzesiek S, Bruschweiler R, Blackledge M. Proc Natl Acad Sci USA. 2005;102:13885–13890. doi: 10.1073/pnas.0505129102. [DOI] [PMC free article] [PubMed] [Google Scholar]
- 21.Siddiqui N, Tempel W, Nedyalkova L, Volpon L, Wernimont AK, Osborne MJ, Park H-W, Borden KLB. J Mol Biol. 2012;415:781–792. doi: 10.1016/j.jmb.2011.12.002. [DOI] [PMC free article] [PubMed] [Google Scholar]
- 22.Henzler-Wildman K, Kern D. Nature. 2007;450:964–972. doi: 10.1038/nature06522. [DOI] [PubMed] [Google Scholar]
- 23.Peter D, Igreja C, Weber R, Wohlbold L, Weiler C, Ebertsch L, Weichenrieder O, Izaurralde E. Mol Cell. 2015;57:1074–1087. doi: 10.1016/j.molcel.2015.01.017. [DOI] [PubMed] [Google Scholar]
Associated Data
This section collects any data citations, data availability statements, or supplementary materials included in this article.


