Abstract
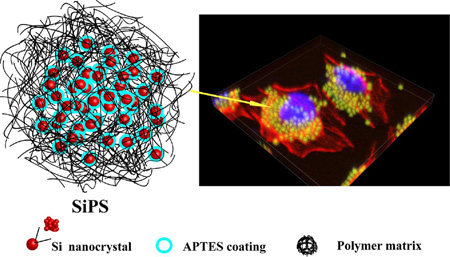
A facile, one-step method was developed for in situ forming fluorescent silicon nanocrystals (SiNC) in microspherical encapsulating matrix. The obtained SiNC encapsulated polymeric microcapsules (SiPM) possess uniform size (0.1–2.0 µm), strong fluorescence, and nanoporous structure. A unique two stage, time dependent reaction was developed, as the growth of SiNC was slower than the formation of polymeric microcapsules. The resulting SiPM with increasing reaction time exhibited two levels of stability, and in correspondence, the release of SiNC in aqueous media showed different behaviors. With reaction time < 1 h, the obtained low-density SiPM (LD-SiPM) as matrix microcapsules, would release encapsulated SiNC on demand. With >1 h reaction time, resulting high-density SiPM (HD-SiPM) became stable SiNC reservoirs. SiPM exhibits stable photoluminescence. The porous structure and fluorescence quenching effects make SiPM suitable for bioimaging, drug loading and sorption of heavy metals (Hg2+ as shown) with intrinsic indicator. SiPM was able to reduce metal ions, forming SiPM/Metal oxide and SiPM/Metal hybrids, and their application in bio-sensing and catalysis were also demonstrated.
Graphical Abstract
Introduction
Silicon-derived nanostructures (SiNC,1 nanowires,2 and porous silicon,3 etc.) have demonstrated excellent potential in the applications of photonics,4–6 electronics7–10 and biotechnology11, 12 owing to their unique photonic properties,13 biocompatibility, readily available surface chemistry14 and biodegradability.15 Recently, SiNC have attracted particularly research interests for their unique luminescence properties as result of quantum confinement effect.11 Compared to traditional fluorescence dyes and quantum dots, SiNC show better biocompatibility and fluorescence stability while eliminating toxic heavy metals contained in conventional quantum dots, which makes SiNC promising for both in vitro and in vivo long-term bioimaging.16 Various methods have been developed to produce SiNC, including reducing inverse micelle method,17 Zintl salts in inert organic solvents,18 reduction of silane precursors by sodium metal,19 laser pyrolysis of silane and plasma synthesis.20 Surface modification strategies were also studied to tailor SiNC’s hydrophobicity and surface charge to enrich functionalities and extend biomedical applications.1 A few recent studies reported one-pot synthesis of amino modified SiNC by directly reducing aminosilanes.15, 21
However, current applications of SiNC are quite limited. This is partially due to the constraints on size range of SiNC that can emit fluorescence. To achieve quantum confinement effect, the SiNC size has to be in a narrow range near Si excitation Bohr radius.11, 22–24 Separation of small SiNC usually relies on costly dialysis process or ultrafiltration centrifugal devices.25
Recent researches attempted to overcome these issues by cross-linkling SiNC into bigger nanoparticles,26 or assemble existing SiNC inside larger structures, such as mesoporous organosilica27 and polymers.28, 29 These hybrids integrated the properties of SiNC and matrix to achieve synergistic effects, thus could greatly extend their potential in areas such as fluorescence probe, optics, photonics, catalyst and energy.30 In addition, the supporting matrix also may form excellent SiNC storage to maintain robust photostability under harsh conditions.31 However, due to the complexity of current procedures used for assembling SiNC hybrids, very few studies have been reported, and the application of SiNC has been limited to imaging. A simple method to synthesize SiNC containing microcapsules that may release SiNC on demand is desired to extpand the field of SiNC applications.
Here, for the first time, we reported a single-step, highly efficient approach to simultaneously synthesize fluorescent SiNC contained in polymeric microcapsules by controlling the reaction of aminosilane and L-ascorbic acid (L-AA). The reaction was carried out in alcohols at room temperature. While the resulting SiPM exhibit the typical fluorescence of SiNC, their sphere size (0.1 – 2.0 µm), fluorescence intensity, porous structure and stability are tunable by controlling the reaction condition. Matrix microcapsules that will release SiNC in biological media can be synthesized. Taking the advantage of integrated properties of SiNC and porous structure of SiPM, we are able to develop a versatile platform for imaging, biosensing, catalysis, and removal of heavy metal contamination. The nanoporous structure and abundant amine groups make SiPM suitable in sorption of heavy metals (Hg2+), and the fluorescence intensity of SiNC inside can be used as a probe to monitor the amounts of heavy metals (Hg2+) in SiPM. We also demonstrate that porous SiPM can reduce metal ions, forming SiPM/Metal oxide (SiPM/MnO2) and SiPM/Metal composites (for example, SiPM/Au and SiPM/Pt), which show potential in bio-sensing and catalysis.
Results and discussion
Synthesis and characterization of SiPM
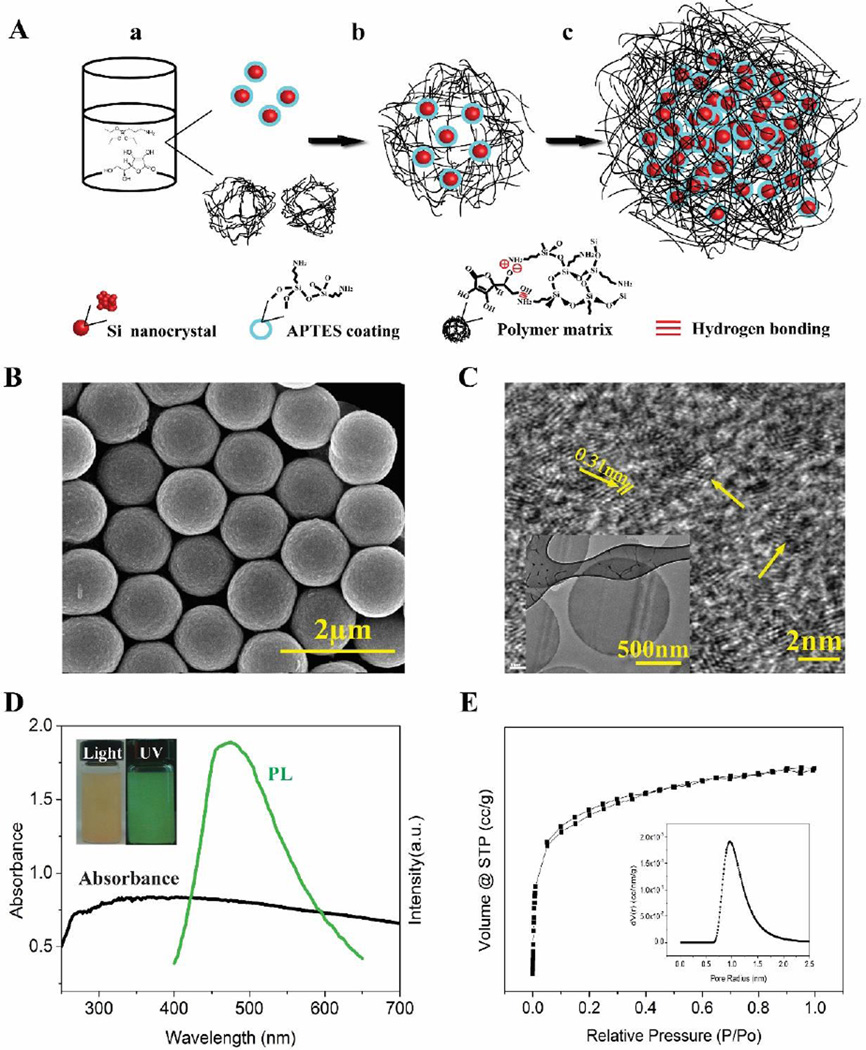
SiPM were synthesized by controlling the reaction of aminosilanes with L-AA. A proposed scheme of SiPM synthesis is illustrated in Fig. 1A. In a typical preparation, (3-aminopropyl)-trimethoxysilane (APTES) and L-AA (molar ratio [APTES]: [L-AA] ≈3:1) were used as starting materials to synthesize SiNC and polymer matrices. The reaction was carried out in isopropanol (IPA) containing a small portion (~5 %) of water, which was essential for modulating the hydrolysis of APTES. A part of the APTES was hydrolyzed and condensed to form siloxane-like polymer,32–35 as illustrated in Supporting Information (SI) Equation 1, while another part of the APTES was reduced by L-AA to yield SiNC.36 L-AA attached on the siloxane-like polymer mainly by non-covalent bonding (electrostatic adherence, etc) or hydrogen bond, which accelerated the formation of polymeric matrices. As the matrices condensed further, APTES, L-AA, and SiNC crosslinked into a larger spherical structure, which became a porous scaffold for further in-situ growth of more SiNC. After this reaction, the SiPM were separated through centrifugation, and washed with IPA three times followed by storing in IPA.
Fig. 1.
(A) Proposed scheme of one-step synthesis of SiPM a) AA reduce APTES to yield SiNC and hydrolyzed APTES form siloxance-like polymer matrices; b) formation of polymer matrices embedded with few SiNC; c) Spherical SiPM with more SiNC. (B) SEM image of typical synthetized SiPM (8 nm Pt/Pd sputtered). (C) TEM and HRTEM images of SiPM slices (70 nm thickness) cut with an ultramicrotome. (D) UV-vis absorbance and photoluminescence (PL) spectra of SiPM. Insets are picture of dispersed solution of SiPM with and without UV irradiation at 365 nm. (E) N2 adsorption/desorption isotherms of SiPM (24 h reaction time), inset displays Dubinin-Astakov (DA) pore-size distribution curve obtained from the adsorption branch.
Unlike reported methods for preparing SiNC that involve microwave heating,15, 37, 38 UV irradiation21 or instant laser ablation,39 our one-step synthesis method can be carried out by simply mixing starting materials in alcohols at room temperature. Obtained SiNC embedded microcapsules have uniform sizes ranging between 0.1–2.0 µm (prepared so far). The yield can reach about 60% in terms of Si content from the staring APTES. As-prepared porous SiPM are positively charged, water dispersive, highly fluorescent, biocompatible and biodegradable.
Fig. 1B–E shows typically synthesized porous SiPM, encapsulated SiNC and induced fluorescence. As shown in scanning electron microscopy (SEM, Fig. 1B) and transmission electron microscopy (TEM, Fig. 1C inset) images, SiPM appear as uniform-sized spheres (1 µm shown, <10% variation by estimation). High-resolution TEM (HRTEM, Fig. 1C and Fig. S1) images of SiPM (70 nm thin slices) show that SiNC (~2 nm in diameter) are uniformly distributed whose morphology and size are similar with results shown in previous studies, and the lattice spacing of the crystal is 0.31 nm, which matches the diamond lattice of Si (111). Elemental analyses of the SiPM (EDS, Fig. S2; XPS, Fig. S3) confirm the presence of Si, C, N and O. Both fresh SiPM and hydrolyzed SiPM are positively surface-charged (zeta potential, Fig. S4), most likely due to the presence of positively-charged amine group derived from APTES. This aminopropyl group becomes a side chain of polymer matrices after condensation. Similarly SiNC also show positive zeta potential (Fig. S4B) due to APTES surface coating. Positive charges are beneficial to keep SiPM dispersed in aqueous solutions. Fig. 1D shows absorption and photoluminescence spectra (PL) of SiPM. The broad absorption curve could be a result of light scattering of polymer matrices in SiPM. The as-prepared SiPM exhibit green fluorescence under UV irradiation. Inset shows captured photos of dispersed SiPM with and without UV irradiation at 365 nm. Fig. 1E shows N2 adsorption/desorption isotherms of SiPM (24 h reaction time), showing a microporous structure. Pore-size distribution curve (inset) is obtained from the adsorption branch through Dubinin-Astakov (DA) method.40
Formation process of SiPM
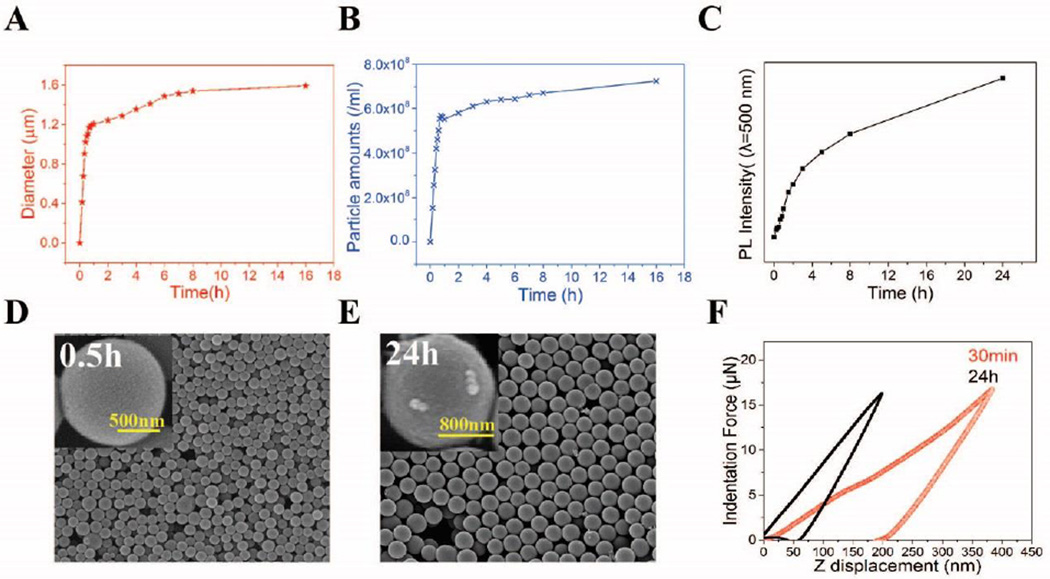
In SiPM synthesis, formation of spherical polymer matrices and SiNC can be monitored through particle analysis and fluorescence measurement, respectively. A Beckman Multisizer 4 coulter counter was used to measure the size and concentration of SiPM (0.4–12 µm detectable range with 20 µm aperture). As shown in Fig. 2A and 2B, particle analysis has revealed a unique two-stage process. SiPM properties from two stages are distinctive. In the first stage (from beginning to about 1 h), both mean sphere size and amounts (sphere >0.4 µm) increase rapidly. Then both rates drastically drop by ~40 folds (calculated by comparing the slope of curves of each stage) after 1st h (starting second stage). During the second stage, there is no obvious change of size and amounts of SiPM. This drastic drop is likely due to the significant consumption of starting materials and the existence of critical concentration. However, if we change the concentration of starting APTES and L-AA, the size and yield of final SiPM are correspondingly affected. As seen in Fig. S5, SiPM with size range 0.4~2.0 µm were successfully synthetized by varying APTES concentration. By using other aminesilanes (such as N-(2-aminoethyl)-3-(trimethoxysilyl)propylamine or 2-[2-(3-trimethoxysilylpropylamino)ethylamino]ethylamine) instead of APTES, SiPM as small as 0.1 µm had been obtained. The photoluminescence intensity of SiPM at 500 nm (excitation wavelength: 420 nm) also increased with reaction time (Fig. S6). However, unlike the trends observed for sphere size and amounts, the fluorescence intensity increased quite linearly in the first 2 h, then changed to a standard exponential curve of first-order reaction (Fig. 2C). This means SiNC formation process saturates slower than the sphere formation, since fluorescence intensity represents the quantity of encapsulated SiNC. A possible explanation is that SiNC continue to be reductively formed in pores. Even though spherical porous matrices are formed in 1 h, it takes longer for SiNC to fill the pores.
Fig. 2.
Formation process of SiPM. (A) Change of mean size, and (B) particle concentration of SiPM with reaction time. (C) The change of fluorescence intensity of SiPM at λ=500 nm (excitation wavelength: 420 nm) with reaction time. (D) SEM images of LD-SiPM (left, 30 min reaction, broader size distribution) and (E) HD-SIPM (right, 24 h). (F) The force –displacedment curves for the LD-SiPM and HD-SIPM under same indentation force.
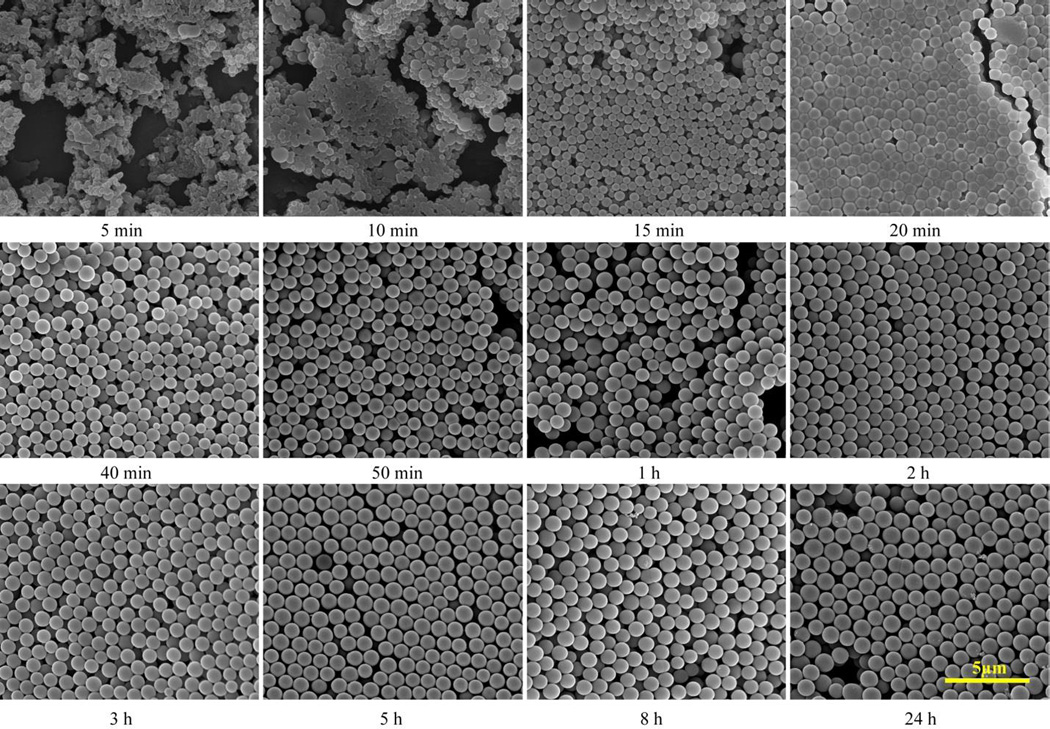
In the first stage, formation of siloxane-like polymer matrices is very fast and SiNC embedding is much slower, which results a highly-porous, low density SiPM (LD-SiPM). Then the sphere formation slows down significantly to maintain a critical size and concentration, while the SiNC continue to be formed in the polymer matrices. Finally less porous, high density SiPM (HD-SiPM) were obtained. As shown in Fig. 2D and 2E, LD-SiPM have a smooth appearance, while HD-SiPM show nano-topographic structure possibly due to clustered surface SiNC. The increase in hardness along with time is also verified via force-displacement curves (shown in Fig. 2F). Moreover, the solution color of HD-SiPM is darker than LD-SiPM (Fig. S7). The elemental composition (Table S1) also demonstrates increasing ratio of Si in HD-SiPM. All this data indicates that SiNC continue to form in second stage of the reaction with time. More detailed SEM analysis of SiPM (Fig. 3) shows that soft siloxane-like polymer matrices are formed in the first 10 min, while during next 10 min matrices are changed from aggregated state to uniformly-sized spheres, Then, the color of solution changes from ivory-white to light-yellow (without UV irradiation, shown in Fig. S8), which indicates SiNC embedding starts later than matrices formation HD- and LD- SiPM exhibit distinctive porous structure. BET analyses of LD-SiPM after 30 min of reaction time and HD-SiPM after 24 h of reaction time (Fig. S9 and Fig. 1E) show mesoporous (~2.8 nm) and microporous (~0.9 nm) structure, respectively, indicating SiNC packing associated with reduced pore size in SiPM. As physical absorption specificity is heavily determined by the porous structures, two distinctive porous SiPM may perform differently in molecular absorption, which is under investigation.
Fig. 3.
SEM imaging of SiPM evolution with reaction times (5 min-24 h). Scale bar is 5 µm for all images.
SiNC releasing from SiPM
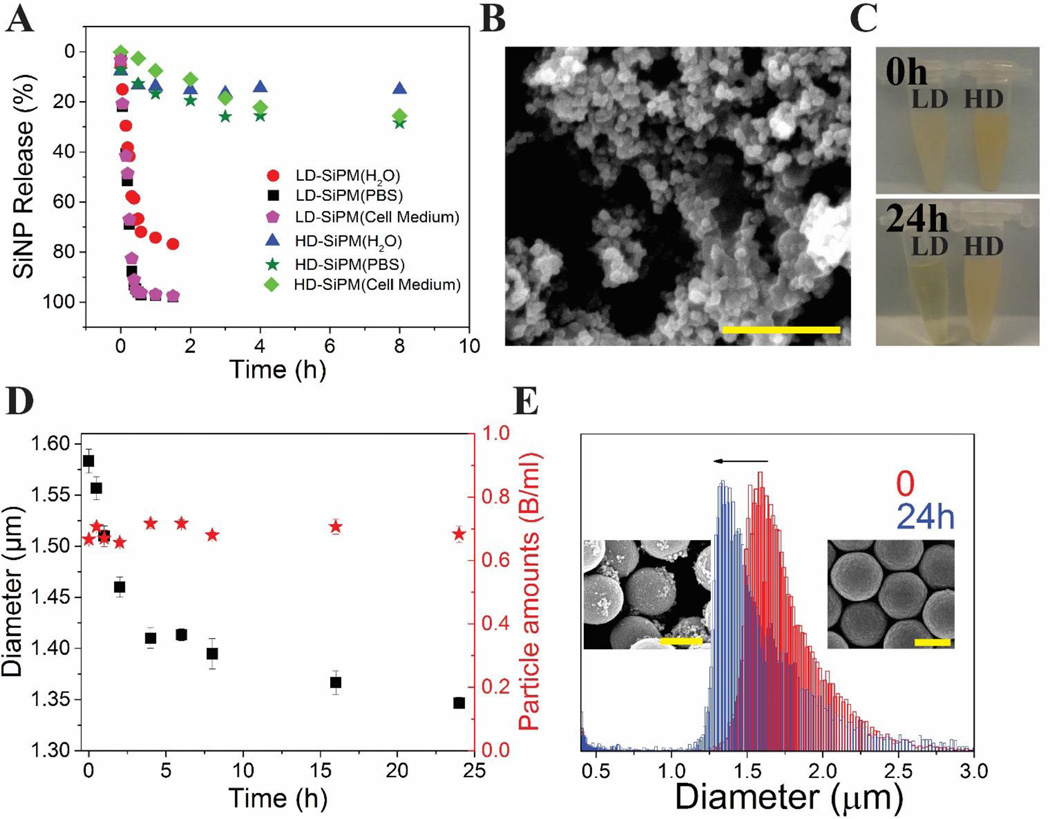
LD- and HD-SiPM are distinctive in hydrolytic degradability. The hydrolysis curves of both SiPM were calculated through measuring PL spectra of released SiNC from microcapsules in DI water and PBS, and shown in Fig. 4A. Clearly, SiNC were released faster in PBS, cell culture medium than H2O. In fact, the structure of LD-SiPM (reaction time 30 min) collapsed in 2 h, as 100 % SiNC were released. However, HD-SiPM shows higher stability, with less than 30 % SiNC clustered nanoparticles (SiNP) falling off from SiPM. This is likely due to more complete cross-linking, denser SiNC packing, and smaller pore size. Fig. 4B shows residual of LD-SiPM after 24 h soaking in H2O. Many SiNP (<100 nm) are found from collapsed structure of microcapsules, which indicates unstable crosslinking of SiNP and siloxanes in capsules. The LD-SiPM dispensed solution become clear (Fig. 4C) in 24 h. LD-SiPM are able to be hydrolyzed in PBS as soon as in a few hours, depending on the reaction time (as seen in Fig. S10, the hydrolysis time-reaction time curve). However, there is no obvious change for HD-SiPM. In order to quantify the hydrolytic behavior of HD-SiPM, Mutisizer was used to quantify the size and amounts of HD-SiPM during hydrolysis. Fig. 4D shows there is decreasing trend for diameter of HD-SiPM but without a corresponding decrease in particle amounts. There are much less SiNP fall off from HD-SiPM (Fig. 4E, inset SEM images and Fig. S11), which is also in accordance with Mutisizer results (The diameter of HD-SiPM changes from 1.6 µm to 1.39 µm) and released curve measured by ICP-OES (Fig. S12).
Fig. 4.
Stability of SiPM with different reaction times in aqueous media. (A) SiNP release behavior from LD-SiPM (reaction time: 30 min) and HD-SiPM (reaction time: 24 h) in PBS, DI water and cell culture medium. (B) SEM image of remaining SiNP/Polymer matrix from LD-SiPM in H2O. (C) Digital pictures of LD-SiPM (left, 30 min synthesis) and HD-SiPM (right, 24 h synthesis) immersed in PBS (pH=7.4) for 0 h and 24 h. LD-SiPM sample became clear in 24 h, indicating degraded substantial degradation, while HD-SiPM sample showed little change. (D) Change of diameter and amount of HD-SiPM along with time in PBS. (E) Multisizer results of size distribution of HD-SiPM at beginning and after 24 h immersion in PBS. Insets are SEM images of related HD-SiPM. Scale bar is 1 µm for all images.
Compared with free-standing SiNC of a few nanometers, SiPM has several advantages due to their size. First, they are easy to handle. They can be collected, processed and stored through standard centrifugation and filtration processes. The microcapsule (LD-SiPM) can be used for SiNC storage, where SiNC can be released on demand. Second, nanopores in SiPM provide structural basis for absorption of molecules, making it possible for chemical detection,41 catalysis,42 drug delivery and controlled release. With their fluorescence, SiPM are also promising as fluorescent probes. Integration of these functionalities opens broad opportunities, deserving further investigations. We explored the capability of SiPM to adsorb and reduce metal ions in aqueous solution, and confirmed that SiPM were able to reduce noble metal ions to generate metal oxides and metal nanoparticles in SiPM, which also indicates the existence of L-AA in SiPM. This also altered the fluorescence of SiPM. Resulting SiPM-metal hybrid particles may have potential applications in catalysis43 and sensing.44
SiPM as a photostable fluorescent drug delivery vector
It is worth noting that gel-like siloxane-derived hybrids have also been reported with comparable fluorescence properties.33, 34, 45 However, special treatments such as calcination46, 47 and instant ablation39 are required for the synthesis. Based on our experiments, APTES in hydrochloric acid solutions formed ivory-white hybrid, but did not show fluorescent property (data not shown). According to previous reports, carboxylic acids are critical by forming C substitutional defect for Si, to induce fluorescence in APTES-based hybrids.48 These treatments are neither available nor needed for SiPM to trick the fluorescence. Moreover, SiPM lose their fluorescence if calcinated in air, implying the effect of SiNC oxidation (data not shown). On the other hand, the emission spectrum of hydrolyzed products of SiPM (mainly composed of SiNC) is similar to that before hydrolysis. These suggest the embedded SiNC (rather than the polymer matrices) to be the source of fluorescence of SiPM.
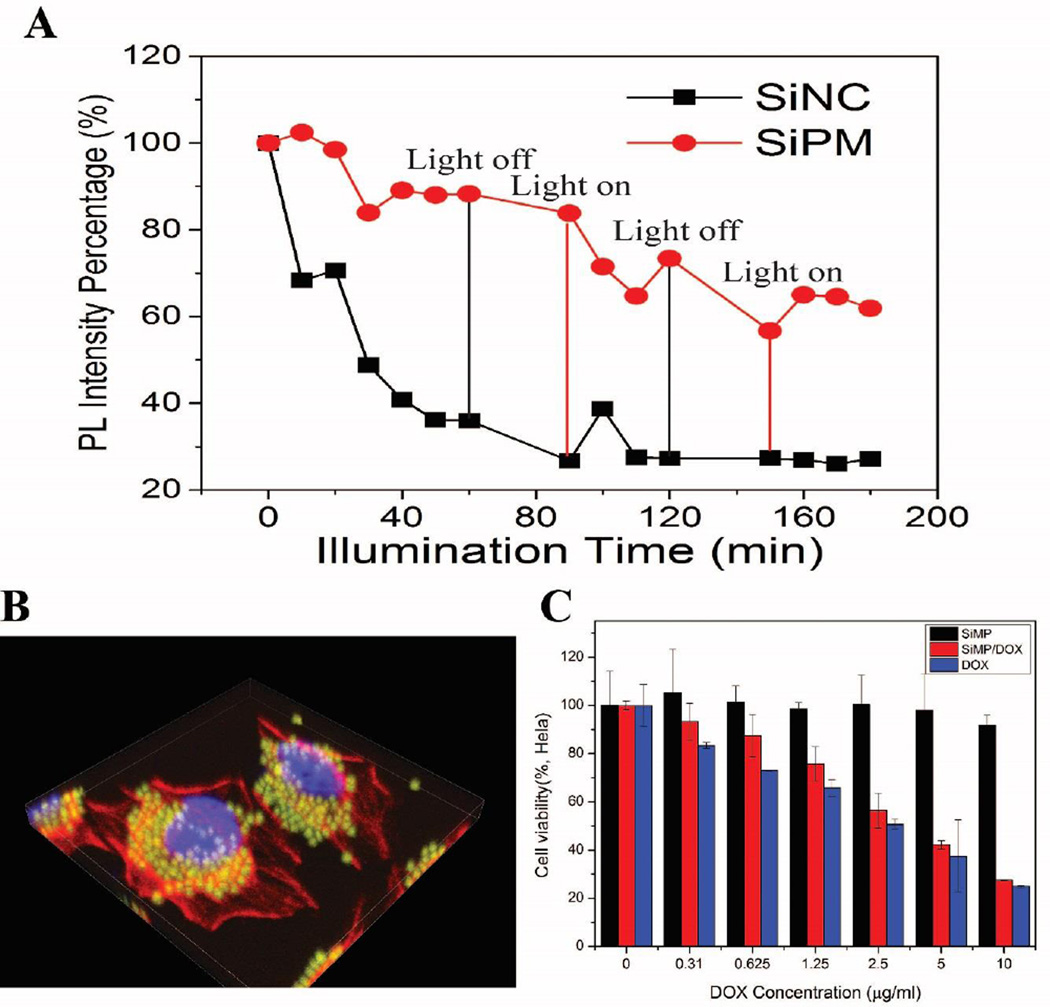
Besides quantum size effect of SiNC, the surface effects may also have an impact on their fluorescence.11 The surface-capping molecules such as allylamine49 and APTES15 play an important role in the radiative combination mechanisms in 1–2 nm SiNC,50 since their electronic charge distribution can be modified by the polar nature of their capping ligands. Therefore, the size and amine group on SiNC in SiPM are responsible for their fluorescent emission SiPM exhibits strong fluorescence, and the quantum yield (QY) of released SiNC is similar to that of free SiNC (QY: ~20 %, PL spectrum of quinine sulfate, as a reference, shown in Fig. S13) prepared before,36 and siloxane-like matrices do not seem to quench the fluorescent emission, making SiPM attractive for bio-imaging. The photostability of SiPM and free SiNC was also evaluated under UV irradiation. As shown in Fig. 5A, the PL intensities of both samples continuously decreased along with illumination time. SiNC shows a much faster decay rate than SiPM, and the remained PL intensity of SiNC decreased to 25 % while the SiPM maintained a higher PL intensity value of 62 %. We assessed submicron SiPM’s fluorescence performance and biocompatibility for cell imaging. The cell uptake and intracellular behavior of SiPM by Hela cells were also explored by monitoring green fluorescence (ex. 488 nm, em. 500–550 nm). To co-localize particles, DAPI and Alexa fluor 555 Phallodin were used for staining nuclei and actin respectively. The particles eventually accumulate in cytoplasm near cell nuclear envelopes after 4 h (Fig. 5B). In addition, nanopores in SiPM provides structural basis for absorption of molecules, making it possible for chemical detection,41 catalysis,42 drug delivery and controlled release. With their porosity, SiPM also are promising as bi-functional delivery vectors (for imaging and drug delivery).51 We tested the loading of doxorubicin in SiPM, and corresponding loading capacity is shown in Fig. S14. SiPM demonstrates high biocompatibility with Hela cells with over 95 % viable cells after 24 h, even with very high particle concentration (> 1 million/mL SiPM) (Fig. 5C). When cells are incubated with SiPM/DOX and free DOX, concentration-dependent cell death is observed. Higher concentration of DOX would result in decrease of cell viability. The integration of these functionalities with fluorescence property opens broad opportunities, deserving further investigations.
Fig. 5.
(A) Remained PL emissions of Si nanoparticles and SiPM solutions along with increasing illumination time. (Rayonet-600 photochemical reactor, 120W) (B) 3D confocal image of Hela cells after incubated with SiPM for 4 h. (C) Cell viability of Hela cells after 24 h incubation with free DOX, SiMP and SiMP/DOX of various concentrations DOX. Results are the average from three independent experiments.
SiPM/MnO2 hybrids for glutathione (GSH) detection
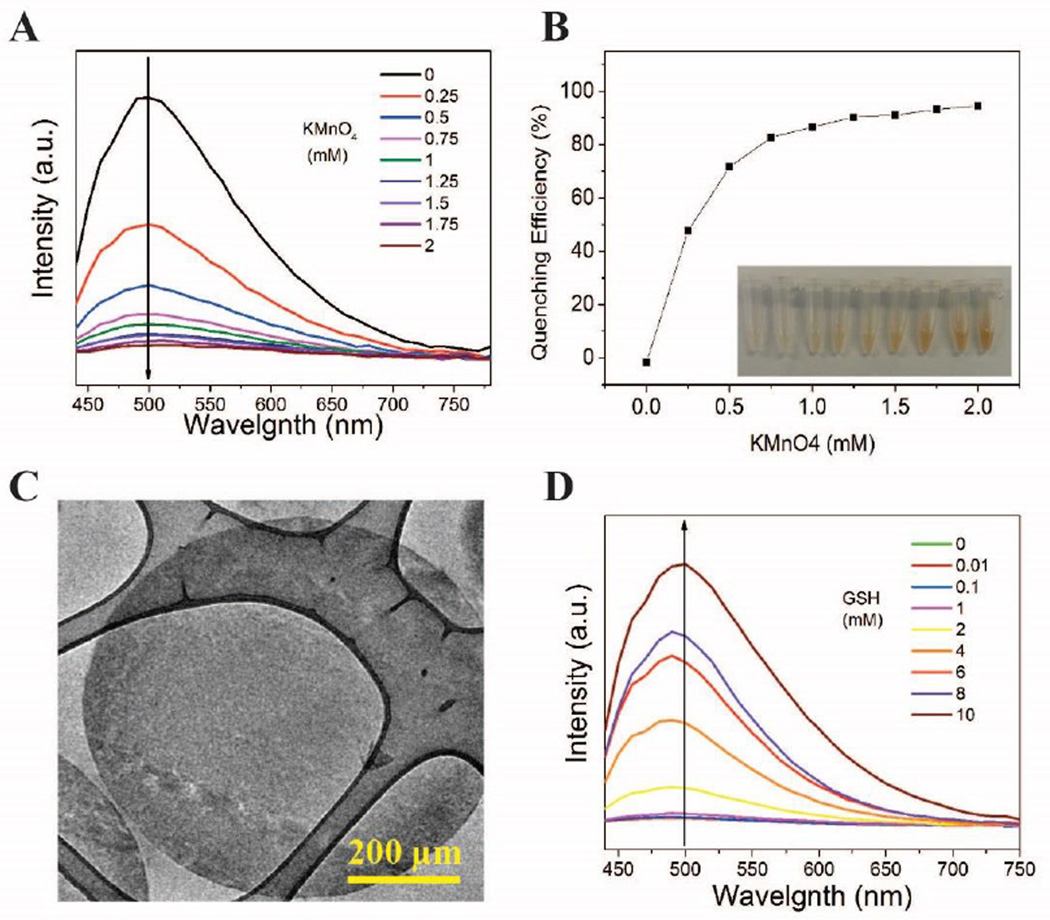
Glutathione (γ-L-glutamyl-L-cysteinyl-glycine; GSH), as the main non-protein thiol source, exists in most mammalian tissues.52 It is necessary to monitor level of glutathione due to its biological significance in diseaces such as cancer,53 HIV54 and heart problems.55 SiPM were able to in situ reduce KMnO4 to MnO2 sheets by immersing SiPM in KMnO4 aqueous solutions (here we used HD-SiPM). Formed MnO2 sheets were able to quench the photoluminescence of SiPM, which is recoverable when GSH was added.56 The relationship between KMnO4 amounts and quenching efficiency of formed MnO2 on SiPM was shown in Fig. 6A and 6B. Inset in Fig. 6B is a photo of corresponding SiPM/MnO2 solutions. MnO2 formed by using 2 mM KMnO4 in reaction reached about 98 % quenching efficiency on SiPM. The morphology of SiPM/MnO2 slices (thickness: 70 nm) is observed through TEM (Fig. 6C). The morphology of SiPM is not significantly changed but on enhanced contrast. The existence of Mn on SiPM/MnO2 is also verified by EDS (Fig. S15). The recovery of photoluminescence is realized through red-ox reaction between MnO2 in SiPM and GSH, and the fluorescent spectra of this process is shown in Fig. 6D. The amount of photoluminescence that is recovered is proportional to the GSH concentration. It is noted that there is hardly fluorescence recovery for control sample in Fig. 6D compared with other samples (with GSH addition). Therefore, SiNC releasing causes little influence on final results. The limit of detection (LOD) LOD is adjustable by changing amounts of KMnO4 in reaction and SiPM/MnO2 in detection.
Fig. 6.
Bio-sensing by using SiPM/MnO2 composite. (A) Photolumunescence spectra (excitation wavelength: 420 nm) of SiPM/MnO2 resulted from various concentration of KMnO4 in reaction. (B) The quenching efficiency of MnO2 on SiPM along with increasing concentration of KMnO4, inset is captured images of corresponding SiPM/MnO2 composites. (C) TEM image of SiPM/MnO2 composite slices (thickness: 70 nm) (D) The fluorescence spectra (excitation wavelength: 420 nm) of SiPM/MnO2 (SiPM reacted with 2 mM KMnO4) with increasing GSH concentration.
HD-SiPM applied in Hg2+ sorption
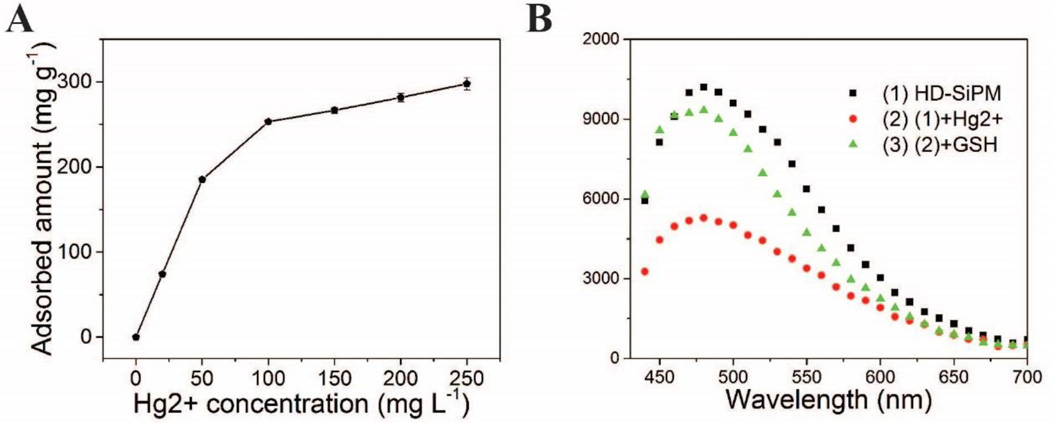
Mercury is one of the poisonous heavy metals where the residual level of its ionized form (Hg2+) in drinking water remains a big problem for environmental science and pollution research.57 Though amine terminated SiNC had been used as fluorescent probe in detecting Hg2+ in aqueous solutions via the affinity of Hg2+ to N,58 previously used SiNC is dissociated, lacking the capability to deplete Hg2+. On contrary, the highly nanoporous structure in our SiPM is suitable in adsorbing molecules. A detection-sorption multiplexed platform of Hg2+ was developed by integrating porous structure and fluorescence of SiPM. The adsorption curve of Hg2+ at different concentrations by using SiPM is shown in Fig. 7A. HD-SiPM shows high adsorption capacity, more than 300 mg Hg2+ can be adsorbed in 1 g SiPM. Also the adsorption process is highly efficiency, usually saturated within 1 min, thus the small release of SiNC hardly affect detection accuracy. The relative fluorescent quenching efficiency of Hg2+ on SiPM is shown in Fig. 7B. 10−3 M Hg2+ shows about 50 % fluorescent quenching on photoluminescence spectrum of SiPM, which, however, cab be recovered with GSH addition (10−3 M). The nanoporous structure of SiPM is responsible for adsorbing Hg2+, while SiNC in SiPM performs as fluorescent probe for monitoring adsorbed Hg2+. The detection-sorption multiplexed platforms are recyclable simply by using GSH to recover Hg2+ from the SiPM.
Fig. 7.
(A) Adsorption curve of Hg2+ at various concentrations by using HD-SiPM. (B) the fluorescent spectra (excitation wavelength: 420 nm) of SiPM before (black) and after addition of Hg2+ (1 mM, red) and after addition of GSH (green).
SiPM/Au/Pt composites for catalyzing 4-Nitrophenol (4-NP)
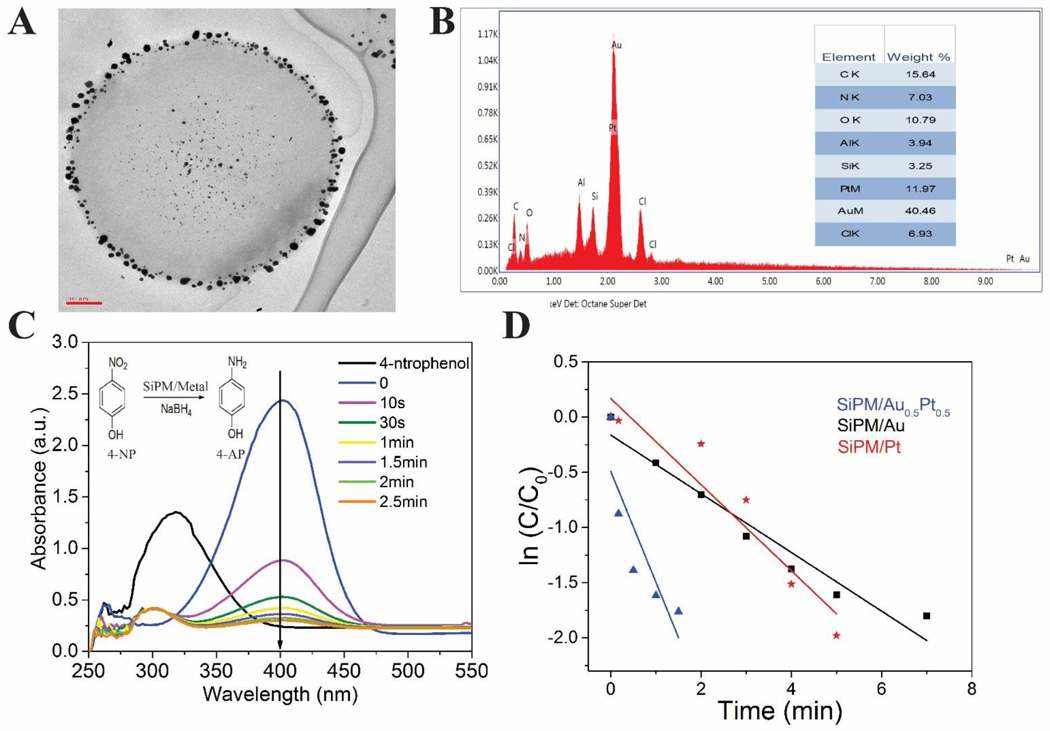
The SiPM were proven to reduce noble metal ions into nanoparticles from their aqueous solutions due to the existence of L-AA in SiPM. In our SiPM, we show that reduction can happen in situ at the nanopores. Here we demonstrate that the resulting silicon-metal nano-composite can be used for catalysis of redox reaction. Fig. 8A shows TEM image of SiPM/Au. The distribution of Au nanoparticles (AuNP) in SiPM seems to match the porous structure in SiPM. AuNP are mostly seen on outer surface, and there is a blank shell portion where no AuNP are visible. There are also AuNP visible at center, indicating SiNC are also nucleated deeply in SiPM through diffusion of ions. Fig. 8B, Fig. S16 and Fig. S17 show EDS spectra of SiPM/Au0.5/Pt0.5, SiPM/Au and SiPM/Pt (HD-SiPM were applied). The reduction of 4-nitrophenol (4-NP) to 4-aminophenol (4-AP) by NaBH4 was used to examine the catalytic activity of SiPM/metal composites.59 Fig. 8C shows catalytic conversion of 4-NP by SiPM/Au0.5Pt0.5, inset is the principle of reduction. The absorption peak of 4-NP was at 317 nm and red-shifted to 400 nm after NaBH4 has been added, due to ionization of 4-NP. When the SiPM/metal composites were added, the color of the reacting solution changed from bright yellow to colorless, which reflects the diminishing absorbtion at 400 nm. The reaction rate can be evaluated via slope of kinetic curves since concentration of NaBH4 was excessive compared with that of 4-NP. Fig. 8D shows change of ln (C/Co) along with reaction time. The plots can be linearly fitted by the equation: ln (C/Co) = kt. C and Co stand for reactive and initial absorbance intensity at 400 nm. k stands for the rate constant, which can be used to calculate catalytic ability of these composites.59 SiPM/Au0.5Pt0.5 (k=0.492) demonstrate the highest catalytic ability compared to SiPM/Au (k=0.162) and SiPM/Pt (k=0.168). Reducing metal ions (Cu, Pt, Ag and Au verified) to form SiPM/metal composites greatly extends the potential application of SiNC in applications such as detection, antibiosis, Surface Enhanced Raman Scattering (SERS) and drug delivery.
Fig. 8.
(A) TEM image of SiPM/AuNP slices (70 nm thin), indicating SiPM reduced gold ions to form AuNP (dark-phased black particles) throughout SiPM matrix. (B) EDS spectrum of SiPM/Au0.5/Pt0.5, inset is elements composition. (C) UV-vis spectra during catalytic conversion of 4-NP by SiPM/Au0.5/Pt0.5 over time, inset is principle of reduction of 4-NP by NaBH4 to form 4-AP (D) Ln (C/C0) versus t for the reduction of 4-NP catalyzed by SiPM/Au, SiPM/Pt and SiPM/ Au0.5/Pt0.5.
Chemical composition analysis of SiPM
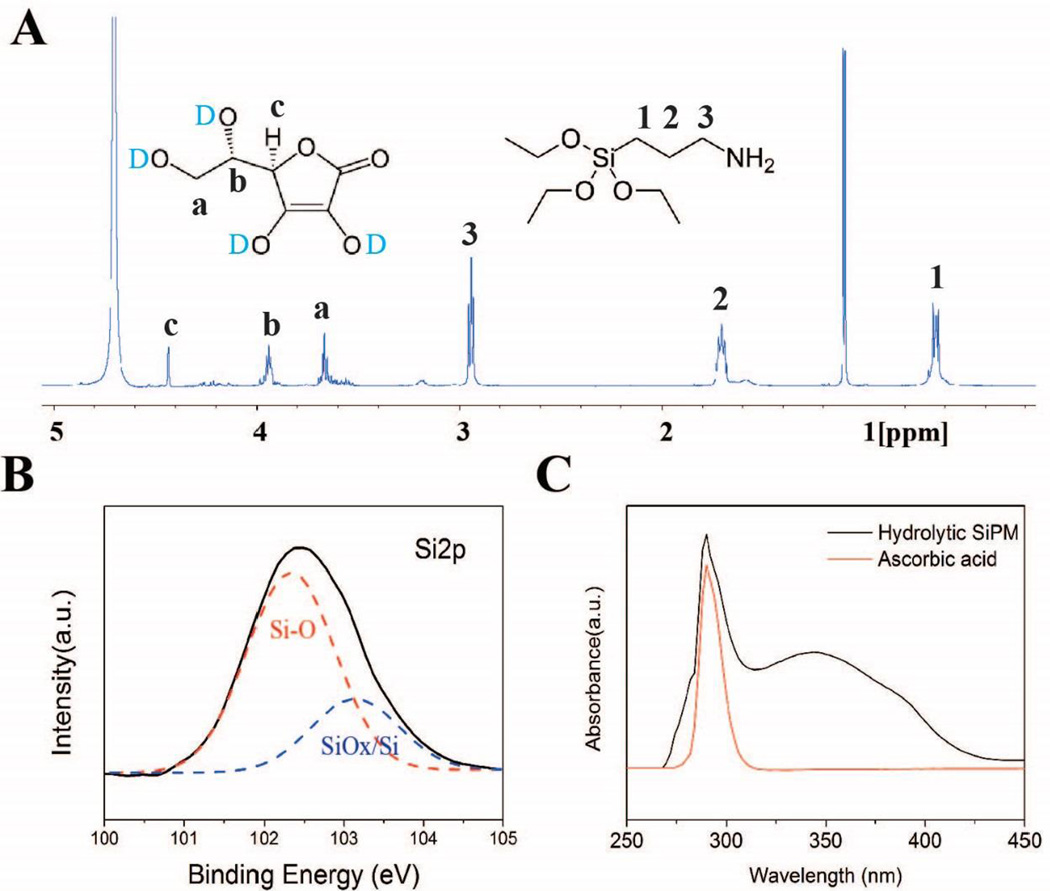
The organic composition of SiPM is mostly APTES derived siloxane-like polymer (Equation S1). The chemical structures are confirmed by the diverse spectroscopies. The FTIR (Fig. S18) exhibits characteristic peaks of Si-O-Si from siloxane-like backbone, C-H stretching, O-H stretching, stretching and bending of N-H bond, and potential C=C and C=O stretching vibrations, suggesting the existence of L-AA in polymeric matrices. NMR spectrum further confirms the existence of both APTES-derived siloxane-like polymer and L-AA (Fig. 9A), the peaks at 2.9, 1.7 and 0.6 ppm are corresponding to Propyl group in APTES, and it is significant to note the loss of up to three ethoxy groups for APTES during coupling of molecules in forming polymer matrices and to surfaces of silicon nanoparticles.49, 60 For measuring NMR spectrum of AA, “D2O shake” occurs when using D2O as solvent in NMR testing, in which the exchangeable protons are exchanged with the deuterium in D2O and disappear in spectrum.61 The pattern at 3.7 and 3.9 ppm are distinguished as -CH2 group linked with hydroxyl in AA. The signal at 4.4 ppm is attributed to the proton on the heterocycle. A sharp peak observed at 1.1 ppm is due to the residue of IPA molecules in samples. In 2D-TOCSY spectrum (shown in Fig. S19), one set shows typical correlation and chemical shift of propyl group in APTES, while the other set matches well to that of L-AA. The resonance of former set is roughly two times stronger than the latter one, suggesting less abundance of L-AA in matrices. This is consistent with elemental analysis and zeta potential measurements. There are two facts worthy of noticing. First, no protons from ethyloxy groups are observed, suggesting APTES is mostly hydrolyzed during condensation.49, 60 Second, neither short- nor long-range coupling is observed between APTES-derived siloxane and L-AA. This suggests that the incorporation of L-AA in the siloxane-like backbone could be through non-covalent bonding (electrostatic adherence etc.) or hydrogen bond. The high resolution XPS spectra (Fig. S3 and Fig. 9B) indicates chemical bonds of C-C, C-N, C-O, C=O and Si-O in SiPM. While the existence of C-C, C-N and NH2 is attributed to the aminopropyl side chain, the Si-O is attributed to siloxane-like backbone. Fig. 9C shows UV absorbance curve of hydrolytic SiPM as compared to control of L-AA. (Note: The peak at around 350 nm is attributed to SiNC.) Both curves have a consistent sharp absorption at around 300 nm, suggesting L-AA is preserved in polymer matrices.
Fig. 9.
(A) Solution-phase 1D 1H NMR spectrum of hydrolytic SiPM in D2O. (B) Structure analysis of high resolution XPS spectra: Si2p. (C) UV-vis absorption spectrum of hydrolytic SiPM and L-ascorbic acid.
Conclusions
In summary, we developed a one-step method for facile, highly efficient synthesis of SiNC contained in microcapsules. The as-prepared SiPM show uniform morphology, great aqueous dispersibility, strong photoluminescence, and porous structure. The size, yield, porosity, fluorescence intensity, and stability of SiPM are adjustable by simply changing reaction parameters. Combination of fluorescent SiNC and highly porous polymeric matrix makes SiPM an excellent self-indicator in adsorption Hg2+ in aqueous solution. SiPM can also reduce metal ions in their aqueous solution and alter their fluorescence. The formed SiPM/MnO2 and SiPM/Au0.5/Pt0.5 shows excellent performance in detecting GSH and catalytic activity of 4-NP. These SiPM/metal oxide and SiPM/metal nanoparticles can be applied in areas such as cancer therapy,62 biosensors44 and catalysis.43
Experimental
Materials
(3-Aminopropyl)-trimethoxysilane (APTES, 99%), L-Ascorbic acid (L-AA, 99%), Isopropanol (IPA), hydrogen tetrachloroaurate (III) hydrate (HAuCl4), silver nitrate (AgNO3), potassium permanganate (KMnO4), mercury (II) chloride and quinine sulfate were purchased from Sigma-Aldrich. All chemicals were used without additional purification.
Synthesis and characterization of fluorescent SiPM
Silicon nanocrystals (SiNC) containing polymer microcapsules (SiPM) were synthesized by controlling the reaction of APTES and L-AA. Typically, 100 µL APTES and 1.5 mL of 0.1 M L-AA aqueous solutions were added into 30 mL IPA. The mixture was briefly sonicated, and then kept at a specific temperature for defined time. Typical fluorescent SiPM with ~1 µm diameters were then obtained. After reaction, the SiPM were first precipitated through centrifugation at 10,000 × g for 5 min, washed three times using IPA and then stored in IPA. Scanning Electron Microscopy (SEM, high vacuum, HV=8 kV, spot size 3.5), JEM-2100 Field Emission Gun Transmission Electron Microscope (TEM), X-ray Photoelectron (XPS) and EDS were utilized for characterizing the structure, morphology and elements of the prepared SiPM. Surface chemical band was monitored by Fourier Transform Infrared Spectroscopy (FTIR) and XPS. Malvern Zetasizer was used to assess zeta potential of SiPM. The composition of polymer matrix was tested by 1D 1H NMR and 2D TOCSY NMR. SiPM (reaction time, 20 min) were hydrolyzed in D2O. The hydrolytic sample was added into NMR tube and measured by 600 MHz NMR.
Tuning the size, yield, fluorescent intensity, porosity and biodegradability/hydrolysis of SiPM
The influence of reaction time on the size of SiPM was explored. Briefly, after mixing APTES with L-AA in IPA, the mixture was allowed to react for various times (from 30 min to 24 h), then the reaction was terminated by washing. In order to test the effect of reagent concentration on the final size of SiPM, 100 µL APTES and 1.5 mL 0.1 M L-AA aqueous solutions were added in IPA of different volumes (from 15 mL to 180 mL). Multisizer 4 Coulter Counter (Beckman Coulter) was used to monitor the change of size and accounts of as-prepared SiPM. The impact of reaction time on fluorescent intensity of SiPM was investigated by measuring their photoluminescence curves by Synergy H4 Hybrid Reader (Bio TEK). N2 adsorption/desorption isotherms of different samples were measured using Quantachrome Automated Gas Sorption Analyzer, and the surface area and pore size distribution were calculated by Dubinin-Astakov (DA) and Barrett-Joyner-Halenda (BJH) method
In order to evaluate the SiNP release behavior from LD-SiPM and HD-SiPM, one billion SiPM are immersed in 500ul DI water and PBS respectively. The dispensed solutions were centrifuged at different time points, and the PL spectra of supernatant (SiNP) was recorded via plate reader. The precipitate was tested by SEM and Multisizer to monitor their morphology, size and amounts.
To test biodegradation kinetics of Si, 1.25×10¹⁰ SiPM (n=3) were dispersed into 500 µL Phosphate Buffered Saline (PBS, pH=7.4). The mixtures were kept in the Digital Heatblock at 37 °C. At different time points, 10 µL SiPM solution was taken out and centrifuged, and the precipitate was extensively washed by IPA and centrifuged at 13,000 × g for three times, then spot on SEM stub for imaging their morphology change. At the same time point, SiPM were spun down, and supernatant was replaced with 500 µL fresh PBS. All the supernatant was collected and diluted in DI water, and stored at 4 °C for following Si element analysis, which was measured by Inductively Coupled Plasma Optical Emission Spectrometer (ICP-OES, Varian 720-ES).
SiNC are produced according previous method.36 Briefly, 100 µL APTES is mixed with 1 mL of 0.1 M L-AA and react for 1 h. The residual reagents were removed by dialysis (1 kDa). The resulting SiNC exhibit green fluorescence under UV irradiation.
The quatum yield of SiNC and release SiNC from SiPM were determined by using quinine sulfate as a standard, and QY values are based on the established equation: Qx = QrMxNx2/(MrNr2).21, 63 N, M, and Q stand for the average refractive index of the solvent, the gradient of straight line, and quantum yield. r and x indicate the reference quinine sulfate and the tested SiNC, respectively. The value of optical densities at the excitation wavelength of samples were adjusted to the same values (≤0.1).
CCK-8 assay and cell uptake of SiPM
The Human cervical cells Hela were cultured in Dulbecco’s modified Eagle’s medium (DMEM) supplemented with 10 % fetal bovine serum (FBS) and antibiotics (100 µg/mL streptomycin and 100 U/mL penicillin). Both cell lines were cultured under the condition of 5 % CO2 and 95 % humidity at 37 °C.
Suspensions of 1×10⁵ cells/mL Hela were plated in Lab-Tek Chamber Slides (Thermo Fisher Scientific, USA) and cultured overnight, followed by adding SiPM (2.5×10⁶/mL). They were cultured for 1 h and 4 h separately. After washed by PBS for 3 times, the cells were fixed with 4 % glutaraldehyde in PBS for 30 min at room temperature. The fixed cells were stained with DAPI before observing by Nikon A1 Confocal Imaging System. Counting Kit-8 (CCK-8) assay was applied to evaluate cytotoxicity. Briefly, 1×10⁴ Hela cells were plated separately in 96-well plates and cultured overnight. Then they were exposed to SiPM, SiPM/DOX and free DOX with various concentrations for 24 h. After 4 h of 10 µL CCK-8 addition, the absorption peak of medium at 450 nm and 630 nm by Synergy H4 Hybrid Reader (Bio TEK).
Synthesis of SiPM/MnO2 for detecting glutathione (GSH) in aqueous solutions
SiPM/MnO2 composites were synthetized simply by mixing SiPM with KMnO4 aqueous solutions. Briefly, various volumes of 40 mM KMnO4 was added in SiPM dispensed aqueous solution (with about 1 × 10⁸ SiPM), and reacted for 2 h. After reaction, the formed SiPM/MnO2 was collected via centrifugation at 10,000 × g for 5 min, washed by IPA for three times and then stored in IPA. In order to test GSH detection using SiPM/MnO2 composites. GSH solutions at different concentrations were added in SiPM/MnO2 composites solutions. The change of photoluminescence spectra were recorded by plate reader.
SiPM applied in Hg2+ adsorption
The stock solution of 1000 ppm of Hg2+ was prepared by dissolving 13.54 mg HgCl2 in 10 mL DI water. 10 µL of 1 B/mL HD-SiPM were mixed with Hg2+ at different concentrations. The PL spectra of SiPM/Hg2+ were recorded by plate reader. After 5 min, the supernatant was collected via centrifugation and measured by ICP-OES to calculate Hg amounts inside.
Synthesis of SiPM/Au, SiPM/Pt and SiPM/Au0.5Pt0.5 for catalytic activity on 4-Ntrophenol
For SiPM/Au, briefly, 30 µL of 20 mM HAuCl4 was added in SiPM dispensed aqueous solution (with about 1 × 10⁸ SiPM), and reacted for 24 h. 2 µL of 300 mM K2PtCl4 was reacted with SiPM in forming SiPM/Pt. For SiPM/Au0.5Pt0.5, 15 µL of 20 mM HAuCl4 and 2 µL of 300 mM K2PtCl4 were simultaneously mixed with SiPM solutions. After reaction, the formed composites were collected via centrifugation at 10,000 × g for 5 min, washed by IPA for three times and then stored in IPA.
The reduction of 4-nitrophenol (4-NP) by NaBH4 was used to test the catalytic activity of SiPM/metal composites in aqueous solutions. Briefly, 2 µL of 0.1 M 4-NP and 10 µL of 1 M NaBH4 were added in 2 mL DI water in cuvette. Then 80 µL of SiPM/metal (SiPM/Au, SiPM/Pt and SiPM/Au0.5Pt0.5) composites were added in the cuvette. The UV-vis spectrometer was used to record the change of absorbance curves along with time.
Supplementary Material
Acknowledgments
The authors would like to thank Dr. Jianhua Gu of the HMRI Microscopy-SEM/AFM core on SEM imaging and Mr. Carlos Favela for his help on Confocal imaging. The authors acknowledge financial support from the following sources: NIH U54CA151668-01, NIH 1R21CA190024-01, DOD W81XWH-12-1-0414, DOD W81XWH-10-2-0125, National Natural Science Foundation of China 81571791, and Houston Methodist Research Institute.
Footnotes
Electronic Supplementary Information (ESI) available: [details of any supplementary information available should be included here]. See DOI: 10.1039/x0xx00000x
Notes and references
- 1.Cheng XY, Lowe SB, Reece PJ, Gooding JJ. Chemical Society Reviews. 2014;43:2680–2700. doi: 10.1039/c3cs60353a. [DOI] [PubMed] [Google Scholar]
- 2.Wang YL, Wang TY, Da PM, Xu M, Wu H, Zheng GF. Advanced Materials. 2013;25:5177–5195. doi: 10.1002/adma.201301943. [DOI] [PubMed] [Google Scholar]
- 3.Park JH, Gu L, von Maltzahn G, Ruoslahti E, Bhatia SN, Sailor MJ. Nature Materials. 2009;8:331–336. doi: 10.1038/nmat2398. [DOI] [PMC free article] [PubMed] [Google Scholar]
- 4.Almeida VR, Barrios CA, Panepucci RR, Lipson M. Nature. 2004;431:1081–1084. doi: 10.1038/nature02921. [DOI] [PubMed] [Google Scholar]
- 5.Liu AS, Jones R, Liao L, Samara-Rubio D, Rubin D, Cohen O, Nicolaescu R, Paniccia M. Nature. 2004;427:615–618. doi: 10.1038/nature02310. [DOI] [PubMed] [Google Scholar]
- 6.Baehr-Jones T, Pinguet T, Lo Guo-Qiang P, Danziger S, Prather D, Hochberg M. Nature Photonics. 2012;6:206–208. [Google Scholar]
- 7.Staude I, Miroshnichenko AE, Decker M, Fofang NT, Liu S, Gonzales E, Dominguez J, Luk TS, Neshev DN, Brener I, Kivshar Y. Acs Nano. 2013;7:7824–7832. doi: 10.1021/nn402736f. [DOI] [PubMed] [Google Scholar]
- 8.Zwanenburg FA, Dzurak AS, Morello A, Simmons MY, Hollenberg LCL, Klimeck G, Rogge S, Coppersmith SN, Eriksson MA. Reviews of Modern Physics. 2013;85:961–1019. [Google Scholar]
- 9.Hwang SW, Tao H, Kim DH, Cheng HY, Song JK, Rill E, Brenckle MA, Panilaitis B, Won SM, Kim YS, Song YM, Yu KJ, Ameen A, Li R, Su YW, Yang MM, Kaplan DL, Zakin MR, Slepian MJ, Huang YG, Omenetto FG, Rogers JA. Science. 2012;337:1640–1644. doi: 10.1126/science.1226325. [DOI] [PMC free article] [PubMed] [Google Scholar]
- 10.Wu H, Chan G, Choi JW, Ryu I, Yao Y, McDowell MT, Lee SW, Jackson A, Yang Y, Hu LB, Cui Y. Nature Nanotechnology. 2012;7:309–314. doi: 10.1038/nnano.2012.35. [DOI] [PubMed] [Google Scholar]
- 11.McVey BFP, Tilley RD. Accounts of Chemical Research. 2014;47:3045–3051. doi: 10.1021/ar500215v. [DOI] [PubMed] [Google Scholar]
- 12.Tasciotti E, Liu XW, Bhavane R, Plant K, Leonard AD, Price BK, Cheng MMC, Decuzzi P, Tour JM, Robertson F, Ferrari M. Nature Nanotechnology. 2008;3:151–157. doi: 10.1038/nnano.2008.34. [DOI] [PubMed] [Google Scholar]
- 13.Priolo F, Gregorkiewicz T, Galli M, Krauss TF. Nature Nanotechnology. 2014;9:19–32. doi: 10.1038/nnano.2013.271. [DOI] [PubMed] [Google Scholar]
- 14.Cheng X, Hinde E, Owen DM, Lowe SB, Reece PJ, Gaus K, Gooding JJ. Adv Mater. 2015 doi: 10.1002/adma.201503223. [DOI] [PubMed] [Google Scholar]
- 15.Zhong YL, Peng F, Bao F, Wang SY, Ji XY, Yang L, Su YY, Lee ST, He Y. Journal of the American Chemical Society. 2013;135:8350–8356. doi: 10.1021/ja4026227. [DOI] [PubMed] [Google Scholar]
- 16.Montalti M, Cantelli A, Battistelli G. Chemical Society Reviews. 2015;44:4853–4921. doi: 10.1039/c4cs00486h. [DOI] [PubMed] [Google Scholar]
- 17.Wilcoxon JP, Samara GA, Provencio PN. Physical Review B. 1999;60:2704–2714. [Google Scholar]
- 18.Baldwin RK, Pettigrew KA, Garno JC, Power PP, Liu GY, Kauzlarich SM. Journal of the American Chemical Society. 2002;124:1150–1151. doi: 10.1021/ja017170b. [DOI] [PubMed] [Google Scholar]
- 19.Heath JR. Science. 1992;258:1131–1133. doi: 10.1126/science.258.5085.1131. [DOI] [PubMed] [Google Scholar]
- 20.Mangolini L. Journal of Vacuum Science & Technology B. 2013;31 [Google Scholar]
- 21.Zhong YL, Sun XT, Wang SY, Peng F, Bao F, Su YY, Li YY, Lee ST, He Y. Acs Nano. 2015;9:5958–5967. doi: 10.1021/acsnano.5b00683. [DOI] [PubMed] [Google Scholar]
- 22.Mastronardi ML, Maier-Flaig F, Faulkner D, Henderson EJ, Kubel C, Lemmer U, Ozin GA. Nano Letters. 2012;12:337–342. doi: 10.1021/nl2036194. [DOI] [PubMed] [Google Scholar]
- 23.Cullis AG, Canham LT, Calcott PDJ. Journal of Applied Physics. 1997;82:909–965. [Google Scholar]
- 24.Huang K, Lu WL, Yu XG, Jin CH, Yang DR. Particle & Particle Systems Characterization. 2016;33:8–14. [Google Scholar]
- 25.Ji XY, Peng F, Zhong YL, Su YY, Jiang XX, Song CX, Yang L, Chu BB, Lee ST, He Y. Advanced Materials. 2015;27:1029–1034. doi: 10.1002/adma.201403848. [DOI] [PubMed] [Google Scholar]
- 26.He Y, Kang ZH, Li QS, Tsang CHA, Fan CH, Lee ST. Angewandte Chemie-International Edition. 2009;48:128–132. doi: 10.1002/anie.200802230. [DOI] [PubMed] [Google Scholar]
- 27.Guan M, Wang WD, Henderson EJ, Dag O, Kubel C, Chakravadhanula VSK, Rinck J, Moudrakovski IL, Thomson J, McDowell J, Powell AK, Zhang HX, Ozin GA. Journal of the American Chemical Society. 2012;134:8439–8446. doi: 10.1021/ja209532e. [DOI] [PubMed] [Google Scholar]
- 28.Deubel F, Steenackers M, Garrido JA, Stutzmann M, Jordan R. Macromolecular Materials and Engineering. 2013;298:1160–1165. [Google Scholar]
- 29.Pi XD, Yu T, Yang DR. Particle & Particle Systems Characterization. 2014;31:751–756. [Google Scholar]
- 30.Dasog M, Kehrle J, Rieger Bernhard, Veinot JGC. Angew Chem Int Ed Engl. 2016;55:2322–2339. doi: 10.1002/anie.201506065. [DOI] [PubMed] [Google Scholar]
- 31.Mitra S, Cook S, Svrcek V, Blackley RA, Zhou W, Kovac J, Cvelbar U, Mariotti D. Journal of Physical Chemistry C. 2013;117:23198–23207. [Google Scholar]
- 32.Rousseau CPF, Garcia J, Popallt M. Chem. Mater. 1995;7:828–839. [Google Scholar]
- 33.Nishimura A, Harada S, Uchino T. Journal of Physical Chemistry C. 2010;114:8568–8574. [Google Scholar]
- 34.Brankova T, Bekiari V, Lianos P. Chemistry of Materials. 2003;15:1855–1859. [Google Scholar]
- 35.Qiao B, Wang TJ, Gao H, Jin Y. Applied Surface Science. 2015;351:646–654. [Google Scholar]
- 36.Wang J, Ye DX, Liang GH, Chang J, Kong JL, Chen JY. Journal of Materials Chemistry B. 2014;2:4338–4345. doi: 10.1039/c4tb00366g. [DOI] [PubMed] [Google Scholar]
- 37.Zhang XD, Chen XK, Kai SQ, Wang HY, Yang JJ, Wu FG, Chen Z. Analytical Chemistry. 2015;87:3360–3365. doi: 10.1021/ac504520g. [DOI] [PubMed] [Google Scholar]
- 38.Wu FG, Zhang XD, Kai SQ, Zhang MY, Wang HY, Myers JN, Weng YX, Liu PD, Gu N, Chen Z. Advanced Materials Interfaces. 2015;2:1500360. [Google Scholar]
- 39.Liu C, Zhao Z, Zhang RL, Yang L, Wang ZY, Yang JW, Jiang HH, Han MY, Liu BH, Zhang ZP. Journal of Physical Chemistry C. 2015;119:8266–8272. [Google Scholar]
- 40.Gil A, Grange P. Colloids and Surfaces a-Physicochemical and Engineering Aspects. 1996;113:39–50. [Google Scholar]
- 41.Virga A, Rivolo P, Descrovi E, Chiolerio A, Digregorio G, Frascella F, Soster M, Bussolino F, Marchio S, Geobaldo F, Giorgis F. Journal of Raman Spectroscopy. 2012;43:730–736. [Google Scholar]
- 42.Peng KQ, Hu JJ, Yan YJ, Wu Y, Fang H, Xu Y, Lee ST, Zhu J. Advanced Functional Materials. 2006;16:387–394. [Google Scholar]
- 43.Schunemann S, Dodekatos G, Tuysuz H. Chemistry of Materials. 2015;27:7743–7750. [Google Scholar]
- 44.Radziuk D, Mohwald H. Acs Nano. 2015;9:2820–2835. doi: 10.1021/nn506741v. [DOI] [PubMed] [Google Scholar]
- 45.Carlos LD, Ferreira RAS, Pereira RN, Assuncao M, Bermudez VD. Journal of Physical Chemistry B. 2004;108:14924–14932. [Google Scholar]
- 46.Jakob AM, Schmedake TA. Chemistry of Materials. 2006;18:3173–3175. [Google Scholar]
- 47.Wang L, Estevez MC, O'Donoghue M, Tan WH. Langmuir. 2008;24:1635–1639. doi: 10.1021/la703392m. [DOI] [PubMed] [Google Scholar]
- 48.Green WH, Le KP, Grey J, Au TT, Sailor MJ. Science. 1997;276:1826–1828. [Google Scholar]
- 49.Shiohara A, Hanada S, Prabakar S, Fujioka K, Lim TH, Yamamoto K, Northcote PT, Tilley RD. Journal of the American Chemical Society. 2010;132:248–253. doi: 10.1021/ja906501v. [DOI] [PubMed] [Google Scholar]
- 50.Warner JH, Rubinsztein-Dunlop H, Tilley RD. Journal of Physical Chemistry B. 2005;109:19064–19067. doi: 10.1021/jp054565z. [DOI] [PubMed] [Google Scholar]
- 51.Salonen J, Kaukonen AM, Hirvonen J, Lehto VP. Journal of Pharmaceutical Sciences. 2008;97:632–653. doi: 10.1002/jps.20999. [DOI] [PubMed] [Google Scholar]
- 52.Abdalla MY. Jordan Journal of Biological Sciences. 2011;4:119–124. [Google Scholar]
- 53.Zhang XD, Wu FG, Liu PD, Gu N, Chen Z. Small. 2014;10:5170–5177. doi: 10.1002/smll.201401658. [DOI] [PubMed] [Google Scholar]
- 54.Herzenberg LA, DeRosa SC, Dubs JG, Roederer M, Anderson MT, Ela SW, Deresinski SC, Herzenberg LA. Proceedings of the National Academy of Sciences of the United States of America. 1997;94:1967–1972. doi: 10.1073/pnas.94.5.1967. [DOI] [PMC free article] [PubMed] [Google Scholar]
- 55.Shiomi T, Tsutsui H, Matsusaka H, Murakami K, Hayashidani S, Ikeuchi M, Wen J, Kubota T, Utsumi H, Takeshita A. Circulation. 2004;109:544–549. doi: 10.1161/01.CIR.0000109701.77059.E9. [DOI] [PubMed] [Google Scholar]
- 56.Deng RR, Xie XJ, Vendrell M, Chang YT, Liu XG. Journal of the American Chemical Society. 2011;133:20168–20171. doi: 10.1021/ja2100774. [DOI] [PubMed] [Google Scholar]
- 57.Huang LJ, He M, Chen BB, Hu B. Journal of Materials Chemistry A. 2015;3:11587–11595. [Google Scholar]
- 58.Zhang J, Yu SH. Nanoscale. 2014;6:4096–4101. doi: 10.1039/c3nr05896d. [DOI] [PubMed] [Google Scholar]
- 59.Wang F, Li W, Feng XL, Liu DP, Zhang Y. Chemical Science. 2016;7:1867–1873. doi: 10.1039/c5sc04069h. [DOI] [PMC free article] [PubMed] [Google Scholar]
- 60.Lehman SE, Tataurova Y, Mueller PS, Mariappan SVS, Larsen SC. Journal of Physical Chemistry C. 2014;118:29943–29951. [Google Scholar]
- 61.Reid RS. Journal of Chemical Education. 1989;66:344–345. [Google Scholar]
- 62.Su YY, Wei XP, Peng F, Zhong YL, Lu YM, Su S, Xu TT, Lee ST, He Y. Nano Letters. 2012;12:1845–1850. doi: 10.1021/nl204203t. [DOI] [PubMed] [Google Scholar]
- 63.Yi YH, Deng JH, Zhang YY, Li HT, Yao SZ. Chemical Communications. 2013;49:612–614. doi: 10.1039/c2cc36282a. [DOI] [PubMed] [Google Scholar]
Associated Data
This section collects any data citations, data availability statements, or supplementary materials included in this article.


