Abstract
Background
Breast cancer is the most common malignant cancer in women worldwide. The tumor markers Cancer Antigen 15-3 (CA15-3) and Carcinoembryonic Antigen (CEA) are frequently used for screening and monitoring breast cancer.
Material/Methods
We conducted a meta-analysis of 13 published case-control studies to assess the associations between serum levels of CA15-3 and CEA with breast cancer susceptibility, including 1179 cases and 493 controls. The analyses were performed on malignant tumor and benign tumor, as well as in different subgroups with respect to the patient ethnicities and clinical tumor stages.
Results
This systematic review and meta-analysis of association studies shows that serum levels of CA15-3 and CEA are potential biomarkers for breast cancer monitoring. When stratified by clinical stage, we noticed that although malignant tumors in all stages show elevated levels of CA15-3, it is greatly associated with the tumor stage, as it increases as breast tumor stage worsens.
Conclusions
This study clarifies the inconsistent conclusions from multiple studies, and provides a precise estimation for clinical utility of 2 important biomarkers, CA15-3 and CEA, in breast cancer monitoring. Thus, our study will shed lights on the prognosis of breast cancer patients.
MeSH Keywords: Breast Neoplasms, Male; Cetacea; Meta-Analysis as Topic; Nuclear Receptor Coactivator 3
Background
Breast cancer is reported as the most common malignant cancer, which accounts for 25% of all cancer cases in women worldwide [1,2]. It resulted over half a million deaths in 2012 [2]. Traditional diagnostic tools, including two-dimensional and three-dimensional mammography, use radiological scanning technique for tumor detection, but these methods are usually not recommended for young women (≤40 years old) due to the false-positive rate and over-diagnosis [3,4]. More practical methods are still needed to provide a fast and non-invasive quantitative estimate of tumor growth. Tumor markers are frequently used for screening and monitoring cancers. Cancer Antigen 15-3 (CA15-3) and Carcinoembryonic Antigen (CEA) are 2 Food and Drug Administration (FDA)-approved tumor markers for monitoring breast cancer [5,6]. CA15-3 is a mucinous glycoprotein, which is one of products of Mucin1 (MUC-1) gene [7]. MUC-1 is found in nearly all epithelial cells, and its overexpression is often associated with colon, breast, ovarian, lung, and pancreatic cancers [8,9]. CEA is a member of the immunoglobulin superfamily. A total of 29 genes have been found in the human CEA gene family, including 11 pregnancy-specific glycoprotein subgroup genes [7]. Previous studies show that elevated levels of serum or salivary CA15-3 and CEA are usually detected in patients with breast malignancies. Many studies have been conducted to quantitatively evaluate the serum level of these 2 tumor markers in breast cancer patients [10–24]. For example, Moazzezy et al. reported that CA15-3 and CEA serum levels were independent of the breast cancer staging [25]. Uehara et al. [6] and Atoum et al. [11] found significant differences in CA15-3 expression levels in different stages of breast cancer. In addition, Thriveni et al. found that serum CEA levels did not have any significant correlation in breast cancer patients prior to treatment [17]. Samy et al. showed that preoperative serum levels of CEA of breast cancer patients were significantly higher compared with the levels of the control group [15]. Nevertheless, the results of many studies are inconsistent, even conflicting with each other. Therefore, to clarify the change of serum levels of CA15-3 and CEA in breast cancer, we performed a meta-analysis on 13 eligible case-control studies [10–12,14–23] that have been published to date, including 1179 cases and 493 controls, as well as subgroup analysis in terms of ethnicity distribution and breast cancer clinical stages. We used the Mantel-Haenszel (M-H) fixed-effects model set to analyze datasets at low statistical inconsistency, and used the DerSimonian and Laird (D-L) random-effects model for those showing obvious heterogeneity, to calculate the standardized mean difference (SMD) and 95% confidence interval (CI) for the strength of the associations between serum levels and breast cancer risk. We believe our study can deliver a more precise estimation of association of CA15-3 and CEA with breast cancer susceptibility.
Material and Methods
Search strategy
All studies reporting associations between the serum levels of CA15-3 and CEA with breast cancer published from 2000 to 2014 were collected by comprehensive internet-based searches of PubMed, Google Scholar, and CNKI databases. The relevant key words, including “CA15-3”, “CEA”, and “breast cancer” were used for searching.
Data collection
A total of 385 results (220 from PubMed, 135 from Google Scholar, and 30 from CNKI) were found in the first-round screening. To narrow the selection, the criteria for studies to be considered for this meta-analysis were as follows: (i) relative articles, non-duplicated articles; (ii) case–control studies published in peer-reviewed journals with full text available; (ii) studies focus on the relationship between serum levels of CA15-3 and CEA with breast cancer; and (iv) statistic information of mean, standard deviation, and number of cases/controls being available. With the restrictions mentioned above, a total of 13 articles are eventually selected for our meta-analysis. For each article, the following data were collected: the first author’s last name, year of publication, country of origin, patient ethnicity, mean/standard deviation, and number of cases or controls, as well as the clinical information. The procedure of article collection is shown in Figure 1.
Figure 1.
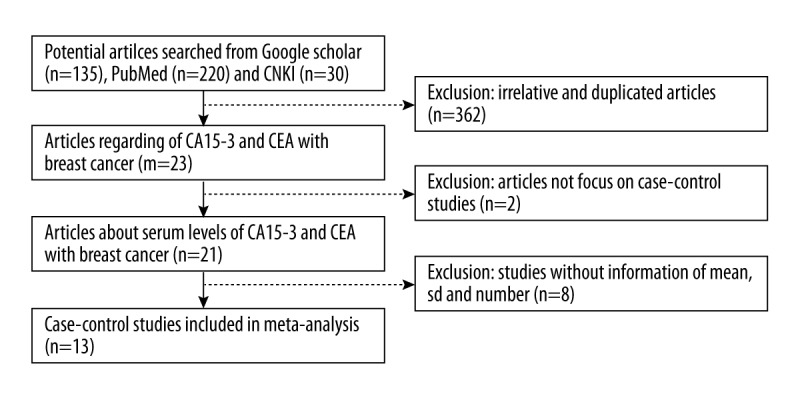
Flow diagram of article collection.
Statistical methods
In this study, statistics software STATA (release 12.0, College Station, TX) was used to conduct all the meta-analyses. The strength of the associations between serum levels and breast cancer susceptibility were assessed using all databases, and the average differences of each included trial were expressed as the standardized mean difference (SMD) and 95% confidence interval. Analyses of CA15-3 and CEA were performed separately. We also performed subgroup analyses according to patient ethnicities (Caucasian or Asian) and tumor stages (stage I, II, and III). I2 index was calculated to estimate the heterogeneity among trials, as the higher the I2, the more significant the heterogeneity. Values of I2=50% represent a dividing point between low and high heterogeneity. When I2 ≤50%, we assumed that there was no significant heterogeneity between pooled data. Correspondingly, I2 >50 was treated as significant heterogeneity. Moreover, based on the I2 index, we choose a different model in analysis: the Mantel-Haenszel (M-H) fixed-effects model set should be used to analysis datasets at low statistical inconsistency and the DerSimonian and Laird (D-L) random-effects model should be used for datasets showing obvious heterogeneity. In our meta-analysis, we used the M-H fixed-effect model to test the heterogeneity first, and then choose different models based on the testing results. SMDs were calculated with each model within 95% confidence intervals. Forest plots were generated to summarize the results. Potential publication bias was assessed by Begg’s funnel plots and Egger’s test. All reported p-values were from two-sided tests.
Results
To systematically study the association between the levels of CA15-3 and CEA in the serum with the risk of breast cancer, we performed a meta-analysis of a total of 13 eligible case-control studies, the main characteristics of which are shown in Table 1. These studies involved a total of 1179 cases and 493 controls. Among them, there are 13 studies of CA15-3 and 7 studies of CEA. For ethnicity distribution, there were 5 studies in Asians and 8 studies in Caucasians.
Table 1.
Characteristics of studies included in the meta-analysis.
| Author | Year | Country | Ethnicity | Description | No. of patients (case/control) | Age (average) | CA15-3-method | CEA-method |
|---|---|---|---|---|---|---|---|---|
| Zeng | 2013 | China | Asian | Malignant | 100/64 | 51.4 | MEIA, Abbott AxSYM | MEIA, Abbott AxSYM |
| Rashad | 2013 | Egypt | Caucasian | Malignant | 80/10 | 49.6 | ELISA, MyBioSource | |
| Atoum | 2012 | Jordan | Caucasian | Benign & malignant | 91/45 | MEIA, Abbott AxSYM | ||
| Porika | 2010 | India | Caucasian | Stage I,II & III | 153/38 | 44.9 | ELISA, Antuos | ELISA, Antuos |
| Metwally | 2010 | Egypt | Caucasian | Malignant | 44/21 | 36 | MEIA, Abbott AxSYM | |
| Samy | 2010 | Egypt | Caucasian | Stage I & II | 89/40 | ELISA, CIS Bio International | ELISA, Quorum | |
| Agha-Hosseini | 2009 | Iran | Caucasian | Malignant | 26/35 | 42.6 | ELISA, CanAg | |
| Thriveni | 2007 | India | Caucasian | Stage I & II, III & IV | 207/75 | ELISA, Calbiotech | ELISA | |
| Qin | 2007 | China | Asian | Malignant | 67/24 | ELISA | ELISA | |
| Huang | 2005 | China | Asian | Malignant | 63/25 | 53.4 | IRMA | |
| Zhang | 2005 | China | Asian | Malignant | 66/44 | 47 | CLIA, Bayer | CLIA, Bayer |
| Zheng | 2005 | China | Asian | Benign & malignant | 130/30 | 45 | ELISA, CanAg | ELISA, CanAg |
| Streckfus | 2000 | USA | Caucasian | Benign & malignant | 63/42 | 50.8 | ELISA, CIS Bio International |
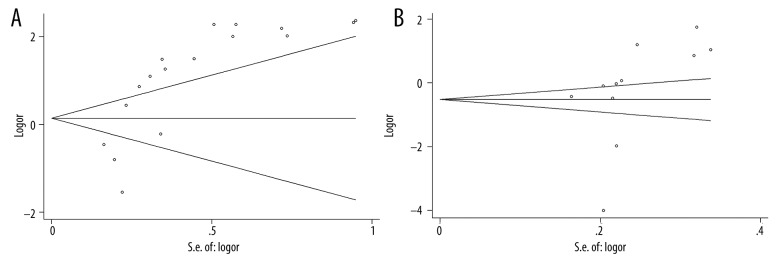
The results of the meta-analysis are shown in Table 2. We found that the I2 was larger than 90% in all 3 groups (malignant tumor with CA15-3 marker, malignant tumor with CEA marker, and benign tumor with CA15-3 marker), suggesting statistically significant heterogeneity in all cases. Given the large I2 indexes, the random-effects model was used for further calculating standardized mean difference (SMD) and 95% confidence interval (CI) calculation. Forest plots for each group are shown in Figure 2. From the analysis, we found significant associations between the levels of CA15-3 and CEA with breast cancer susceptibility for malignant tumors (CA15-3: SMD=2.15, 95% CI (2.00–2.30), p-value=1.8×10⁻⁸, Figure 2A; CEA: SMD=1.23, 95% CI (1.09–1.36), p-value=1.8×10⁻²¹, Figure 2B). These results indicate that the levels of CA15-3 and CEA in the serum were significantly associated with the risk of developing malignant breast cancer. However, further analysis revealed that there was no significant association between the level of CA15-3 with breast cancer susceptibility for benign tumors (CA15-3: SMD=0.17, 95% CI (−0.21–0.38), p-value=0.382, Figure 2C). For publication bias, we noticed that Egger’s test of the CA15-3 level in malignant tumors and Begg’s test of the CEA level in benign tumors demonstrated slightly significant bias. The funnel plots of each group are shown in Figure 3.
Table 2.
Results of meta-analysis for CA15-3 and CEA using malignant and benign tumor database.
| Biomarker | Analysis method | Heterogeneity | Odd ratio (OR) | Publication bias | |||||
|---|---|---|---|---|---|---|---|---|---|
| I2 (%) | p-value | Overall | Lower | Upper | p-value | Begg | Egger | ||
| Malignant | |||||||||
| CA15-3 | Random | 98.6 | 3.7×10⁻³⁰ | 2.15 | 2.00 | 2.30 | 1.8×10⁻¹⁰ | 0.149 | 1.0×10⁻⁵ |
| CEA | Random | 97.4 | 3.1×10⁻²⁵ | 1.23 | 1.09 | 1.36 | 1.8×10⁻²¹ | 0.020 | 0.149 |
| Benign** | |||||||||
| CA15-3 | Random | 98.8 | 2.2×10⁻¹⁸ | 0.17 | −0.21 | 0.54 | 0.382 | –* | –* |
Results are not available because there were too few studies;
Analysis on CEA was not performed due to the lack of studies.
Figure 2.
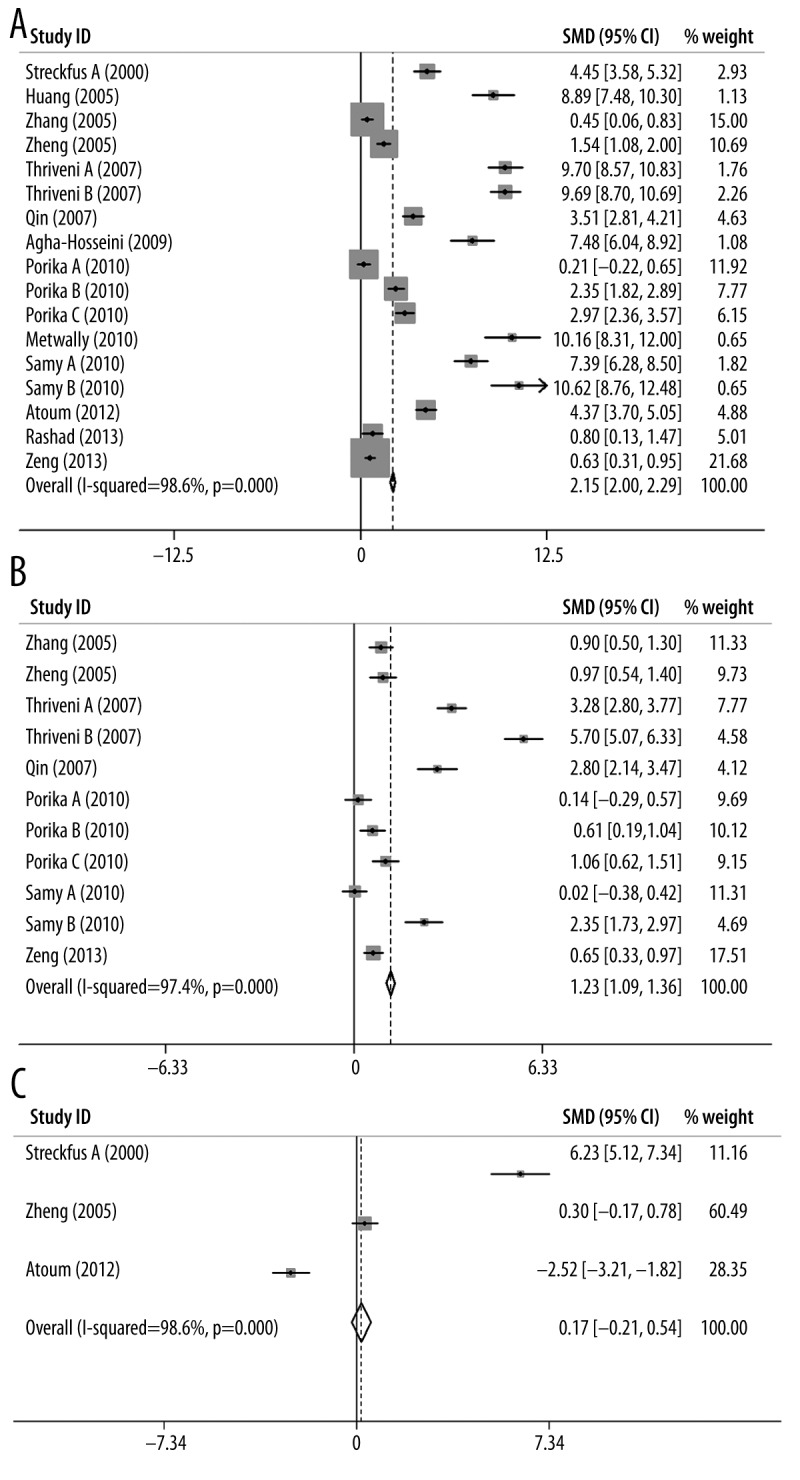
Forest plots of (A) CA15-3 for malignant tumor, (B) CEA for malignant tumor, and (C) CA15-3 for benign tumor.
Figure 3.
Funnel plots of (A) CA15-3 for malignant tumor and (B) CEA for malignant tumor.
We performed subgroup meta-analyses for CA15-3 and CEA with respect to Caucasian and Asian populations, and the results are shown in Table 3. Based on the information from the above analyses, only the malignant tumors database was used in this section. Generally, the I2 indexes were still very large (>90% in all cases) for all analyses, indicating a significant heterogeneity in these comparison models (p-values <0.05). Due to these results, a random-effects model was used for assessing the association in the analysis. The forest plots of CA15-3/CEA for Caucasian and Asian populations are shown in Figures 4 and 5, respectively. From these results, we found that both CA15-3 and CEA were significantly associated with breast cancer, regardless of ethnicity (CA15-3 (Caucasian): SMD=3.23, 95% CI (3.01–3.45), p-value=9.6×10⁻²⁷, Figure 4A; CA15-3 (Asian): SMD=1.19, 95% CI (0.98–1.39), p-value=2.1×10⁻²⁵, Figure 4B; CEA (Caucasian): SMD=1.40, 95% CI (1.22–1.58), p-value=1.3×10⁻¹⁸, Figure 5A; CEA (Asian): SMD=1.00, 95% CI (0.79–1.20), p-value=1.2×10⁻²⁰, Figure 5B). These results indicate that the levels of CA15-3 and CEA in serum can be used to effectively predict breast cancer susceptibility and provide a useful prognosis for breast cancer detection.
Table 3.
Results of subgroup meta-analysis for CA15-3 and CEA using Caucasian and Asian database.
| Biomarker | Caucasian | Asian | ||||||
|---|---|---|---|---|---|---|---|---|
| I2 (%) | ph* | OR (95%CI) | pOR** | I2 (%) | ph* | OR (95%CI) | pOR** | |
| CA15-3 | 98.5 | 1.6×10⁻³² | 3.23 (3.01–3.45) | 9.6×10⁻²⁷ | 97.8 | 3.1×10⁻¹⁹ | 1.19 (0.98–1.39) | 2.1×10⁻²⁵ |
| CEA | 98.2 | 6.5×10⁻³⁰ | 1.40 (1.22–1.58) | 1.3×10⁻¹⁸ | 91.0 | 1.6×10⁻⁷ | 1.00 (0.79–1.20) | 1.2×10⁻²⁰ |
P-value from heterogeneity test;
P-value from OR test.
Figure 4.
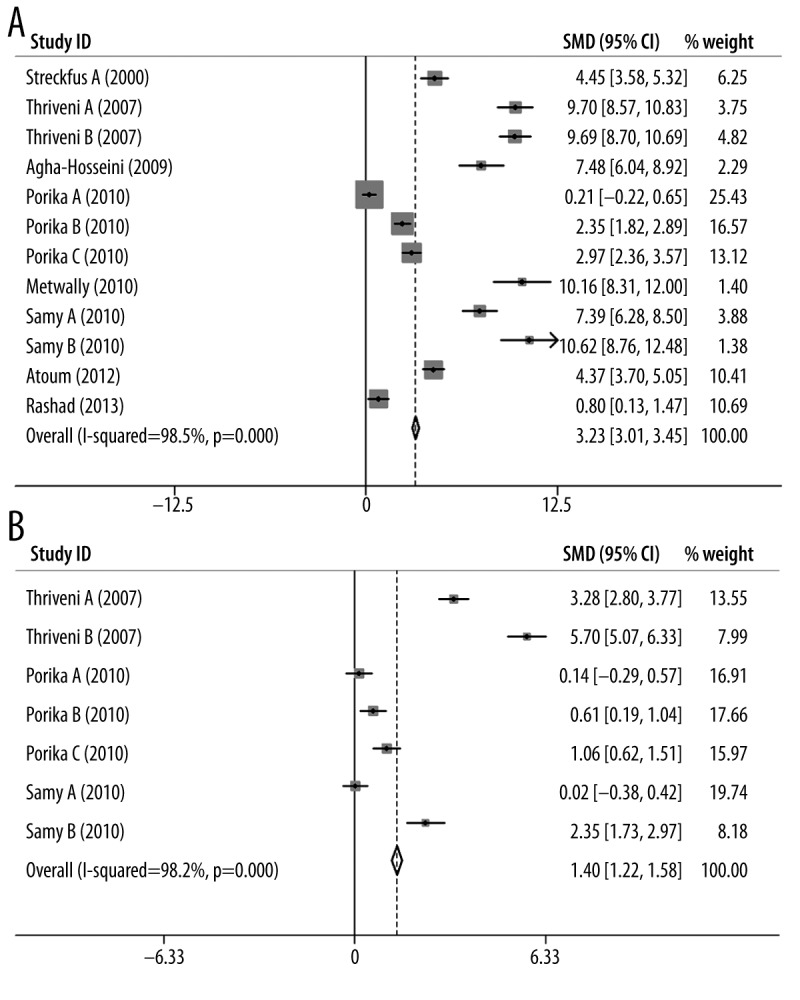
Forest plots of CA15-3 for (A) Caucasian population and (B) Asian population.
Figure 5.
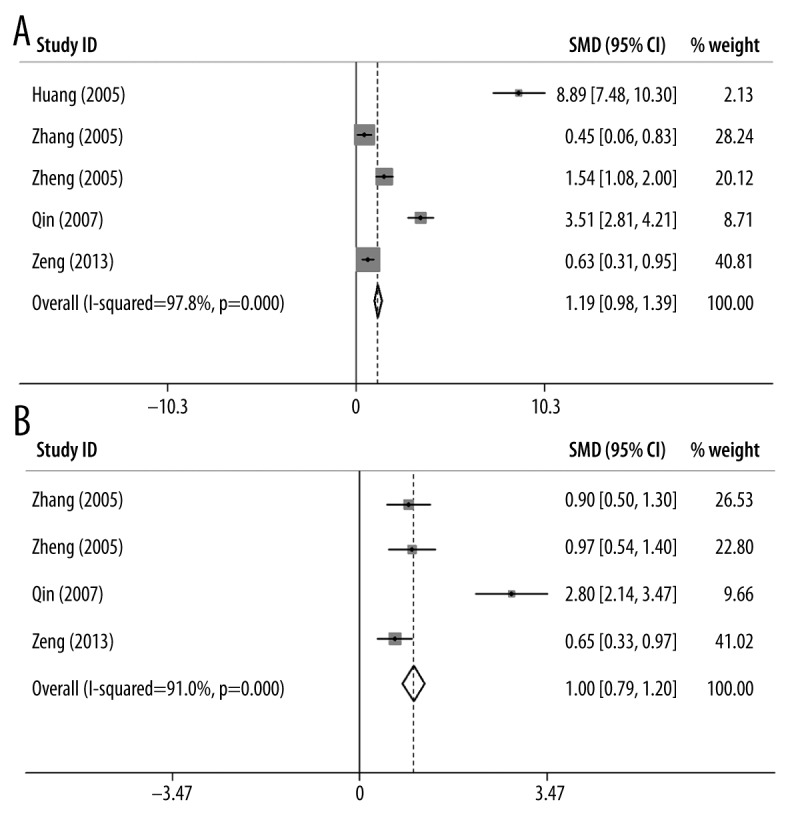
Forest plots of CEA for (A) Caucasian population and (B) Asian population.
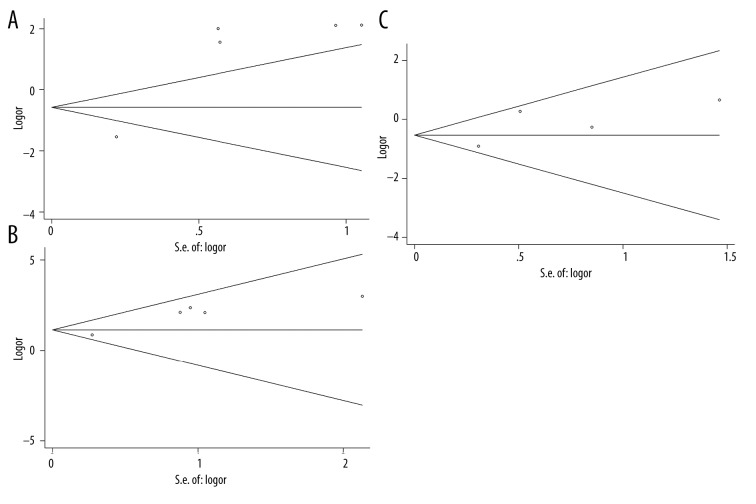
Similar to the strategy detailed above, we performed subgroup meta-analyses for CA15-3 in terms of different tumor clinical stages (stage I, II, and III), and the results are shown in Table 4. Again, we found significant heterogeneity in these subgroup analyses (P-values <0.05). The forest plots of all 3 stages are shown in Figure 6. Based on the meta-analysis, CA15-3 is significantly associated with breast cancer in all stratified stages (Stage I: SMD=2.03, 95% CI (1.66–2.40), p-value=9.8×10⁻²⁷, Figure 6A; Stage II: SMD=3.88, 95% CI (3.40–4.35), p-value=5.1×10−41, Figure 6B; Stage III: SMD=5.12, 95% CI (4.63–5.61), p-value=6.7×10−48, Figure 6C). Although all malignant tumors show elevated levels of CA15-3, we noticed that the level of CA15-3 keeps increasing as the breast tumor progresses. These results suggest that the level of CA15-3 might be more efficient for monitoring advanced tumors than early diagnosis. On the other hand, for publication bias, only statistically significant biases were observed for stage I and II in Egger’s test with explicit database stratification. The funnel plots are shown in Figure 7.
Table 4.
Results of subgroup meta-analysis for CA15-3 using stage I, II, and III database.
| Tumor stage | Analysis method | Heterogeneity | OR | Publication bias | |||||
|---|---|---|---|---|---|---|---|---|---|
| I2 (%) | p-value | Overall | Lower | Upper | p-value | Begg | Egger | ||
| Stage I | Random | 98.4 | 2.7×10⁻²³ | 2.03 | 1.66 | 2.40 | 9.8×10⁻²⁷ | 0.806 | 0.029 |
| Stage II | Random | 97.7 | 2.7×10⁻¹⁹ | 3.88 | 3.40 | 4.35 | 5.1×10−41 | 1.000 | 0.010 |
| Stage III | Random | 98.2 | 1.0×10⁻²⁶ | 5.12 | 4.63 | 5.61 | 6.7×10−48 | 0.734 | 0.308 |
Figure 6.
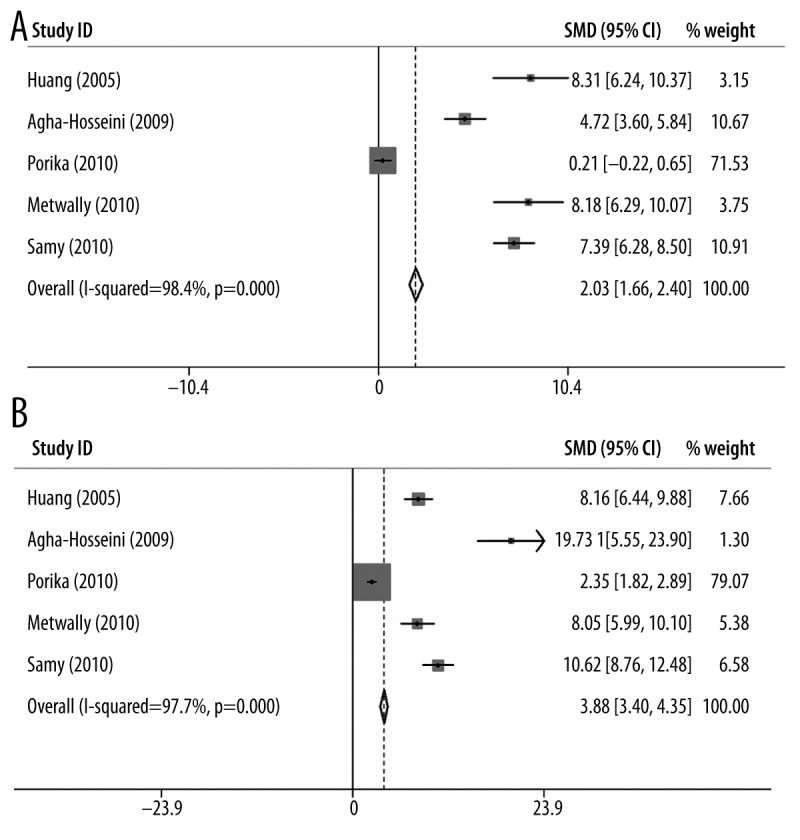
Forest plots of CA15-3 for (A) stage I, (B) stage II and (C) stage III tumor.
Figure 7.
Funnel plots of CA15-3 for (A) stage I, (B) stage II and (C) stage III tumor.
Discussion
Several different tumor-specific antigens are usually generated by tumor cells or by host cells in response to tumorigenesis. These unique antigens are termed tumor markers and can be used in cancer screening and monitoring. The sensitivity and specificity of an individual tumor marker may be low, but the combination of multiple tumor markers can be very helpful as a clinical tool in oncology. CA15-3 and CEA are frequently used in clinical treatment of breast cancer [10–23]. In this study, we investigated the associations between serum levels of CA15-3 and CEA with breast cancer susceptibility by a systematic meta-analysis. We found significantly elevated serum levels of CA15-3 and CEA in patients with malignant breast cancer, but not in those with benign tumors. Further subgroup analyses involving patients with malignant tumors showed that both Caucasian and Asian populations had a similar significant association. In addition, we found that the level of CA15-3 is greatly associated with tumor stages. However, Gion et al. reported that there was no difference in CA15-3 expression between benign tumors and stage I and II [24]. Moazzezy et al. also reported that CA15-3 and CEA serum levels were independent of the breast cancer staging [25]. However, the sample size in this study was small: only 30 patients and 30 controls, which may not be able to represent the population accurately. In contrast to these and consistent with our results, Uehara et al. found that breast cancer stage II patients with normal CA15-3 levels had a better prognosis than those with elevated CA15-3 levels [6]. Sutterlin et al. also reported significant differences in CA15-3 expression levels between those in benign tumors and those in stage III and IV [26]. The inconsistency could come from different sensitivities of detecting CA15-3 levels in different studies. It is also possible that differences in the age, BMI, tumor size, menopause status, lifestyle, environment, and other variables between different patients may affect the tumor marker levels. Hence, elevated CA15-3 levels may be one factor that predicts a poor prognosis. In addition, a heterogeneous disease such as breast cancer may require combining multiple biomarkers to allow the detection of different subtypes.
Despite our consistent results, there are some limitations in this study. First, the patients included in this study had an average age between 36 and 53.4 years old, with most between 40 and 50 years old. As use of traditional tools such as mammography increase more dramatically for the older people, and the probability of over-diagnosis also usually increases with age, the biomarker screening for breast cancer would really benefit women over 55 years old. Therefore, in the context of an aging society, more research is needed to fully understand the natural history of breast cancer and to improve its screening and treatment in older age groups. Secondly, the 13 studies in our analysis used different methods/assays to test CA15-3 and CEA levels, including 11 for CA15-3: MEIA, Abbott AxSYM, ELISA, MyBioSource, Antuos, CIS Bio International, CanAg, Calbiotech, IRMA, CLIA and Bayer, and 8 for CEA: MEIA, Abbott AxSYM, ELISA, Antuos, Quorum, CLIA, Bayer and CanAg. Previous research compared 3 different CA15-3 assay kits (the manual IRMA Centocor and 2 fully automated methods, the ELISA-Boehringer Mannheim-ES300 and the Abbott IMx) and showed that they have different sensitivity and could yield inconsistent results [27,28]. Positive rates of the IRMA CA15-3 did not show any significant variations related to stage, while CA15-3 levels obtained by both ELISA and Abbott assays showed higher values in stage I than in stage II patients [27,28]. Therefore, it may be necessary to find a uniform method to screen for CA15-3 and CEA levels. As diagnostic and clinical techniques improve, tumor markers will likely become more important in cancer screening and treatment.
Conclusions
In this study, we presented a meta-analysis investigating the associations between serum levels of CA15-3 and CEA with breast cancer susceptibility. A total of 13 studies, including 1179 cases and 493 controls, were involved in our analysis, which shows that serum levels of CA15-3 and CEA are potential biomarkers for breast cancer monitoring. Specifically, we found statistically significant elevated levels of serum CA15-3 and CEA in the patients with malignant breast tumors, but not in the patients with benign tumors. Further subgroup analyses focusing on patients with malignant tumors showed that both Caucasian and Asian populations demonstrated a similar significant association. When stratified by the clinical stage, we noticed that although malignant tumors in all stages show elevated levels of CA15-3, the level of CA15-3 is greatly associated with the tumor stage, meaning that the level of CA15-3 becomes higher as the breast tumor stage progresses. This study clarifies the inconsistent conclusions from multiple studies, and provides a precise estimation for clinical values of 2 important biomarkers in breast cancer monitoring. We believe our study will shed light on future breast cancer research.
Footnotes
Conflict of interest
The author(s) declare that they have no competing interests.
Source of support: Science and Technology Project of Chengdu (2014-HM01-00097-SF) and Natural Science Foundation of China (No. 81102621)
References
- 1.Greenlee RT, Murray T, Bolden S, Wingo PA. Cancer statistics, 2000. Cancer J Clin. 2000;50(1):7–33. doi: 10.3322/canjclin.50.1.7. [DOI] [PubMed] [Google Scholar]
- 2.Stewart BW, Wild C International Agency for Research on Cancer, World Health Organization. World cancer report. 2014. [Google Scholar]
- 3.Taplin S, Abraham L, Barlow WE, et al. Mammography facility characteristics associated with interpretive accuracy of screening mammography. J Natl Cancer Inst. 2008;100(12):876–87. doi: 10.1093/jnci/djn172. [DOI] [PMC free article] [PubMed] [Google Scholar]
- 4.Mandelblatt JS, Cronin KA, Bailey S, et al. Effects of mammography screening under different screening schedules: model estimates of potential benefits and harms. Ann Intern Med. 2009;151(10):738–47. doi: 10.1059/0003-4819-151-10-200911170-00010. [DOI] [PMC free article] [PubMed] [Google Scholar]
- 5.O’Hanlon DM, Kerin MJ, Kent P, et al. An evaluation of preoperative CA 15-3 measurement in primary breast carcinoma. Br J Cancer. 1995;71(6):1288–91. doi: 10.1038/bjc.1995.249. [DOI] [PMC free article] [PubMed] [Google Scholar]
- 6.Uehara M, Kinoshita T, Hojo T, et al. Long-term prognostic study of carcinoembryonic antigen (CEA) and carbohydrate antigen 15-3 (CA 15-3) in breast cancer. Int J Clin Oncol. 2008;13(5):447–51. doi: 10.1007/s10147-008-0773-3. [DOI] [PubMed] [Google Scholar]
- 7.Thompson JA, Grunert F, Zimmermann W. Carcinoembryonic antigen gene family: molecular biology and clinical perspectives. J Clin Lab Anal. 1991;5(5):344–66. doi: 10.1002/jcla.1860050510. [DOI] [PubMed] [Google Scholar]
- 8.Gendler SJ. MUC1, the renaissance molecule. J Mammary Gland Biol Neoplasia. 2001;6(3):339–53. doi: 10.1023/a:1011379725811. [DOI] [PubMed] [Google Scholar]
- 9.Roy LD, Sahraei M, Subramani DB, et al. MUC1 enhances invasiveness of pancreatic cancer cells by inducing epithelial to mesenchymal transition. Oncogene. 2011;30(12):1449–59. doi: 10.1038/onc.2010.526. [DOI] [PMC free article] [PubMed] [Google Scholar]
- 10.Agha-Hosseini F, Mirzaii-Dizgah I, Rahimi A. Correlation of serum and salivary CA15-3 levels in patients with breast cancer. Med Oral Patol Oral Cir Buca. 2009;14(10):e521–24. doi: 10.4317/medoral.14.e521. [DOI] [PubMed] [Google Scholar]
- 11.Atoum M, Nimer N, Abdeldayem S, Nasr H. Relationships among Serum CA15-3 tumor marker, TNM staging, and estrogen and progesterone receptor expression in benign and malignant breast lesions. Asian Pac J Cancer Prev. 2012;13(3):857–60. doi: 10.7314/apjcp.2012.13.3.857. [DOI] [PubMed] [Google Scholar]
- 12.Metwally FM, El-mezayen HA, Ahmed HH. Significance of vascular endothelial growth factor, interleukin-18 and nitric oxide in patients with breast cancer: Correlation with carbohydrate antigen 15.3. Med Oncol. 2011;28(Suppl 1):S15–21. doi: 10.1007/s12032-010-9657-2. [DOI] [PubMed] [Google Scholar]
- 13.Park BW, Oh JW, Kim JH, et al. Preoperative CA 15-3 and CEA serum levels as predictor for breast cancer outcomes. Ann Oncol. 2008;19(4):675–81. doi: 10.1093/annonc/mdm538. [DOI] [PubMed] [Google Scholar]
- 14.Rashad YA, Elkhodary TR, El-Gayar AM, Eissa LA. Evaluation of serum levels of HER2, MMP-9, nitric oxide, and total antioxidant capacity in Egyptian breast cancer patients: Correlation with clinico-pathological parameters. Sci Pharm. 2014;82(1):129–45. doi: 10.3797/scipharm.1306-18. [DOI] [PMC free article] [PubMed] [Google Scholar]
- 15.Samy N, Ragab HM, El Maksoud NA, Shaalan M. Prognostic significance of serum Her2/neu, BCL2, CA15-3 and CEA in breast cancer patients: A short follow-up. Cancer Biomark. 2010;6(2):63–72. doi: 10.3233/CBM-2009-0119. [DOI] [PubMed] [Google Scholar]
- 16.Zeng RC, Zhang W, Yan XQ, et al. Down-regulation of miRNA-30a in human plasma is a novel marker for breast cancer. Med Oncol. 2013;30(1):477. doi: 10.1007/s12032-013-0477-z. [DOI] [PubMed] [Google Scholar]
- 17.Thriveni K, Krishnamoorthy L, Ramaswamy G. Correlation study of Carcino Embryonic Antigen & Cancer Antigen 15.3 in pretreated female breast cancer patients. Indian journal of clinical biochemistry: IJCB. 2007;22(1):57–60. doi: 10.1007/BF02912882. [DOI] [PMC free article] [PubMed] [Google Scholar]
- 18.Porika M, Malotu N, Veldandi UK, et al. Evaluation of tumor markers in southern Indian breast cancer patients. Asian Pac J Cancer Prev. 2010;11(1):157–59. [PubMed] [Google Scholar]
- 19.Zheng H, Luo RC. [Diagnostic value of combined detection of TPS, CA153 and CEA in breast cancer]. Di Yi Jun Yi Da Xue Xue Bao. 2005;25(10):1293–94. 1298. [PubMed] [Google Scholar]
- 20.Streckfus C, Bigler L, Dellinger T, et al. The presence of soluble c-erbB-2 in saliva and serum among women with breast carcinoma: A preliminary study. Clin Cancer Res. 2000;6(6):2363–70. [PubMed] [Google Scholar]
- 21.Huang Y, Zheng X, Huang S, et al. Expression and significance of P53 and CA153 in patients with breast carcinoma. Chin J Lab Diagn. 2005:2005–2. [Google Scholar]
- 22.Qin Jiyong, Li Kangming, He Juyun, Li Y. Clinical value of tumor marker CA15-3 in diagnosis and treatment of breast carcinoma. Xiandai Zhongliu Yixue. 2007;15(4) [Google Scholar]
- 23.Zhang J, Chen L, Yao Y, Chen Z. Diagnostic value of combined detection of serum CA15-3, CEA, SF contents in patients with breast cancer. J Radioimmunology. 2005:2005–1. [Google Scholar]
- 24.Gion M, Mione R, Leon AE, et al. CA27.29: A valuable marker for breast cancer management. A confirmatory multicentric study on 603 cases. Eur J Cancer. 2001;37(3):355–63. doi: 10.1016/s0959-8049(00)00396-8. [DOI] [PubMed] [Google Scholar]
- 25.Moazzezy N, Farahany TZ, Oloomi M, Bouzari S. Relationship between preoperative serum CA 15-3 and CEA levels and clinicopathological parameters in breast cancer. Asian Pac J Cancer Prev. 2014;15(4):1685–88. doi: 10.7314/apjcp.2014.15.4.1685. [DOI] [PubMed] [Google Scholar]
- 26.Sutterlin M, Bussen S, Trott S, Caffier H. Predictive value of CEA and CA 15-3 in the follow up of invasive breast cancer. Anticancer Res. 1999;19(4A):2567–70. [PubMed] [Google Scholar]
- 27.Bon GG, von Mensdorff-Pouilly S, Kenemans P, et al. Clinical and technical evaluation of ACS BR serum assay of MUC1 gene-derived glycoprotein in breast cancer, and comparison with CA 15-3 assays. Clin Chem. 1997;43(4):585–93. [PubMed] [Google Scholar]
- 28.Lynch DM, Rogers PE, Love JC, et al. Clinical evaluation comparing AxSYM CA 15-3, IMx CA 15-3 and Truquant BRTM RIA. Tumour Biol. 1998;19(6):421–38. doi: 10.1159/000030034. [DOI] [PubMed] [Google Scholar]


