

Abstract
Long noncoding RNAs (lncRNAs) may play an important role in Alzheimer's disease (AD) pathogenesis. However, despite considerable research in this area, the comprehensive and systematic understanding of lncRNAs in AD is still limited. The emergence of RNA sequencing provides a predictor and has incomparable advantage compared with other methods, including microarray. In this study, we identified lncRNAs in a 7-month-old mouse brain through deep RNA sequencing using the senescence-accelerated mouse prone 8 (SAMP8) and senescence-accelerated mouse resistant 1 (SAMR1) models. A total of 599,985,802 clean reads and 23,334 lncRNA transcripts were obtained. Then, we identified 97 significantly upregulated and 114 significantly downregulated lncRNA transcripts from all cases in SAMP8 mice relative to SAMR1 mice. Gene ontology (GO) and Kyoto Encyclopedia of Genes and Genomes analyses revealed that these significantly dysregulated lncRNAs were involved in regulating the development of AD from various angles, such as nerve growth factor term (GO: 1990089), mitogen-activated protein kinase signaling pathway, and AD pathway. Furthermore, the most probable AD-associated lncRNAs were predicted and listed in detail. Our study provided the systematic dissection of lncRNA profiling in SAMP8 mouse brain and accelerated the development of lncRNA biomarkers in AD. These attracting biomarkers could provide significant insights into AD therapy in the future.
Keywords: AD, LncRNAs, RNA sequencing
Introduction
Alzheimer's disease (AD), the most common dementia in the elderly, is a progressive neurodegenerative disorder.1,2,3,4 According to a report, the number of AD patients is estimated to double every 5-year interval beyond age 65.5 According to experts, two types of AD exist. Sporadic AD is the most common case (~95%) and shows no apparent genetic elements.6 By contrast, familial AD comprises <5% of all cases and is associated with gene mutations.7 With the elusive etiology of AD, few therapeutic options are available to prevent or reverse AD. The protocols targeting Aβ and neurofibrillary tangles, which are the two main neuropathological hallmarks in AD, have been unsuccessful.8 Thus, more frontier views are needed for AD therapy.
Currently, noncoding RNAs (ncRNAs) and AD have drawn increasing attention among researchers.9,10,11 As an important posttranscriptional pathogenesis of AD, ncRNAs and their associated orchestrated networks are implicated in mediating complex pathological mechanisms of AD, including brain development, neuron maintenance, inflammation, regulation of tau and Aβ, and stress responses.12 Long noncoding RNAs (lncRNAs), typically >200 nucleotides long, is the most abundant class of ncRNAs.13 LncRNAs are presumed to perform a wide range of functions, such as X-inactivation, maintenance of pluripotency, posttranscriptional regulation, and disease prevention.14,15,16,17,18 Several of the well-studied lncRNAs were proven to be associated with AD. Faghihi et al.19 reported that BACE1-AS exhibited a key role in regulating BACE1 and in driving pathology. Strong scientific evidence indicates that BCYRN1 was expressed and participated in cell dentritic regulation.20 The interaction between lncRNA 51A and SORL1 would affect Aβ formation.21 However, our understanding of AD-associated lncRNAs is limited only on preliminary explorations. In addition, Lee et al.22 concluded that lncRNA was differentially expressed in 3xTg-AD compared with the control mice using microarray. However, this analysis is insufficient to gain a comprehensive and systematic understanding of lncRNAs in AD. Microarray analysis suffers from excessive noise, depends on fully annotated genes, and cannot detect novel isoform levels compared with RNA sequencing.23,24,25,26 Meanwhile, 3xTg-AD is a class of transgenic mice, which may simply represent the uncommon familial AD.
In this study, we utilized the RNA sequencing approach to investigate lncRNAs in the brain of senescence-accelerated mouse prone 8 (SAMP8) and senescence-accelerated mouse resistant 1 (SAMR1) mice at the 7-month-old stage using Illumina HiSeq Mice 4000 Technology. The SAMP8 strain is a naturally derived model and shares cognitive, behavioral, and neuropathological alterations observed in aged humans, proposed as a plausible model for exploring the complexity of AD.27,28,29 SAMR1 is widely used as a control strain.30 Our study is designed to systematically identify lncRNAs potentially involved in AD and provides a valuable resource to explore their functional roles in AD therapy.
Results
Learning and memory deficits in the SAMP8 mouse model
We used the Morris water maze test to examine the learning and memory deficits in SAMP8 of 7-month-old mice. Figure 1a shows that the mean escape latency of SAMP8 mice was significantly increased compared with SAMR1 mice (P < 0.01). After the place navigation test, we detected their memory retention and spatial exploration ability using the spatial probe test. The SAMR1 mice searched the target quadrant intently, whereas the SAMP8 mice swam randomly in the tank without knowing the target location (Figure 1b). The number of crossings of SAMP8 mice was significantly less than those of SAMR1 mice (P < 0.01, Figure 1c). Moreover, SAMP8 mice spent less time in the target quadrant than the SAMR1 mice (Figure 1d). No significant difference was observed in swimming speed between the two groups (P > 0.05, Figure 1e), implying that the altered exploration of SAMP8 mice was not due to motor and visual dysfunctions. These data revealed that the 7-month-old SAMP8 mice had severe learning and memory impairments, which are the core clinical features observed in AD patients.
Figure 1.

Learning and memory deficits in senescence-accelerated mouse prone 8 (SAMP8) mice. Morris water maze test was conducted in SAMP8 and senescence-accelerated mouse resistant 1 (SAMR1) mice at 7 months of age (n = 8/group). (a) Mean escape latency in the place navigation test (days 1–5). (b) Swimming paths in the probe trial test. (c) Number of crossings in the probe trial test. (d) Time spent in the target quadrant in the probe trial test. (e) Average swimming speeds of mice in the visible-platform test. *P < 0.05.
RNA sequencing roundup
A total of 619,062,690 raw reads were generated using the Illumina HiSeq 4000 Platform. Then, we discarded these reads with poly-N >10%, adapters, and any other contaminants. A total of 599,985,802 clean reads were obtained. We mapped the clean reads to the latest mouse reference genome (ftp://ftp.Ensemble.org/pub/release-81/gtf/mus_musculus/), and the mapping rate was 70.72% and 83.55% in SAMP8 and SAMR1 mice, respectively. The Cufflinks results indicated that 104,051 transcripts were assembled. These transcripts were used for subsequent analysis.
Identification of lncRNAs in SAMP8 and SAMR1 mice brains
Considering the first three basic conditions (≥200 nt, ≥2 exon count, and ≥3 reads coverage), the unqualified transcripts were discarded. Then, the remaining transcripts were blasted with known mouse lncRNAs, known classes of RNAs (tRNA, rRNA, snRNA, snoRNA, pre-miRNA, and pseudogenes), and protein-coding genes. Taken together, 8,422 known mouse lncRNAs corresponding to 6,300 lncRNA genes were detected and 19,423 presumed lncRNAs were detected. The software programs CPC, CNCI, PFAM, and phyloCSF were used to further confirm these 19,423 presumed lncRNAs. Finally, 14,912 novel lncRNAs corresponding to 8,217 lncRNA genes were identified (Figure 2), including 12,376 lincRNAs, 1,057 antisense lncRNAs, and 1,479 intronic lncRNAs. Overall, a total of 23,334 lncRNAs (8,422 known mouse lncRNAs and 14,912 novel lncRNAs) were yielded. In addition, 76,787 protein-coding transcripts were also identified. The 23,334 lncRNA and 76,787 protein-coding gene transcripts were subjected to further analysis.
Figure 2.

Coding potential analysis. In this Venn diagram, four tools were selected to analyze the coding potential of long noncoding RNAs (lncRNAs), which includes CPC, CNCI, PFAM, and phyloCSF. LncRNAs simultaneously shared by the four tools were designated as candidates for subsequent analyses.
Characteristic comparison of lncRNAs and mRNAs
In this study, we described the characteristics (gene structure, expression, and sequence conservation) of the obtained 23,334 lncRNAs and 76,787 messenger RNAs (mRNAs). Our results indicated that most of lncRNAs tend to contain fewer exons (two or three) than mRNAs (Figure 3a). The distribution of transcript length was obviously different. The average length of lncRNAs was shorter than that of mRNAs (Figure 3b). The lncRNAs in our dataset tend to be shorter in open reading frame length than mRNAs (Figure 3c). In addition, lncRNAs exhibited a lower level of expression than mRNAs (Figure 3d), and the conservatism of lncRNAs was significantly lower than that of mRNAs (Figure 3e). Our results were observed to be consistent with previous studies.31,32,33
Figure 3.

Comparison of the identified long noncoding RNAs (lncRNAs) and mRNAs in our study. (a) Distribution of the number of exons in the mRNAs and lncRNAs. (b) Distribution of transcript lengths in the mRNAs and lncRNAs. (c) Distribution of open reading frame lengths in the mRNAs and lncRNAs. (d) Expression level analysis in the mRNAs and lncRNAs. (e) Conservative analysis of sequence in mRNAs and lncRNAs.
Differential expression analysis: SAMP8 versus SAMR1
The expression level of lncRNA and mRNA transcripts was estimated by fragments per kilobase of exon per million fragments mapped. As a result, a total of 211 lncRNA transcripts were differentially expressed in SAMP8 mice relative to SAMR1 mice (Supplementary Table S1), including 97 upregulated transcripts and 114 downregulated transcripts (P < 0.05). The 211 differentially expressed transcripts corresponded to 204 lncRNA genes. Cluster analysis of differentially expressed lncRNAs was revealed by a heat map. Three samples in the SAMP8 group were clustered together, and the other three samples in the SAMR1 group were also clustered together (Figure 4a). Meanwhile, 2,505 significantly dysregulated mRNA transcripts were identified: 1,486 were upregulated, whereas 1,019 were downregulated in SAMP8 mice (Supplementary Table S2, P < 0.05). Cluster analysis of differentially expressed mRNAs showed the same pattern with lncRNAs using a heat map (Figure 4b).
Figure 4.

Cluster analysis by using heat map. (a) Cluster analysis of differentially expressed long noncoding RNAs (lncRNAs) (b) Cluster analysis of differentially expressed mRNAs. Red indicated an increased expression, and blue indicated a decreased expression.
qPCR confirmation
Among the significantly dysregulated lncRNA and mRNA transcripts, 10 were randomly selected to validate the data of RNA sequencing using quantitative polymerase chain reaction (qPCR), including 2 mRNAs, 3 known lncRNAs, and 5 novel lncRNAs. Figure 5 shows that all of the selected mRNA and lncRNA transcripts were detected and exhibited significant differential expression in SAMP8 and SAMR1 mice. These results were consistent with RNA sequencing data.
Figure 5.

Validation of transcript expression by quantitative polymerase chain reaction (qPCR). Mouse β-actin gene is used as a housekeeping internal control. Transcript expression was quantified relative to the expression level of β-actin using the comparative cycle threshold (ΔCT) method. The data were presented as the mean ± SE (n = 3). *P < 0.05.
Functional enrichment analysis: GO and KEGG
First, the potential targets of lncRNAs were predicted in cis. Taking 100 kb as the cutoff, we determined that 165 out of 204 differentially expressed lncRNA genes corresponded to 678 protein-coding genes (Supplementary Table S3). Through gene ontology (GO) survey, 154 GO terms were significantly enriched (Supplementary Table S4, P < 0.01). The top five terms were intracellular organelle (GO: 0043229), organelle (GO: 0043226), intracellular (GO: 0005622), intracellular membrane-bounded organelle (GO: 0043231), and intracellular part (GO: 0044424). Importantly, we also observed several AD-associated terms, such as response to nerve growth factor (GO: 1990089), nerve growth factor signaling pathway (GO: 0038180), and glial cell development (GO: 0021782). A total of 11 significantly enriched Kyoto Encyclopedia of Genes and Genomes (KEGG) pathways (Supplementary Table S5, P < 0.05) were detected. Of these pathways, mitogen-activated protein kinase (MAPK) signaling pathway, antigen processing and presentation, AD pathway, and FoxO signaling pathway were related to AD. Taken together, the cis results showed that protein-coding genes were regulated by their neighboring lncRNAs involved in AD.
Then, based on Pearson's correlation coefficients (|r| > 0.95), 39 out of 204 differentially expressed lncRNA genes that corresponded to 367 protein-coding genes were observed using trans analysis (Supplementary Table S6). Our results showed that 58 GO terms were significantly enriched (Supplementary Table S7, P < 0.01), and several terms were closely related to AD, including G-protein coupled receptor activity (GO: 0004930), G-protein coupled receptor signaling pathway (GO: 0007186), neurological system process (GO: 0050877), and ketone body metabolic process (GO: 1902224). By contrast, the KEGG results revealed 17 significantly enriched pathways (Supplementary Table S8, P < 0.05). The AD-associated pathways were also detected, including steroid hormone biosynthesis, AD pathway, synthesis and degradation of ketone bodies, and antigen processing and presentation. Overall, lncRNAs could regulate protein-coding genes associated with AD through trans.
Finally, GO and KEGG analyses were performed on 2,505 significantly dysregulated mRNAs. As the results, we derived 810 highly enriched GO terms (Supplementary Table S9, P < 0.01) and 15 significantly enriched pathways (Supplementary Table S10, P < 0.05). These results were also reflected in AD, such as the four pathways (i.e., oxidative phosphorylation, AD, antigen processing and presentation, and peroxisome proliferator-activated receptor signaling pathway) and several GO terms (e.g., GO: 0043005, GO: 0002682, GO: 0051591, and GO: 0019882).
Association study
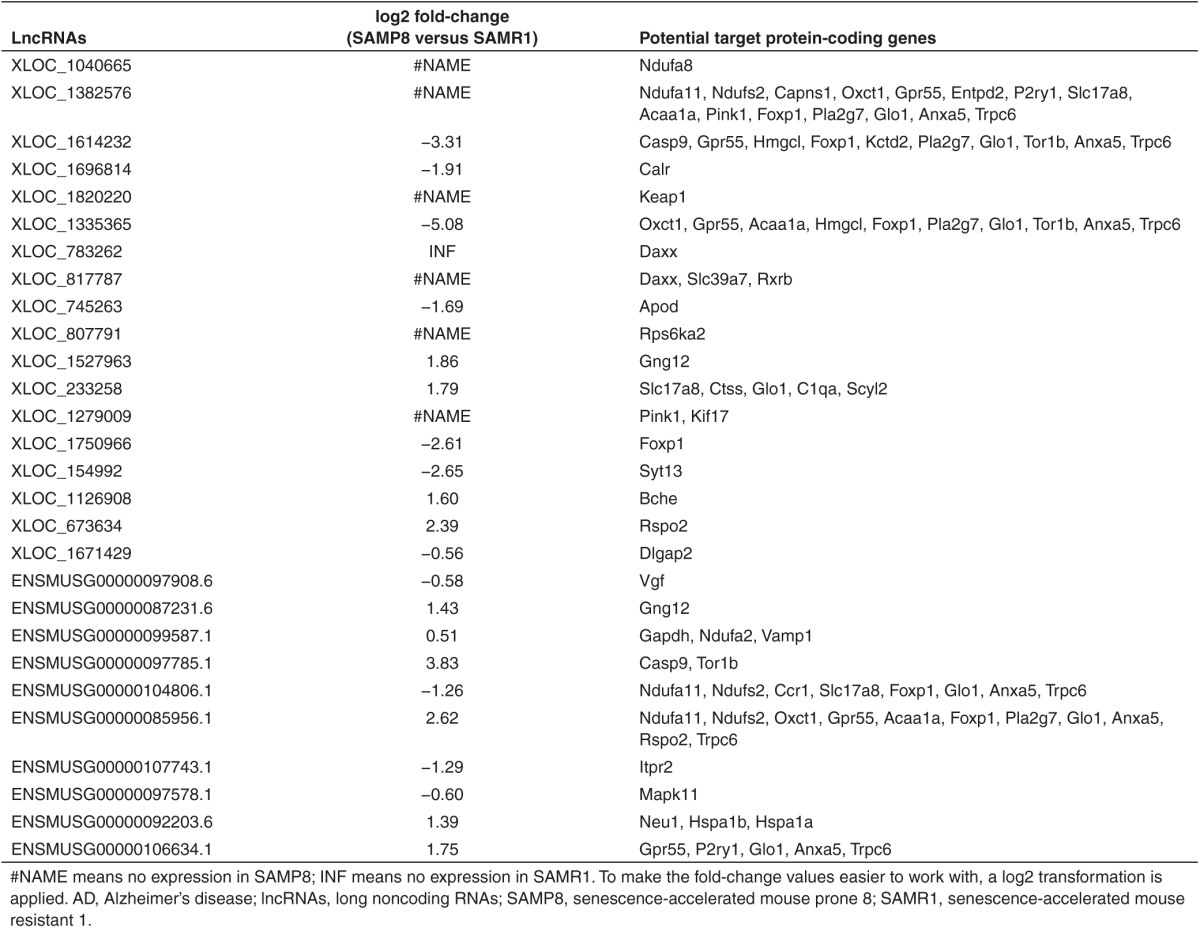
To deepen our understanding of the relationship between lncRNAs and AD, first, we selectively analyzed pairs, in which the lncRNAs and their target genes were significantly differentially expressed between SAMP8 and SAMR1. At the same time, another requirement was that the selected pairs should be associated with AD. According to these standards, the fulfilled pairs were detected. For example, Gapdh, a significantly dysregulated AD-associated gene, was regulated by ENSMUSG00000099587.1. ENSMUSG00000097785.1 and XLOC_1614232 acted on Casp9 simultaneously. A group of lncRNAs, including ENSMUSG00000104806.1, ENSMUSG00000085956.1, and XLOC_1382576, targeted Ndufa11 and Ndufs2. More results are listed in Table 1. We predicted that these lncRNAs were most probably involved in the adjustment of AD. However, the clear function of these predicted lncRNAs required additional verification.
Table 1. LncRNAs: the valuable markers and potential therapeutic targets to treat AD.
Discussion
AD was described for the first time 110 years ago.34 However, no adequate treatment or cure is yet available for this disease. Accumulating studies indicate that the complex mechanisms of AD in the human brain require a coordinated posttranscriptional regulatory network of genes. Based on this finding, ncRNAs are likely to be important factors. LncRNAs are among the least well-understood ncRNAs and considered to be longer than 200 bp.13,35 The lncRNAs seem to have a relationship with AD, but current research in this area is still superficial. In addition to Lee's research,22 Zhou et al.36 identified AD-associated lncRNAs by reannotation of microarray data. These studies provided several hints, but cannot provide more detailed insights and may lack comprehensive assessment. RNA sequencing, as a next-generation technology, has opened up the possibility to investigate the AD-associated lncRNAs in unprecedented detail. Considering the difficulty of obtaining human tissue samples, an appropriate animal model is necessary to understand the pathogenic mechanisms of AD. The 7-month-old SAMP8 mice developed severe deficits in learning and memory, and our Morris water maze experiment confirmed it. The mice are relatively “old” in their average life span of 12 months and can be considered a valid animal model of AD.28 In our study, the primary goal was to identify AD-associated lncRNAs as much as possible in the 7-month-old SAMP8 mice using RNA sequencing. According to the results, these known or novel lncRNAs may constitute potential candidates for future application of preventing and treating AD.
First, we identified a total of 23,334 multiple-exon lncRNAs in SAMP8 and SAMR1 mice brains using Illumina HiSeq 4000 Platform, including 8,422 known and 14,912 novel lncRNAs. According to the statistics, 23,334 lncRNAs transcripts corresponded to 14,517 lncRNA genes. Alternative splicing cases are obviously observed within the 14,517 lncRNA genes. Marquardt et al.37 reported that altered splicing of lncRNA genes could quantitatively modulate gene expression involved in many physiological processes. We predicted that this phenomenon may play functional roles in AD pathogenesis. In addition, the 23,334 identified lncRNAs showed fewer exons, shorter length, average open reading frame length, lower expression level, and are less conservative than mRNAs. The same characteristics were also detected in humans, pigs, and other mammals.31,32,33,38 The common factor of lncRNAs in mammals perhaps indicates their important roles in regulation, control, and guidance. Our RNA-seq datasets also displayed 76,787 protein-coding transcripts between the two groups. Furthermore, the mRNAs could be used as auxiliary materials to explore the AD-associated lncRNAs.
Second, we measured differential lncRNA expression between SAMP8 and SAMR mice at 7 months of age. A total of 211 dysregulated lncRNA transcripts, transcripted from 204 lncRNA genes, were detected. Then, we focused on the 211 lncRNAs and predicted their potential function in AD. Based on previous experience,31 the interactions of protein-coding genes and lncRNAs were determined through cis or trans. In fact, AD is a multifactorial disease, and many theories have been advanced as to its cause. These theories include Aβ deposition, tau neuropathology, synapse injury, oxidative stress, neuron loss, immune system dysfunction, and mitochondrial dysfunction.39 Notably, GO functional annotation analysis showed that they were enriched in “response to nerve growth factor,” “nerve growth factor signaling pathway,” “glial cell development,” “G-protein coupled receptor activity,” “G-protein coupled receptor signaling pathway,” “ketone body metabolic process,” and “neurological system process” terms. All of these terms were related to AD pathogenesis. Other important findings were the enriched pathways, including “MAPK signaling pathway,” “antigen processing and presentation,” “Alzheimer's disease pathway,” “FoxO signaling pathway,” “steroid hormone biosynthesis,” and “synthesis and degradation of ketone bodies.” These KEGG pathways were all involved in AD control. Without question, a close relationship between the 211 dysregulated lncRNAs and AD was observed.
Third, we analyzed pairs in which the lncRNAs and their target genes were significantly dysregulated and then further refined the closest results. In fact, these altered pairs identified in our study were highly relevant to AD. Significantly, the mitochondrial function is altered in AD, and multiple genes participate in this process. Four NADH dehydrogenase-related genes, namely, Ndufa2, Ndufa8, Ndufa11, and Ndufs2, were strongly regulated by XLOC_1040665, XLOC_1382576, ENSMUSG00000099587.1, ENSMUSG00000104806.1, and ENSMUSG00000085956.1. Apod, a risk gene of AD,40 was targeted by XLOC_745263. Neu1, another risk gene of AD,41 was targeted by ENSMUSG00000092203.6. In addition, many altered pairs were involved in AD-associated signaling pathways. For example, MAPK11, one of the four p38 MAPKs that play an important role in MAPK signaling, was targeted by ENSMUSG00000097578.1. More results are summarized in detail and given in Table 1. Notably, one lncRNA can control multiple AD-associated genes. In particular, XLOC_1382576 was correlated with the expression of 15 genes. By contrast, one AD-associated gene could be regulated together by several lncRNAs. For example, Trpc6 was targeted by XLOC_1614232, XLOC_1382576, XLOC_1335365, ENSMUSG00000104806.1, ENSMUSG00000085956.1, and ENSMUSG00000106634.1. In fact, in contrast to mRNA sequences that may indicate function, the sequence motifs of lncRNA are usually uninformative for predicting function.31 The functional roles of lncRNAs are highly complex and diverse. Therefore, our ongoing effort will focus on the function of these most likely lncRNAs, expecting to provide more fundamental information in understanding their regulatory mechanisms in AD on the molecular level. This endeavor is going to be an enormous challenge for many years to come.
Furthermore, the accuracy of RNA sequencing was measured by qPCR in our study. Ten differentially expressed transcripts were randomly selected and used for testing. Ultimately, we determined that all results were consistent with RNA-seq data, which proved the reliability of RNA-seq and laid a solid foundation for further exploration.
This study provided a catalog of SAMP8 mice brain lncRNAs for further understanding of their regulation roles in AD pathogenesis. Along with its application in other diseases, lncRNAs have become effective therapeutic targets. Perhaps, these potential lncRNAs in our study can be regarded as new biomarkers for AD and provide the basis for earlier detection or effective therapy. Regardless, this strategy will provide an invaluable resource for the clinical treatment of AD.
Materials and methods
Animal and tissue collection. Three-month-old SAMP8 mice (n = 15) and 3-month-old SAMR1 mice (n = 15) were purchased from Beijing WTLH Biotechnology, Beijing, China. The mice were housed one per cage with standard environment (22 ± 2 °C, 45–55% humidity, and 12 hours light/dark cycle) and allowed to obtain diet freely until 7 months old. Eight animals of each group were randomly selected for Morris water maze. We also selected three animals from each group and gave them general anesthesia for the collection of the cerebral cortex. These tissues were immediately stored in a liquid nitrogen jar for RNA sequencing. All the animal experiments followed the “Guide for the care and use of laboratory animals” and were approved by the Institutional Animal Care and Use Committee of Beijing Normal University.
Behavioral studies. Morris water maze was used to evaluate the spatial learning and memory of the mice as previously described.42,43 Briefly, in the place navigation test (days 1–5), we placed a platform at the center of one suppositive quadrant. Two trials per day were administered for five consecutive days. For each training trial, the mice were placed into the maze from four assigned points and allowed to swim for 90 seconds. The escape latency was recorded by software upon mounting the platform. However, if the mice failed to find the platform within the stipulated time, then the escape latency was regarded as 90 seconds. In the spatial probe test (day 6), we removed the platform and released the mice from the opposite quadrant. Then, the mice were allowed to swim freely for 60 seconds. In the visible-platform test (day 7), we raised the platform above the water surface, and each mouse was given four trials. All experiments were conducted at approximately the same time of each day.
Total RNA extraction, library preparation, and sequencing. TRIzol reagent (Invitrogen, Carlsbad, CA) was used to isolate the total RNA of each sample. The purity, concentration, and integrity of RNA were checked using the NanoPhotometer spectrophotometer (IMPLEN, Westlake Village, CA), the Qubit RNA Assay Kit in Qubit 2.0 Fluorometer (Life Technologies, Carlsbad, CA), and the RNA Nano 6000 Assay Kit of the Bioanalyzer 2100 System (Agilent Technologies, Santa Clara, CA), respectively.
In this study, a total of six complementary DNA (cDNA) libraries were constructed, i.e., three for SAMP8 mice and another three for SAMR1 mice. We utilized 3 µg RNA per sample as input material for RNA sample preparation. First, we removed the ribosomal RNA by Epicentre Ribo-Zero rRNA Removal Kit (Epicentre, Madison, WI) and cleaned the rRNA-free residue by ethanol precipitation. Second, rRNA-depleted RNA by NEBNext Ultra Directional RNA Library Prep Kit for Illumina (NEB, Ipswich, MA) was used to create sequencing libraries. Then, random hexamer primer and M-MuLV Reverse Transcriptase (RNaseH−) were used to synthesize the first-strand cDNA. Second-strand cDNA was synthesized subsequently using DNA Polymerase I and RNase H. NEBNext Adaptor with hairpin loop structure was ligated to prepare for hybridization, after adenylation of the 3′ ends of DNA fragments. For the purpose of selecting cDNA fragments of preferentially 150–200 bp in length, the library fragments were purified with AMPure XP System (Beckman Coulter, Beverly, MA). Finally, the products were purified (AMPure XP System) and the Agilent Bioanalyzer 2100 System was selected to assess the library quality. After we completed the clustering of the index-coded samples, which was performed on a cBot Cluster Generation System using the TruSeq PE Cluster Kit v3-cBot-HS (Illumina), the libraries were sequenced at the Novogene Bioinformatics Institute (Beijing, China) on an Illumina HiSeq 4000 Platform, and 150 bp paired-end reads were generated.
Quality analysis, mapping, and transcriptome assembly. Clean reads were obtained by removing reads containing adapter or poly-N and low-quality reads from raw data through in-house perl scripts. Q20, Q30, and GC contents of the clean reads were calculated. All the downstream analyses were based on the good-quality clean reads. Paired-end clean reads were mapped to the mouse genome sequence (ftp://ftp.ensembl.org/pub/release-81/gtf/mus_musculus/) with TopHat v2.0.9.44,45 The mapped reads of each sample were assembled by Cufflinks v2.1.1.46
LncRNA identification. LncRNAs were identified following six steps: (i) Cuffcompare software was used to combine all assembled transcripts.47 (ii) Transcripts were removed if <200 bp in length or less than two exons. (iii) Cufflinks v2.1.1 was used to calculate the reads coverage of each transcript, and those with less than three reads coverage were removed. (iv) Cuffcompare software was used to compare the transcripts and known mouse lncRNAs. The qualified lncRNAs were immediately classified in our results as known lncRNAs. We also discarded those transcripts that belong to tRNA, rRNA, snoRNA, snRNA, pre-miRNA, and pseudogenes. (v) The remaining transcripts were blasted with known mRNA and completed the preliminary screening. (vi) The coding potential of transcripts was assessed by four types of software, namely, CNCI, CPC, PFAM, and phyloCSF.48,49,50,51 Transcripts without coding potential were defined as novel lncRNAs. We selected the novel lncRNAs and known lncRNAs as the final results. In addition, the novel lncRNAs were grouped into three subtypes (i.e., lincRNA, intronic lncRNA, and antisense lncRNA) using information of class_code (http://coLetrapnelllabio/cufflinks/cuffcompare/index.Html#transfrag-classcodes).
Conservative analysis of lncRNAs. phyloFit and phastCons are two important statistical programs in the Phast (v1.3) package. phyloFit was used to compute phylogenetic models for conserved and nonconserved regions among species to analyze the sequence conservation of transcripts. Then, with these models, phastCons was used to compute a set of conservation scores of lncRNAs and coding genes.52
Expression analysis. We calculated the fragments per kilobase of exon per million fragments mapped of the transcripts using Cuffdiff (v2.1.1) to evaluate the expression levels of lncRNAs and protein-coding genes in each sample.46 Transcripts with P value <0.05 was described as differentially expressed between SAMP8 and SAMR1.
qPCR. The results of RNA sequencing were validated by qPCR. qPCR was performed using the SYBR green assay (TaKaRa Biotechnology, Dalian, China) on a Roche LightCycler 480 machine (Roche Applied Science, Mannheim, Germany). The specific quantitative primers for 10 transcripts are listed in Supplementary Table S11. In addition, the primers of β-actin gene were designed as an endogenous control. The 25 µl reaction volume contained 8.5 µl H2O, 1 µl of each primer, 2 µl cDNA, and 12.5 µl of 2× RealMasterMix (TaKaRa Biotechnology). The conditions were as follows: 95 °C for 30 seconds, followed by 40 cycles (95 °C for 5 seconds and 60 °C for 30 seconds). Each experiment was performed in triplicate.
Target gene prediction. In this study, cis and trans analyses were used to predict the target genes of lncRNAs. Briefly, the coding genes 100 K upstream and downstream of lncRNAs were searched as cis role results. The trans role of lncRNA was to identify each other by the expression level, and the results with Pearson's correlation coefficients (|r| > 0.95) were selected.
GO and KEGG enrichment analyses. GO enrichment analysis was applied to target genes of lncRNAs by the GOseq R package.53 In addition, the differentially expressed protein-coding genes were also analyzed using GO. GO terms with P value <0.05 were considered significantly enriched.
The KEGG database is used to understand the high-level functions and utilities of the biological system. Therefore, we used KOBAS software to detect the enrichment of lncRNA target genes or differentially expressed protein-coding genes in KEGG pathways.54 Hypergeometric P value <0.05 was considered significant.
Statistical analysis. The statistical difference was analyzed using the SPSS (version 20.0). All data were shown as the means ± SEM. Significance was accepted at P < 0.05. Briefly, the escape latency in the Morris water maze test was compared by applying two-way analysis of variance. Student's t-test was used to compare the qPCR results and the rest data of the Morris water maze test.
SUPPLEMENTARY MATERIAL Table S1. Significantly differentially expressed lncRNA transcripts in SAMP8 and SAMR1 mice. Table S2. Significantly differentially expressed mRNA transcripts in SAMP8 and SAMR1 mice. Table S3. Target prediction of significantly differentially expressed lncRNAs in cis (100 K). Table S4. GO enrichment analysis of the cis target genes. Table S5. KEGG enrichment analysis of the cis target genes. Table S6. Target prediction of significantly differentially expressed lncRNAs in trans. Table S7. GO enrichment analysis of the trans target genes. Table S8. KEGG enrichment analysis of the trans target genes. Table S9. GO enrichment analysis of the significantly dysregulated mRNAs. Table S10. KEGG enrichment analysis of the significantly dysregulated mRNAs. Table S11. Primers used in qPCR analysis.
Acknowledgments
We thank all contributors of this study. We also thank Lu Xiao and his colleagues at Novogene (Beijing) for assistance in data processing. This work was supported by grants from the National Natural Science Foundation of China (No. 81274118), the Key New Drug Creation and Development Program of China (No. 2012ZX09103-201), and the Fundamental Research Funds for the Central Universities.
Supplementary Material
References
- Braak, H and Del Trecidi, K (2015). Neuroanatomy and pathology of sporadic Alzheimer's disease. Adv Anat Embryol Cell Biol 215: 1–162. [PubMed] [Google Scholar]
- Yaari, R and Corey-Bloom, J (2007). Alzheimer's disease. Semin Neurol 27: 32–41. [DOI] [PubMed] [Google Scholar]
- Gualdi, GF, Colaiacomo, MC, Bertini, L, Melone, A, Rojas, M and Di Biasi, C (2004). Neuroimaging of Alzheimer disease: current role and future potential. Clin Ter 155: 429–438. [PubMed] [Google Scholar]
- Zou, Z, Liu, C, Che, C and Huang, H (2014). Clinical genetics of Alzheimer's disease. Biomed Res Int 2014: 291862. [DOI] [PMC free article] [PubMed] [Google Scholar]
- American National Institutes of Health (2013). Dementia: Hope Through Research. NIH Publication No.13–2252.http://www.ninds.nih.gov/disorders/dementias/detail_dementia.htm
- Cheng, XR, Zhou, WX and Zhang, YX (2014). The behavioral, pathological and therapeutic features of the senescence-accelerated mouse prone 8 strain as an Alzheimer's disease animal model. Ageing Res Rev 13: 13–37. [DOI] [PubMed] [Google Scholar]
- Bhat, NR (2010). Linking cardiometabolic disorders to sporadic Alzheimer's disease: a perspective on potential mechanisms and mediators. J Neurochem 115: 551–562. [DOI] [PMC free article] [PubMed] [Google Scholar]
- Selkoe, DJ (2011). Resolving controversies on the path to Alzheimer's therapeutics. Nat Med 17: 1060–1065. [DOI] [PubMed] [Google Scholar]
- Calero, M, Gómez-Ramos, A, Calero, O, Soriano, E, Avila, J and Medina, M (2015). Additional mechanisms conferring genetic susceptibility to Alzheimer's disease. Front Cell Neurosci 9: 138. [DOI] [PMC free article] [PubMed] [Google Scholar]
- Schonrock, N and Götz, J (2012). Decoding the non-coding RNAs in Alzheimer's disease. Cell Mol Life Sci 69: 3543–3559. [DOI] [PMC free article] [PubMed] [Google Scholar]
- Zhao, Y, Alexandrov, PN and Lukiw, WJ (2016). Anti-microRNAs as novel therapeutic agents in the clinical management of Alzheimer's disease. Front Neurosci 10: 59. [DOI] [PMC free article] [PubMed] [Google Scholar]
- Tan, L, Yu, JT, Hu, N and Tan, L (2013). Non-coding RNAs in Alzheimer's disease. Mol Neurobiol 47: 382–393. [DOI] [PubMed] [Google Scholar]
- Mercer, TR, Dinger, ME and Mattick, JS (2009). Long non-coding RNAs: insights into functions. Nat Rev Genet 10: 155–159. [DOI] [PubMed] [Google Scholar]
- Bischoff, SR, Tsai, SQ, Hardison, NE, Motsinger-Reif, AA, Freking, BA, Nonneman, DJ et al. (2013). Differences in X-chromosome transcriptional activity and cholesterol metabolism between placentae from swine breeds from Asian and Western origins. PLoS One 8: e55345. [DOI] [PMC free article] [PubMed] [Google Scholar]
- Mercer, TR, Dinger, ME and Mattick, JS (2009). Long non-coding RNAs: insights into functions. Nat Rev Genet 10: 155–159. [DOI] [PubMed] [Google Scholar]
- Wu, P, Zuo, X, Deng, H, Liu, X, Liu, L and Ji, A (2013). Roles of long noncoding RNAs in brain development, functional diversification and neurodegenerative diseases. Brain Res Bull 97: 69–80. [DOI] [PubMed] [Google Scholar]
- Wapinski, O and Chang, HY (2011). Long noncoding RNAs and human disease. Trends Cell Biol 21: 354–361. [DOI] [PubMed] [Google Scholar]
- Zhou, Y, Wu, K, Jiang, J, Huang, J, Zhang, P, Zhu, Y et al. (2015). Integrative analysis reveals enhanced regulatory effects of human long intergenic non-coding RNAs in lung adenocarcinoma. J Genet Genomics 42: 423–436. [DOI] [PubMed] [Google Scholar]
- Faghihi, MA, Modarresi, F, Khalil, AM, Wood, DE, Sahagan, BG, Morgan, TE et al. (2008). Expression of a noncoding RNA is elevated in Alzheimer's disease and drives rapid feed-forward regulation of beta-secretase. Nat Med 14: 723–730. [DOI] [PMC free article] [PubMed] [Google Scholar]
- Mus, E, Hof, PR and Tiedge, H (2007). Dendritic BC200 RNA in aging and in Alzheimer's disease. Proc Natl Acad Sci USA 104: 10679–10684. [DOI] [PMC free article] [PubMed] [Google Scholar]
- Ciarlo, E, Massone, S, Penna, I, Nizzari, M, Gigoni, A, Dieci, G et al. (2013). An intronic ncRNA-dependent regulation of SORL1 expression affecting Aβ formation is upregulated in post-mortem Alzheimer's disease brain samples. Dis Model Mech 6: 424–433. [DOI] [PMC free article] [PubMed] [Google Scholar]
- Lee, DY, Moon, J, Lee, ST, Jung, KH, Park, DK, Yoo, JS et al. (2015). Distinct expression of long non-coding RNAs in an Alzheimer's disease model. J Alzheimers Dis 45: 837–849. [DOI] [PubMed] [Google Scholar]
- White, RR, Milholland, B, MacRae, SL, Lin, M, Zheng, D and Vijg, J (2015). Comprehensive transcriptional landscape of aging mouse liver. BMC Genomics 16: 899. [DOI] [PMC free article] [PubMed] [Google Scholar]
- Marioni, JC, Mason, CE, Mane, SM, Stephens, M and Gilad, Y (2008). RNA-seq: an assessment of technical reproducibility and comparison with gene expression arrays. Genome Res 18: 1509–1517. [DOI] [PMC free article] [PubMed] [Google Scholar]
- Wang, Z, Gerstein, M and Snyder, M (2009). RNA-Seq: a revolutionary tool for transcriptomics. Nat Rev Genet 10: 57–63. [DOI] [PMC free article] [PubMed] [Google Scholar]
- SEQC/MAQC-III Consortium (2014). A comprehensive assessment of RNA-seq accuracy, reproducibility and information content by the Sequencing Quality Control Consortium. Nat Biotechnol 32: 903–914. [DOI] [PMC free article] [PubMed] [Google Scholar]
- Takeda, T (2009). Senescence-accelerated mouse (SAM) with special references to neurodegeneration models, SAMP8 and SAMP10 mice. Neurochem Res 34: 639–659. [DOI] [PubMed] [Google Scholar]
- Kang, L, Li, S, Xing, Z, Li, J, Su, Y, Fan, P et al. (2014). Dihydrotestosterone treatment delays the conversion from mild cognitive impairment to Alzheimer's disease in SAMP8 mice. Horm Behav 65: 505–515. [DOI] [PubMed] [Google Scholar]
- Cheng, XR, Zhou, WX and Zhang, YX (2014). The behavioral, pathological and therapeutic features of the senescence-accelerated mouse prone 8 strain as an Alzheimer's disease animal model. Ageing Res Rev 13: 13–37. [DOI] [PubMed] [Google Scholar]
- Dong, WG, Wang, F, Chen, Y, Zheng, XH, Xie, YC, Guo, WQ et al. (2015). Electroacupuncture reduces Aβ production and BACE1 expression in SAMP8 Mice. Front Aging Neurosci 7: 148. [DOI] [PMC free article] [PubMed] [Google Scholar]
- Ren, H, Wang, G, Chen, L, Jiang, J, Liu, L, Li, N et al. (2016). Genome-wide analysis of long non-coding RNAs at early stage of skin pigmentation in goats (Capra hircus). BMC Genomics 17: 67. [DOI] [PMC free article] [PubMed] [Google Scholar]
- Wang, Y, Xue, S, Liu, X, Liu, H, Hu, T, Qiu, X et al. (2016). Analyses of long non-coding RNA and mRNA profiling using RNA sequencing during the pre-implantation phases in pig endometrium. Sci Rep 6: 20238. [DOI] [PMC free article] [PubMed] [Google Scholar]
- Qu, Z and Adelson, DL (2012). Bovine ncRNAs are abundant, primarily intergenic, conserved and associated with regulatory genes. PLoS One 7: e42638. [DOI] [PMC free article] [PubMed] [Google Scholar]
- Ji, Y (2014). A 200-year history of Alzheimer's disease. Chin J Contemp Neurol Neurosurg 3: 156–160. [Google Scholar]
- Mercer, TR, Dinger, ME and Mattick, JS (2009). Long non-coding RNAs: insights into functions. Nat Rev Genet 10: 155–159. [DOI] [PubMed] [Google Scholar]
- Zhou, X and Xu, J (2015). Identification of Alzheimer's disease-associated long noncoding RNAs. Neurobiol Aging 36: 2925–2931. [DOI] [PubMed] [Google Scholar]
- Marquardt, S, Raitskin, O, Wu, Z, Liu, F, Sun, Q and Dean, C (2014). Functional consequences of splicing of the antisense transcript COOLAIR on FLC transcription. Mol Cell 54: 156–165. [DOI] [PMC free article] [PubMed] [Google Scholar]
- Derrien, T, Johnson, R, Bussotti, G, Tanzer, A, Djebali, S, Tilgner, H et al. (2012). The GENCODE v7 catalog of human long noncoding RNAs: analysis of their gene structure, evolution, and expression. Genome Res 22: 1775–1789. [DOI] [PMC free article] [PubMed] [Google Scholar]
- Armstrong, RA (2013). What causes Alzheimer's disease? Folia Neuropathol 51: 169–188. [DOI] [PubMed] [Google Scholar]
- Desai, PP, Hendrie, HC, Evans, RM, Murrell, JR, DeKosky, ST and Kamboh, MI (2003). Genetic variation in apolipoprotein D affects the risk of Alzheimer disease in African-Americans. Am J Med Genet B Neuropsychiatr Genet 116B: 98–101. [DOI] [PubMed] [Google Scholar]
- Annunziata, I, Patterson, A, Helton, D, Hu, H, Moshiach, S, Gomero, E et al. (2013). Lysosomal NEU1 deficiency affects amyloid precursor protein levels and amyloid-β secretion via deregulated lysosomal exocytosis. Nat Commun 4: 2734. [DOI] [PMC free article] [PubMed] [Google Scholar]
- Vorhees, CV and Williams, MT (2006). Morris water maze: procedures for assessing spatial and related forms of learning and memory. Nat Protoc 1: 848–858. [DOI] [PMC free article] [PubMed] [Google Scholar]
- Lv, C, Liu, X, Liu, H, Chen, T and Zhang, W (2014). Geniposide attenuates mitochondrial dysfunction and memory deficits in APP/PS1 transgenic mice. Curr Alzheimer Res 11: 580–587. [DOI] [PubMed] [Google Scholar]
- Trapnell, C, Pachter, L and Salzberg, SL (2009). TopHat: discovering splice junctions with RNA-Seq. Bioinformatics 25: 1105–1111. [DOI] [PMC free article] [PubMed] [Google Scholar]
- Kim, D, Pertea, G, Trapnell, C, Pimentel, H, Kelley, R and Salzberg, SL (2013). TopHat2: accurate alignment of transcriptomes in the presence of insertions, deletions and gene fusions. Genome Biol 14: R36. [DOI] [PMC free article] [PubMed] [Google Scholar]
- Trapnell, C, Williams, BA, Pertea, G, Mortazavi, A, Kwan, G, van Baren, MJ et al. (2010). Transcript assembly and quantification by RNA-Seq reveals unannotated transcripts and isoform switching during cell differentiation. Nat Biotechnol 28: 511–515. [DOI] [PMC free article] [PubMed] [Google Scholar]
- Ran, M, Chen, B, Li, Z, Wu, M, Liu, X, He, C et al. (2016). Systematic identification of long noncoding RNAs in immature and mature porcine testes. Biol Reprod 94: 77. [DOI] [PubMed] [Google Scholar]
- Sun, L, Luo, H, Bu, D, Zhao, G, Yu, K, Zhang, C et al. (2013). Utilizing sequence intrinsic composition to classify protein-coding and long non-coding transcripts. Nucleic Acids Res 41: e166. [DOI] [PMC free article] [PubMed] [Google Scholar]
- Kong, L, Zhang, Y, Ye, ZQ, Liu, XQ, Zhao, SQ, Wei, L et al. (2007). CPC: assess the protein-coding potential of transcripts using sequence features and support vector machine. Nucleic Acids Res 35(Web Server issue): W345–W349. [DOI] [PMC free article] [PubMed] [Google Scholar]
- Mistry, J, Bateman, A and Finn, RD (2007). Predicting active site residue annotations in the Pfam database. BMC Bioinformatics 8: 298. [DOI] [PMC free article] [PubMed] [Google Scholar]
- Lin, MF, Jungreis, I and Kellis, M (2011). PhyloCSF: a comparative genomics method to distinguish protein coding and non-coding regions. Bioinformatics 27: i275–i282. [DOI] [PMC free article] [PubMed] [Google Scholar]
- Siepel, A, Bejerano, G, Pedersen, JS, Hinrichs, AS, Hou, M, Rosenbloom, K et al. (2005). Evolutionarily conserved elements in vertebrate, insect, worm, and yeast genomes. Genome Res 15: 1034–1050. [DOI] [PMC free article] [PubMed] [Google Scholar]
- Young, MD, Wakefield, MJ, Smyth, GK and Oshlack, A (2010). Gene ontology analysis for RNA-seq: accounting for selection bias. Genome Biol 11: R14. [DOI] [PMC free article] [PubMed] [Google Scholar]
- Mao, X, Cai, T, Olyarchuk, JG and Wei, L (2005). Automated genome annotation and pathway identification using the KEGG Orthology (KO) as a controlled vocabulary. Bioinformatics 21: 3787–3793. [DOI] [PubMed] [Google Scholar]
Associated Data
This section collects any data citations, data availability statements, or supplementary materials included in this article.