

Abstract
To understand the inhomogeneity of cells in biological systems, there is a growing demand on the capability of characterizing the properties of individual single cells. Since single cell studies require continuous monitoring of the cell behaviors instead of a snapshot test at a single time point, an effective single-cell assay that can support time lapsed studies in a high throughput manner is desired. Most currently available single-cell technologies cannot provide proper environments to sustain cell growth and, for appropriate cell types, proliferation of single cells and convenient, non-invasive tests of single cell behaviors from molecular markers. In this paper we present a highly versatile single-cell assay that can accommodate different cellular types, enable easy and efficient single cell loading and culturing, and be suitable for the study of effects of in-vitro environmental factors in combination with drug screening. One salient feature of the assay is the non-invasive collection and surveying of single cell secretions at different time points, producing unprecedented insight of single cell behaviors based on the biomarker signals from individual cells under given perturbations. Above all, the acquired information is quantitative, for example, measured by the number of exosomes each single cell secretes for a given time period. Therefore, our single-cell assay provides a convenient, low-cost, and enabling tool for quantitative, time lapsed studies of single cell properties.
1. Introduction
Single cell analysis provides information of individual cells that is often lost in measurements of large cell populations. Given the inhomogeneity of cells in biological systems, information from individual cells can be of critical importance in understanding biological processes and disease formation and progression such as variations in gene expression, drug resistance, and cancer metathesis. Several single-cell technologies have been recently reported, including microfluidic devices [1][2][3][4][5], encapsulated droplet platforms [6][7], and printing methods [3][8]. Although these methods can capture single cells, most of them produce atypical environments for cell culture, which can decrease cell viability and alter cell behaviors, thus disrupting single cell studies. To address this issue, people have developed single-cell devices with surface modifications [9][10][11][12][13] to produce environments more compatible with conventional culture. However, these methods are cell specific and do not offer a general platform to support single cell studies of different cell types. Compared to closed systems that impose spatial confinements to cells, technologies that provide open systems allow easier control of cell culture environments (e.g. CO2 level, oxygen level, nutrient and drug additions, etc.) [14] [15] [16][17]. One main challenge here has been on device fabrication and operation such as cell placement; and another challenge has been the lack of high throughput single-cell assay that is versatile enough to support various down-stream processes and analyses such as transfection, cell-cell interactions, time-lapse observations. In this paper, we describe a single cell assay that is applicable to different cell types as a platform technology and offers the throughput, versatility and precision required for quantitative single cell investigations. The device was fabricated by direct lithographic patterning of polydimethylsiloxane (PDMS) material into a mesh to guide cell loading with high throughput and accurate positioning. Subsequent cell culturing and time-lapsed studies were performed in a natural culture environment that allows for harvest of single cell secretions non-invasively. To demonstrate the unique features as a single cell assay, we have used the technology to quantify the rate of exosome secretion by single cells over a period of 24 to 96 hours. Such studies are of biological significance but have never been conducted before due to lack of proper technologies.
Our technology platform supports studies of single cell behaviors such as cell-cell communications, cell-ECM interactions, cytokine secretion, and exsome secretion, to name a few examples. In this paper, we studied single cell exosome secretion to demonstrate the capabilities of the technology because the unique roles of exosomes have been reported in many recent studies [15–25]. Exosomes/microvesicles secreted by tumor or normal cells were found to play important roles in cell-cell signaling [18], tumorigenesis[19], drug resistance[20][21], and organotropic metastasis[22]. Yet exosome isolation [23] and characterization techniques, including advanced methods such as surface plasmon resonance and various microfluidic designs [24][25] [26][27][28], are still unable to associate the properties of exosomes directly with their cell sources up to the resolution level of single cells. The major contribution of this paper is demonstration of a single-cell assay that enables researchers not only to culture and perform time-lapsed studies of single cells but also to “quantify” single cell behaviors with unprecedented precision.
2. Results and Discussion
2.1. Workflow from cell loading to exosome collection
The overall work flow of the single cell assay is shown in Figure 1. We first fabricated a polydimethylsiloxane (PDMS, Sylgard 184, Dow Corning, MI) mesh with a two-dimensional array of through holes (40 μm diameter) using direct lithographic lift-off of the PDMS layer, as shown in Fig. 1(a) and in Fig. 8 for the detailed process flow. This PDMS mesh was tentatively adhered to a glass substrate to form microwells to help to load and guide the positions of single cells, and then removed, at user’s choice, to allow single cell culturing without space restrictions.
Figure 1.
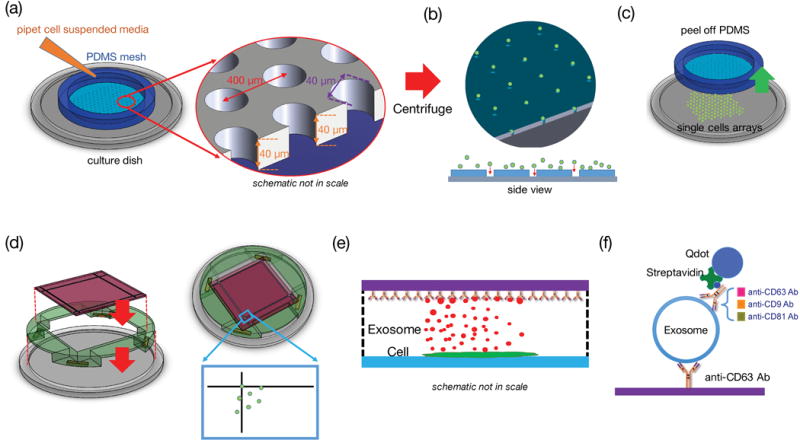
Single-cell assay used for analyzing exosome secretion. (a) Loading single cells onto a culture plate utilizing a PDMS mesh which can be removed afterward. (b) The mesh was removed after cell attachment. (c) A surface functionalized glass slide was placed on the support frame 100 μm above the cells. (d) and (e) The glass slide collected exosomes secreted by the corresponding cells. The fiducials on the cover glass served as registration marks. (f) The captured exosomes were labeled with another biotinylated antibody and streptavidin-conjugated Quantum dots to become visible under fluorescent microscope.
Figure 8.
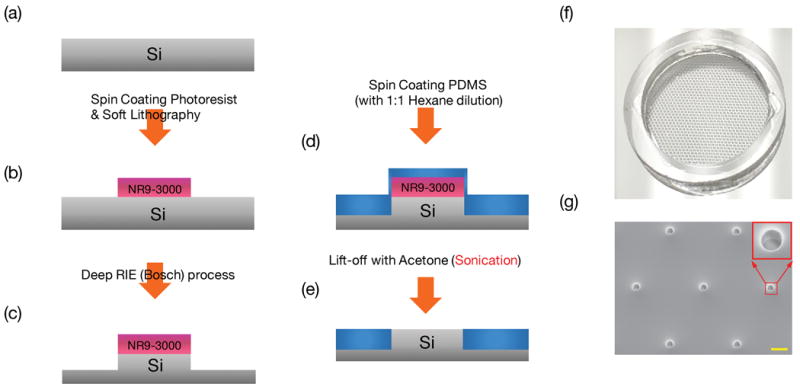
Process flow for fabrication of PDMS mesh to aid cell loading. (a) Prepare a clean Si-wafer (b) Form 6 μm thick photoresist NR9-3000 PY patterns. (c) Using photoresist as mask for Deep RIE process to form 100 μm deep, 40 μm diameter mesas. (d) Spin coat sylgard 184 with 1:1 hexane dilution (e) lift-off the PDMS atop the photoresist with acetone to form PDMS through-holes. (f) Photograph of the PDMS mesh supported by a PDMS ring. (g) SEM micrograph of the PDMS mesh with a 2D array of through holes to aid cell loading. The red square shows the closer view of one hole. The scale bar is 100 μm.
The PDMS mesh was treated with oxygen plasma (100 Walt for 30 seconds) to provide enough bonding strengths with the glass plate to sustain cell loading, but the bonding could be separated by mechanical shear after cell loading. After filling the wells with the culture medium (Fig. 1(a)), the cell suspended medium was added and the device was centrifuged at 140-g for one minute to drive the cells into the wells. The cell-laden sample was then incubated at 37°C for 4–6 hours until cells were attached to the bottom glass. Then one can gently remove the PDMS mesh from the glass substrate without disturbing the cells. The process flow is illustrated in Figure 1.
We subsequently applied a bioprinting method to assay single cells from the position registered single cell array. To collect secretions such as cytokines or vesicles by each individual cells regularly without disturbing the cells, a surface functionalized collection glass slide was placed atop the cells (with a separation of 0.1 mm from the cell surface) without physically touching them. The process design for collection of single cell secretions is illustrated in Fig. 1 (d)–(f). A 2 mm thick CNC machined acrylic fixture was placed on the cell culture glass substrate to define the 0.1mm space between the single cell array and the surface-treated glass slide which collects exosomes secreted by single cells. The collection glass has 30 μm wide fiducial markers that are visible under low power microscopes and cellphone cameras. These fiducial markers served as the references to register the cell sources that produced exosomes captured by the glass slide at designated locations. In the experiment each anti-body treated glass slide captured exosomes secreted by each batch of single cells at certain time point, and those captured exosomes were subsequently labeled with another biotinylated antibody, which was subsequently bonded to streptavidin modified Quantum Dots (Qdots), as shown in Figure 1(f). Using an inverted fluorescent microscope to count quantum dots over each area corresponding to the location of the single cells, one can investigate the properties of exosomes produced by the single cell source. To prove the concept of the single-cell assay, we investigated proteins CD63, CD9, and CD81 on the surface of exosomes. As a platform technology, the method can be used to collect any single cell secretions with specifically treated collection glass slides.
2.2. Characterization of the platform
After cell loading, we waited 4 to 6 hours before removing the PDMS mesh from the cell culture plate to give the cells enough time to anchor on the glass surface. The 2D array of cells was cultured and regularly observed under microscope to monitor cell viability. Fig. 2(a) shows the image of GFP transfected MCF7 cells under 4X objective lens (BE-II 9000, Keyence) after 6 hours since the centrifuge-assisted cell loading and removal of PDMS mesh. About 70% of the positions defined by the PDMS mesh contained single cells, and less than 10% of positions contained two or more cells. The statistic result is shown in Fig. 2 (c). Cell loading efficiency and cell number at each position depend on the size of mesh, packing density of mesh and cell density. Figure 2 (a) shows the experimental results using a PDMS mesh with 40 μm diameter holes with center-to-center spacing of 400 μm under a cell density of 160 cells/μL. These parameters have resulted in good single cell yield and density to support most single-cell studies. Figure 2 (b) shows the image of higher magnification (20X objective) of loaded cells. In this experiment, single cells were cultured up to 96 hours for time lapsed studies, showing that the technology and process can maintain cell viability at single cell levels with the closest neighboring cells being 400 μm apart.
Figure 2.
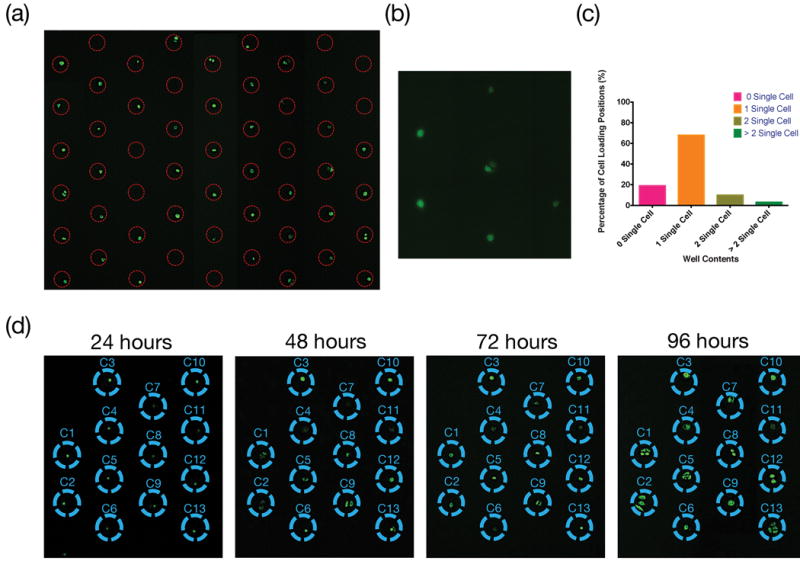
Cell Loading and culturing. (a) Distribution of GFP transfected MDA-MB-231 cells. Image was taken after removing PDMS mesh under 4X objective lens. (b) A higher magnification (20X objective) image of loaded cells. (c) Statistic distribution of cell numbers from 200 positions shown in Fig. 2 (a). (d) Time-lapsed observations of single cell culture. All cells survived and proliferated.
The maximum exosome capturing capacity of the glass slide, immobilized with anti-CD63 Ab, was tested with samples containing a high concentration (~2×10⁴/μL) of exosomes in phosphate buffered saline (PBS) solution. It was determined that within the 110 μm × 150 μm microscopic field of view under 100X objective lens, a maximum number of ~1500 anti-CD63 Ab conjugated Quantum dots (Qdots) can be bonded to the surface, setting the upper limit of detectable density of exosomes. Therefore, in this study we have kept the exosome collection time to 3 hours so that the highest number of Qdots conjugated with exosomes was around 500, which is well within the detection limit. To characterize the spatial resolution of the method and the crosstalk from capture of exosomes secreted by neighboring cells, we have analyzed exosome counts over areas without corresponding cells but with cells in neighboring areas. As shown in Figure 3, the exosome counts in those cell-absent areas were comparable with the counts in the background level due to non-specific binding of QDs, about 25 over the field of view. The results confirmed that about 3% of signal might come from crosstalk caused by exosome diffusion.
Figure 3.

Evaluation of crosstalk due to exosomes secreted by the neighboring sites. The result shows that the crosstalk is slightly above the background level and contributes to about 3% of the signal. The scale bar in the lower picture represents 200μm.
2.3. Single cell exosome secretion rate
Three breast cell lines, MCF10A, MCF7, and MDA-MB-231, were used to measure the exosome secretion rate from each single cell under normal culture condition. The exosome secretion rate by each cell type was obtained by measuring the secretion rate from 8 to 10 individual cells of each type. The number of exosomes for each cell was counted over a field of view of 110 μm × 150 μm, an area that was verified to be large enough to include all exosomes secreted by the singe cell from the corresponding position. The collection time was chosen to be 3 hours for each measurement, and each experiment typically lasted for a period of 96 hours. During the measurement period, single cells may divide at certain points of time. When the cell number increased due to cell division, the measured number of exosomes was normalized to the cell number to obtain the single cell exosome secretion rate. As shown in Figure 4, each MCF7 cell and MDA-MB-231 cell had a similar exosome secretion rate of 60–65 exosomes per hour. However, each MCF10A cell secreted about 2.8x more exosomes than each MCF7 or MDA-MB-231 cell. Also for those exosomes produced by MCF10A cells and captured by the anti-CD63 Ab probes immobilized to the glass slide, only ~31% of them contained CD9 and almost none of them contained CD81. On the contrary, among the CD63 positive exosomes produced by MCF7 cells, as many as 89% contained CD9 and about 20% contained CD81. For those CD63 positive exosomes produced by MDA-MB-231 cells, 97% to 93% of them were CD9 and CD81 positive. Our results support the previous hypothesis with quantitative data unavailable before that tetraspanins CD9 and CD81 may be related to malignancy of cancer cells [29][30].
Figure 4.
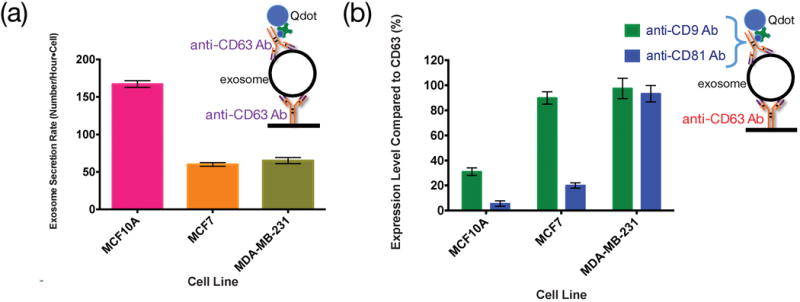
Expression level of different surface markers on different cell lines under normal culture condition without any stimulation. (a) Exosome secretion rate (in number/hour-cell) characterized by CD63 protein labeled with biotinylated anti-CD63 Ab and Qdots. (b) The percentage of CD9 and CD81 positive exosomes among all the exosomes captured by anti-CD63 antibody.
2.4. Time-lapse observation of exosome secretion rate under various conditions
We further demonstrate that, as a platform technology, the single-cell assay can be applied in various culture conditions. It has been reported that microtubule-targeting drugs, e.g. paclitaxel, could reduce exosome release under non-cytotoxic doses[31]; however there has been no quantitative study on the magnitude of reduction. For a quantitative study to resolve the effect from each single cell, both MCF7 and MDA-MB-231 cell lines were investigated using the aforementioned method. The cells were cultured for 48 hours before applying the drug. The paclitaxel drug was dissolved in PBS and mixed with 2 mils of exosome-free culture medium to achieve a final concentration of 5 ng/mL. After adding the drug containing medium into the culture dish, CD-63 positive exosomes were collected for 3 hours using the anti-CD63 Ab immobilized glass. After exosome collection, the cells were imaged and the quantum-dot labelled exosomes at the corresponding positions to the cells were recorded by using a fluorescent microscope. Every 24 hours from the last collection, the old medium was aspirated and replaced by 2 mils of new exosome-free medium with 5ng/mL paclitaxel. The above steps were repeated throughput the 96 hours of study period.
Fig. 5 shows the effects of paclitaxel on the exosome secretion rate for MCF7 and MDA-MB-231 cells. We observed a sharp decrease in the secretion rate of CD63 positive exosomes for MCF7 cells after 24 and 48 hours of treatment. On the contrary, MDA-MB-231 did not respond to paclitaxel in the first three hours, and the exosome secretion rate decreased by only ~20% after 24 hours. These results provide more quantitative information to support that MDA-MB-231 may have higher chemoresistance than MCF7 [32] so was less responsive to paclitaxel. To further quantify the effect of the drug on the expression level of CD9 and CD81 among the CD63 positive exosomes, we define the impact factor as Equation (1).
| (1) |
where R and R* represent the secretion rate under unperturbed and perturbed (by drugs, pH value, etc.) conditions. F=0 means the perturbation has no effect. F>0 and F<0 means the perturbation introduces positive and negative (i.e. increasing / decreasing the expression level of specific protein in exosomes). The inserts in Fig. 5 show the impact factor of the drug-induced perturbation on MCF7 and MDA-MB-231 cells. The data show that, among all the CD63 positive exosomes, the drug has positively impacted the expression level of CD81 for MCF7 cells but negatively impacted the expression level of CD81 for MDA-MB-231 cells. On the other hand, the drug has a modest effect on the expression level of CD9 for both MCF7 cells and MDA-MB-231 cells.
Figure 5.
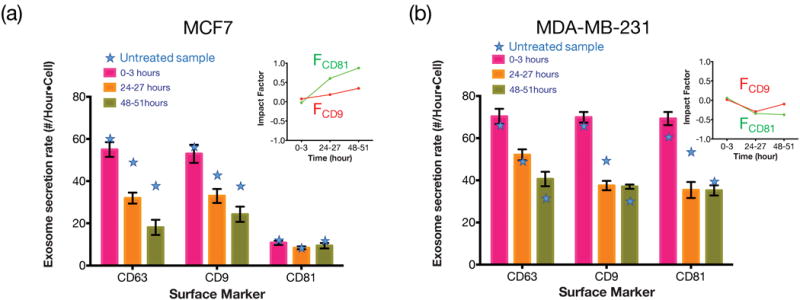
Expression level of different surface markers after paclitaxel treatments for (a) MCF7 and (b) MDA-MB-231. The star symbols indicate the secretion rate without paclitaxel treatment. The main figures show the exosome secretion rates (in number/hour-cell) for CD63 positive exosomes that are simultaneously CD9 or CD8 positive. The inserts show the impact factor (defined in text) of the drug on MCF7 and MDA-MB-231 cells regarding CD9 and CD81 expressions.
There have been studies that cell’s exosome release may be affected in lower than physiological pH value [33][34]. We have applied the technology platform to conduct a more quantitative study of exosome secretion in an acidic environment. Similar to the paclitaxel test, the cells were cultured for 48 hours before adding 2 mils of exosome-free culture media titrated with HCl to the final pH value of 6.7. Surface functionalized glass slides were then placed on the fixture to collect exosomes from single cells. After 3 hours of collection, cells were imaged and the collected Qdot-labeled exosomes were recorded by using a fluorescent microscope. The above procedures, including medium replacement, exosome collection, and microscope observations of cells and exosomes at the corresponding positions, were repeated every 24 hours.
We used the same way as we did in drug tests to evaluate the exosome secretion and the impact factor due to the pH change. As shown in Fig. 6, the secretion rate of CD63 positive exosomes for both MCF7 cells and MDA-MB-231 cells was not obviously affected in the acidic environment. However, the expression levels of CD9 and CD81 among those CD63 positive exosomes of MCF7 cells dropped significantly (i.e. impact factor ~ −0.5) within the first 3 hours under the acidic condition. Such drops appeared to be a transient instead of a permanent effect since in 24–27 hours, the expression levels of CD9 and CD81 recovered to almost the same level as they were in regular pH medium. On the other hand, the expression levels of CD9 and CD81 for MDA-MB-231 cells were not apparently affected by the pH value change. The results seem to suggest that both MCF7 and MDA-MB-231 cells are relatively resilient to the acidic environment in terms of their exosome secretion rate and expression level of surface proteins.
Figure 6.
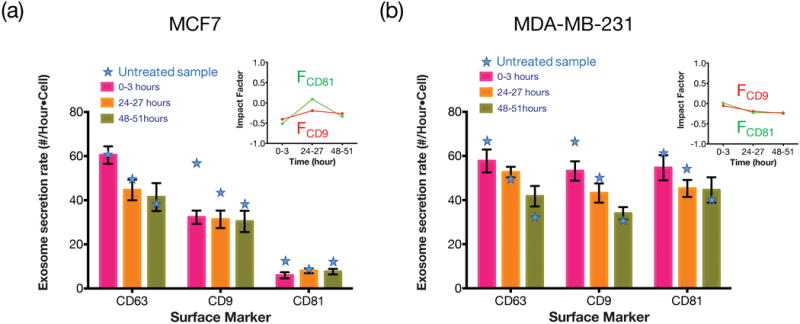
Expression levels of different surface markers after being cultured in lower pH (6.7) media for (a) MCF7 and (b) MDA-MB-231. The star symbols indicate the secretion rate in normal pH (pH=7.4) medium. The main figures show the exosome secretion rates over time for CD63 positive exosomes that are simultaneously CD9 or CD8 positive. The inserts show the impact factor of the pH change on exosomal CD9 and CD81 expressions for MCF7 and MDA-MB-231 cells.
Besides drug and environmental (pH) stress, we also investigated how cells responded to certain proteins such as transforming growth factor beta (TGF-β), a protein that was reported to induce MCF7 cell epithelial-to-mesenchymal transition. In our experiment, 10 ng of TGF-β was added into 10 mL exosome-free medium to culture MCF7 single cells. Again, at every 24-hour time interval and after each 3-hour exosome collection and cell observation, the above medium was replaced and the processing steps were repeated. As shown in Fig. 7, although the initial exosome secretion rate of MCF7 cells was around 70% of the rate without the growth factor TGF-β, the exosome secretion rate surged to 120% after 24 hours. The impact factor analysis indicates that after the TGF-β treatment for 48 hours, the expression level of CD81 among the CD63 positive exosomes rose very significantly (with impact factor reaching +2) while the response of CD9 to TGF-β was modest.
Figure 7.
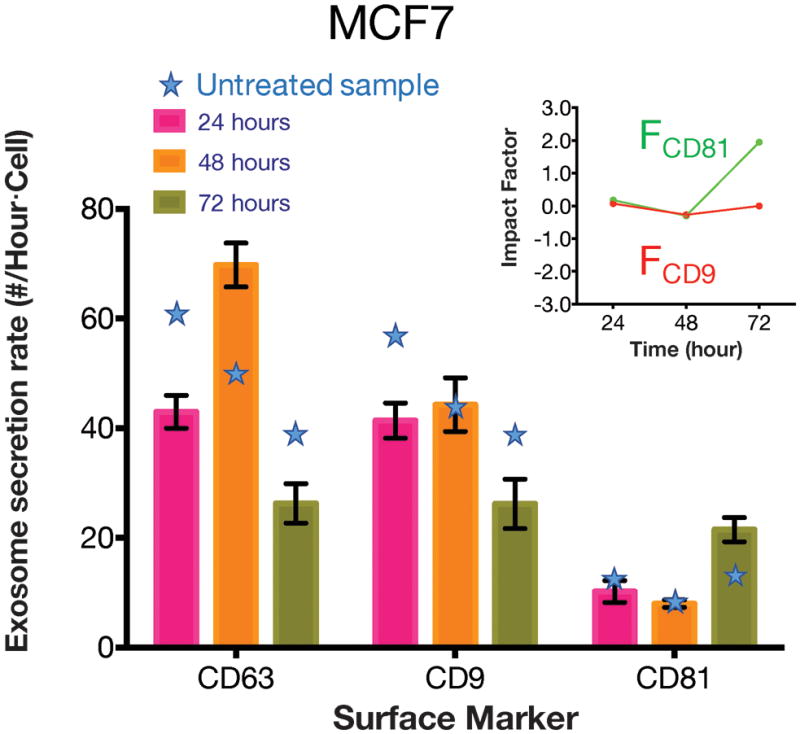
Expression level of different surface markers after the TGF-β treatment for MCF7. The star symbols indicate the secretion rate without TGF-β treatment. The main figure shows the exosome secretion rates over time for CD63 positive exosomes that are simultaneously CD9 and CD8 positive. The insert shows the impact factor of the perturbation on MCF7.
3. Conclusion
In summary, we have presented a single-cell assay that is applicable to multiple cell types, friendly for cell loading and operation, supportive for time-lapsed studies, and capable of non-invasive and quantitative analysis of molecular markers and vesicles secreted by single cells. The device is simple, low cost, versatile, and with moderately high throughput to support most single-cell studies. Notably, this platform has demonstrated to support excellent single cell viability with continuous data up to 96 hours. Specifically, we have shown the capability of the platform to quantify the various exosome secretion rates of single cells under different in-vitro conditions. In these studies, CD63 positive exosomes secreted by single cells in a 2D array were captured regularly, enabling measurements of exosome secretion rates by individual cells. Two additional surface markers, CD9 and CD81, were used to study the exosomal expression levels for cells under different external perturbations such as drug treatments, pH changes, and growth factors. While the main focus of these studies was to demonstrate the capabilities and versatility of the single-cell assay, the results of studies, including the effects of paclitaxel treatment, acidity, and TGF-β on MCF7 and MDA-MB-231 breast cancer cells, have provided valuable biological insight by the quantitative data at single cell resolution.
4. Materials and Method
4.1. Fabrication of through-hole PDMS mesh
The PDMS single cell loading mesh was made of PDMS lift-off (peel-off) process. A similar lift-off process had been reported by Park et al.[35] and Guo et al.[36]; however, these methods required precise process control and sophisticated skills. The fabrication process we developed here utilized a much simpler peel-off process with high tolerance and large process parameter window.
The process flow is summarized in Fig. 8. To define the mesh pattern, 6 μm thick NR9-3000PY negative photoresist (Futurrex, Frankling, NJ, USA) was spin-coated on a 4-inch Si wafer at 800 rpm for 40 seconds. The wafer was soft baked at 150°C for 1 minute, followed by 90 seconds of UV exposure (Karl Suss MA6 Mask Aligner) and 100°C post-exposure bake for 1 minute. The patterns revealed after resist development. A 2D array of 100 μm deep, 40 μm diameter mesas were then etched by deep reactive ion etching (DRIE) process (Oxford Plasmalab 100) using the photoresist as etch mask (Fig. 8c). In the DRIE process, SF6 gas was flowed at 100 sccm for 11 s during the etching cycle, followed by a passivation cycle with C4F8 gas flowed at 80 sccm for 7 s. The etching rate was ~0.65 μm to ~0.7 μm per cycle and took about 150 cycles to etch ~100μm Si. The etched wafer was spin-coated by ~100 μm thick uncured PDMS (Sylgard 184, Dow Corning, MI) with a premixed 1:1 ratio (v/v) with hexane at 1500 rpm for 60 seconds. The PDMS-coated wafer was baked in a 65°C oven for 90 minutes. A 2 mm thick PDMS ring with 12mm inner diameter and 14mm outer diameter was attached to the Si wafer by using uncured PDMS to define the cell loading area. The whole assembly, with the patterned wafer and the PDMS ring, was cured in a 65°C oven for 90 minutes. The PDMS ring helps enhance the mechanical strength and flatness of PDMS mesh to be formed by photoresist lift-off. To produce the mesh with a 2D array of through holes, the wafer was immersed in acetone and sonicated for 5 minutes twice, and then was rinsed with methanol and isopropanol and dried by nitrogen gas. The acetone sonication process allowed the solvent to diffuse through the hexane-mixed PDMS layer to reach the NR9-3000PY photoresist, causing the resist to swell and lift off the PDMS layer atop the NR9-3000PY photoresist. After baking the wafer in a 75°C oven for 5 minutes to ensure solvent evaporation, one could easily separate the PDMS mesh with an array of through holes from the Si wafer by holding the PDMS ring.
4.2. Antibody immobilization on cover glass
To immobilize anti-CD63 antibody on the glass slide for exosome capture, we diced and silanized the cover glass in 4% v/v (3-mercaptopropyl) trimethoxysilane (MPS) for 30mins with 200rpm spin speed at room temperature. The silanized glass slide was then washed three times with ethanol, followed by 105°C heating for 30 mins until it fully dried. The glass slide was incubated in 0.1 mM cross-linker, in Sulfo-GMBS, dissolved in phosphate buffered saline (PBS, pH 7.4, Gibco) for 40 minutes at room temperature, and then washed by PBS for 3 times. The glass slide was then incubated in 0.05 μM anti-CD63 Ab (Ancell) at 4 °C for 2 hours, follower by PBS wash for 3 times. The glass slide was then immersed in PBS with 5% (w/v) bovine serum albumin (BSA) at 4°C for 30 minutes to passivate non-reacted Sulfo-GMBS. After PBS wash for 3 times, the functionalized slide was stored in PBS at 4°C and ready to use.
4.3. Cell culture and single cell loading
GFP-transfected MCF7 (MCF7/GFP) cells and GFP-transfected MDA-MB-231 (MDA-MB-231/GFP) cells were cultured in high glucose Dulbecco’s Modified Eagle Medium (DMEM) supplemented with 10% (v/v) fetal bovine serum (FBS) and 1% (v/v) penicillin/streptomycin (Pen/Strep) in a humidified incubator at 37 °C with 5% CO2. Cells were harvested using 0.05% (w/v) trypsin EDTA when 80% confluence was attained. 3X culture media were added to neutralized trypsin before centrifuging down the cells. On the other hand, MCF10A cells were cultured in DMEM/F12 medium supplemented with 5% (v/v) horse serum, 20 ng/ml EGF, 0.5 μg/ml hydrocortisone, 100 ng/ml cholera toxin, 10 μg/ml insulin, and 1% (v/v) penicillin/streptomycin (Pen/Strep) in the same incubator described above. MCF10A cells were harvested using 0.05% (w/v) trypsin EDTA when 80% confluence was attained. Once cells were dislodged, 4.0 ml of resuspension medium made with DMEM/F12 medium supplemented with 20% (v/v) horse serum and 1% (v/v) Pen/Strep was applied to the plate and pipette to break up cell clumps before centrifuging with 150g for 3 minutes. For each cell line, the cell concentration was measured by a flow cytometer (Accuri C6) before dilution with suitable culture media.
4.4. Imaging and Counting
After exosomes were collected to the functionalized glass slide, the glass slide was fixed with 4% (v/v) paraformaldehyde in PBS at room temperature for 30 minutes. The slide was then washed 3 times with PBS, incubated in 0.05uM biotinylated antibodies (Ancell Inc.) solution at 4 °C for 2 hours, and washed with PBS for 3 times again. Then three types of biotinylated antibodies (anti-CD63 Ab, anti-CD9 Ab, or anti-CD81 Ab) were used, depending on which surface protein was to be characterized. The glass slide was subsequently incubated in 10 nM streptavidin-coated Qdots (Life Technologies) solution at room temperature for 1 hour, followed by three times of 50°C TBST wash and 2 times of 50°C deionized (DI) water wash before dehydration by series immersion of the slide in diluted ethanol with DI water. The sample was then imaged by using an inverted fluorescent microscope (BE-II 9000, Keyence) with excitation/emission filters of 405/10 nm and 536/40 nm, respectively. The fluorescent images were processed through haze reduction and black balance algorithms, and Qdots were counted by using an object counter module in the microscope software (BZ-II Analyzer).
4.5. Characterization of Functionalized Cover Glass
To test the exosomes capture capacity of functionalized glass slides, we use anti-CD63 Ab immobilized glass slides to capture different concentrations of purified exosomes. Three different concentrations: 0.5 × 10⁴ exosomes/μL, 1 × 10⁴ exosomes/μL, and 2 × 10⁴ exosomes/μL were used to characterize the dynamic range of the functionalized glass slides for exosome capturing. Within a 100 μm × 150 μm area as the field of view under 100X objective, the measured number of anti-CD63 Ab conjugated Q-dots was ~730, ~1500, and ~1500 under the concentration of 0.5 × 10⁴ exosomes/μL, 1 × 10⁴ exosomes/μL, and 2 × 10⁴ exosomes/μL, respectively. The result indicates that the maximum exosome capture capacity for the functionalized glass slide is around 1500 exosomes in a 100 μm × 150 μm area. In a similar test using exosome free medium, we have found that the number of non-specific binding of Q-dots over the 100 μm × 150 μm area is around 25.
Acknowledgments
The authors acknowledge the technical support of the staff of the San Diego Nanotechnology Infrastructure (SDNI), which is part of the National Nanotechnology Coordinated Infrastructure (NNCI). Research reported in this publication was supported by the National Institute of General Medical Sciences (NIGMS) of the National Institutes of Health under award number R21GM107977 and the National Institute of Biomedical Imaging and Bioengineering (NIBIB) of the National Institutes of Health under Award Number R43EB021129. The content is solely the responsibility of the authors and does not necessarily represent the official views of the National Institutes of Health.
References
- 1.Lin L, Chu Y-S, Thiery JP, Lim CT, Rodriguez I. Lab Chip. 2013;13:714. doi: 10.1039/c2lc41070b. [DOI] [PubMed] [Google Scholar]
- 2.Chung K, Rivet CA, Kemp ML, Lu H. Anal Chem. 2011;83:7044. doi: 10.1021/ac2011153. [DOI] [PMC free article] [PubMed] [Google Scholar]
- 3.Zhang K, Chou C-K, Xia X, Hung M-C, Qin L. Proc Natl Acad Sci U S A. 2014;111:2948. doi: 10.1073/pnas.1313661111. [DOI] [PMC free article] [PubMed] [Google Scholar]
- 4.Hong S, Pan Q, Lee LP. Integr Biol (Camb) 2012;4:374. doi: 10.1039/c2ib00166g. [DOI] [PubMed] [Google Scholar]
- 5.Kim SH, Yamamoto T, Fourmy D, Fujii T. Small. 2011;7:3239. doi: 10.1002/smll.201101028. [DOI] [PubMed] [Google Scholar]
- 6.Köster S, Angilè FE, Duan H, Agresti JJ, Wintner A, Schmitz C, Rowat AC, Merten CA, Pisignano D, Griffiths AD, Weitz DA. Lab Chip. 2008;8:1110. doi: 10.1039/b802941e. [DOI] [PubMed] [Google Scholar]
- 7.Mazutis L, Gilbert J, Ung WL, Weitz DA, Griffiths AD, Heyman JA. Nat Protoc. 2013;8:870. doi: 10.1038/nprot.2013.046. [DOI] [PMC free article] [PubMed] [Google Scholar]
- 8.Yusof A, Keegan H, Spillane CD, Sheils OM, Martin CM, O’Leary JJ, Zengerle R, Koltay P. Lab Chip. 2011;11:2447. doi: 10.1039/c1lc20176j. [DOI] [PubMed] [Google Scholar]
- 9.Suh KY, Seong J, Khademhosseini A, Laibinis PE, Langer R. Biomaterials. 2004;25:557. doi: 10.1016/s0142-9612(03)00543-x. [DOI] [PubMed] [Google Scholar]
- 10.Falconnet D, Csucs G, Michelle Grandin H, Textor M. Biomaterials. 2006;27:3044. doi: 10.1016/j.biomaterials.2005.12.024. [DOI] [PubMed] [Google Scholar]
- 11.Azioune A, Storch M, Bornens M, Théry M, Piel M. Lab Chip. 2009;9:1640. doi: 10.1039/b821581m. [DOI] [PubMed] [Google Scholar]
- 12.Sekula S, Fuchs J, Weg-Remers S, Nagel P, Schuppler S, Fragala J, Theilacker N, Franzreb M, Wingren C, Ellmark P, Borrebaeck CAK, Mirkin CA, Fuchs H, Lenhert S. Small. 2008;4:1785. doi: 10.1002/smll.200800949. [DOI] [PubMed] [Google Scholar]
- 13.Berthing T, Bonde S, Sørensen CB, Utko P, Nygård J, Martinez KL. Small. 2011;7:640. doi: 10.1002/smll.201001642. [DOI] [PubMed] [Google Scholar]
- 14.Wood DK, Weingeist DM, Bhatia SN, Engelward BP. Proc Natl Acad Sci. 2010;107:10008. doi: 10.1073/pnas.1004056107. [DOI] [PMC free article] [PubMed] [Google Scholar]
- 15.Rosenthal A, Macdonald A, Voldman J. Biomaterials. 2007;28:3208. doi: 10.1016/j.biomaterials.2007.03.023. [DOI] [PMC free article] [PubMed] [Google Scholar]
- 16.Tan CP, Ri Seo B, Brooks DJ, Chandler EM, Craighead HG, Fischbach C. Integr Biol. 2009;1:587. doi: 10.1039/b908036h. [DOI] [PubMed] [Google Scholar]
- 17.Wright D, Rajalingam B, Karp JM, Selvarasah S, Ling Y, Yeh J, Langer R, Dokmeci MR, Khademhosseini A. J Biomed Mater Res Part A. 2008;85A:530. doi: 10.1002/jbm.a.31281. [DOI] [PMC free article] [PubMed] [Google Scholar]
- 18.Camussi G, Deregibus MC, Bruno S, Cantaluppi V, Biancone L. Kidney Int. 2010;78:838. doi: 10.1038/ki.2010.278. [DOI] [PubMed] [Google Scholar]
- 19.Melo SA, Sugimoto H, O’Connell JT, Kato N, Villanueva A, Vidal A, Qiu L, Vitkin E, Perelman LT, Melo CA, Lucci A, Ivan C, Calin GA, Kalluri R. Cancer Cell. 2014:1. doi: 10.1016/j.ccell.2014.09.005. [DOI] [PMC free article] [PubMed] [Google Scholar]
- 20.Boelens MC, Wu TJ, Nabet BY, Xu B, Qiu Y, Yoon T, Azzam DJ, Twyman-Saint VC, Wiemann BZ, Ishwaran H, Ter Brugge PJ, Jonkers J, Slingerland J, Minn AJ. Cell. 2014;159:499. doi: 10.1016/j.cell.2014.09.051. [DOI] [PMC free article] [PubMed] [Google Scholar]
- 21.Lv M-M, Zhu X-Y, Chen W-X, Zhong S-L, Hu Q, Ma T-F, Zhang J, Chen L, Tang J-H, Zhao J-H. Tumour Biol. 2014 doi: 10.1007/s13277-014-2377-z. [DOI] [Google Scholar]
- 22.Hoshino A, Costa-Silva B, Shen T-L, Rodrigues G, Hashimoto A, Tesic Mark M, Molina H, Kohsaka S, Di Giannatale A, Ceder S, Singh S, Williams C, Soplop N, Uryu K, Pharmer L, King T, Bojmar L, Davies AE, Ararso Y, Zhang T, Zhang H, Hernandez J, Weiss JM, Dumont-Cole VD, Kramer K, Wexler LH, Narendran A, Schwartz GK, Healey JH, Sandstrom P, Jørgen Labori K, Kure EH, Grandgenett PM, Hollingsworth MA, de Sousa M, Kaur S, Jain M, Mallya K, Batra SK, Jarnagin WR, Brady MS, Fodstad O, Muller V, Pantel K, Minn AJ, Bissell MJ, Garcia BA, Kang Y, Rajasekhar VK, Ghajar CM, Matei I, Peinado H, Bromberg J, Lyden D. Nature. 2015:1. Hoshino, A. [Google Scholar]
- 23.Théry C, Amigorena S, Raposo G, Clayton A. Curr Protoc Cell Biol. John Wiley & Sons, Inc.; Hoboken, NJ, USA: 2006. pp. 1–29. [DOI] [PubMed] [Google Scholar]
- 24.Zhu L, Wang K, Cui J, Liu H, Bu X, Ma H, Wang W, Gong H, Lausted C, Hood L, Yang G, Hu Z. Anal Chem. 2014;86:8857. doi: 10.1021/ac5023056. [DOI] [PMC free article] [PubMed] [Google Scholar]
- 25.Im H, Shao H, Il Park Y, Peterson VM, Castro CM, Weissleder R, Lee H. Nat Biotechnol. 2014;32:490. doi: 10.1038/nbt.2886. [DOI] [PMC free article] [PubMed] [Google Scholar]
- 26.Chen C, Skog J, Hsu CH, Lessard RT, Balaj L, Wurdinger T, Carter BS, Breakefield XO, Toner M, Irimia D. Lab Chip. 2010;10:505. doi: 10.1039/b916199f. [DOI] [PMC free article] [PubMed] [Google Scholar]
- 27.He M, Crow J, Roth M, Zeng Y, Godwin AK. Lab Chip. 2014;14:3773. doi: 10.1039/c4lc00662c. [DOI] [PMC free article] [PubMed] [Google Scholar]
- 28.Liga A, Vliegenthart ADB, Oosthuyzen W, Dear JW, Kersaudy-Kerhoas M. Lab Chip. 2015;15:2388. doi: 10.1039/c5lc00240k. [DOI] [PubMed] [Google Scholar]
- 29.Hemler ME. Nat Rev Cancer. 2013;14:49. doi: 10.1038/nrc3640. [DOI] [PubMed] [Google Scholar]
- 30.Greening DW, Gopal SK, Mathias RA, Liu L, Sheng J, Zhu HJ, Simpson RJ. Semin Cell Dev Biol. 2015;40:60. doi: 10.1016/j.semcdb.2015.02.008. [DOI] [PubMed] [Google Scholar]
- 31.Iero M, Valenti R, Huber V, Filipazzi P, Parmiani G, Fais S, Rivoltini L. Cell Death Differ. 2008;15:80. doi: 10.1038/sj.cdd.4402237. [DOI] [PubMed] [Google Scholar]
- 32.Flores ML, Castilla C, Ávila R, Ruiz-Borrego M, Sáez C, Japón MA. Breast Cancer Res Treat. 2012;133:917. doi: 10.1007/s10549-011-1864-9. [DOI] [PubMed] [Google Scholar]
- 33.Parolini I, Federici C, Raggi C, Lugini L, Palleschi S, De Milito A, Coscia C, Iessi E, Logozzi M, Molinari A, Colone M, Tatti M, Sargiacomo M, Fais S. J Biol Chem. 2009;284:34211. doi: 10.1074/jbc.M109.041152. [DOI] [PMC free article] [PubMed] [Google Scholar]
- 34.Federici C, Petrucci F, Caimi S, Cesolini A, Logozzi M, Borghi M, D’Ilio S, Lugini L, Violante N, Azzarito T, Majorani C, Brambilla D, Fais S. PLoS One. 2014;9:e88193. doi: 10.1371/journal.pone.0088193. [DOI] [PMC free article] [PubMed] [Google Scholar]
- 35.Park J, Kim HS, Han A. J Micromechanics Microengineering. 2009;19:065016. doi: 10.1088/0960-1317/19/6/065016. [DOI] [PMC free article] [PubMed] [Google Scholar]
- 36.Guo L, Meacham KW, Hochman S, DeWeerth SP. IEEE Trans Biomed Eng. 2010;57:2485. doi: 10.1109/TBME.2010.2052617. [DOI] [PMC free article] [PubMed] [Google Scholar]