Abstract
Endothelial cells are constantly exposed to blood flow and the resulting frictional force, the wall shear stress, varies in magnitude and direction with time, depending on vasculature geometry. Previous studies have shown that the structure and function of endothelial cells, and ultimately of the vessel wall, are deeply affected by the nature of wall shear stress waveforms. To investigate the in vitro effects of these stimuli, we developed a compact, programmable, real-time operated system based on cone-and-plate geometry, that can be used within a standard cell incubator. To verify the capability to replicate realistic shear stress waveforms, we calculated both analytically and numerically to what extent the system is able to correctly deliver the stimuli defined by the user at plate level. Our results indicate that for radii greater than 25 mm, the shear stress is almost uniform and directly proportional to cone rotation velocity. We further established that using a threshold of 10 Hz of wall shear stress waveform frequency components, oscillating flow conditions can be reproduced on cell monolayer surface. Finally, we verified the capability of the system to perform long-term flow exposure experiments ensuring sterility and cell culture viability on human umbilical vein endothelial cells exposed to unidirectional and oscillating shear stress. In conclusion, the system we developed is a highly dynamic, easy to handle, and able to generate pulsatile and unsteady oscillating wall shear stress waveforms. This system can be used to investigate the effects of realistic stimulations on endothelial cells, similar to those exerted in vivo by blood flow.
Keywords: Shear stress, Cone-and-plate, Computational fluid dynamics, Endothelial cells
Introduction
Mechanical stresses caused by flowing blood are deeply involved in vasculature development, homeostasis and remodeling (Ando and Yamamoto 2011). Besides stretching caused by blood pressure within the vessel wall, blood flow continuously exerts shear force on endothelial cells (ECs) lining the luminal surface of blood vessels. This frictional force, the wall shear stress (WSS), is a fundamental stimulus in protecting the vascular wall. It has been demonstrated that physiological laminar and pulsatile flow induces WSS that maintain EC in quiescent, non-thrombogenic and anti-inflammatory state (Malek et al. 1999). Areas of the circulation where EC are exposed to low and oscillating WSS are predisposed to atherosclerosis and intimal hyperplasia (IH) (Chatzizisis et al. 2007; Malek et al. 1999; Rajabi-Jagahrgh et al. 2013).
WSS waveform magnitude and direction are not uniform within vasculature, depending on the cardiac cycle and local vessel geometry. Computational studies on realistic vascular geometries showed that arterial branches and curvature induce blood flow separation and recirculation, and in these areas ECs experience low and/or oscillating (reciprocating) WSS stimuli (Dai et al. 2004; Ene-Iordache and Remuzzi 2012; Sui et al. 2015). In vivo and in vitro studies correlated reciprocating WSS waveforms with EC dysfunctions caused mainly by altered cell signaling, increased permeability, and impaired vessel remodeling (Chiu and Chien 2011; Davies et al. 2013). On the contrary, pulsatile, relatively high and unidirectional WSS stimuli prevent EC dysfunction, maintaining cell quiescence (van Thienen et al. 2006).
Several in vitro shearing devices have been proposed for investigating WSS effects on cell cultures (Blackman et al. 2002). Our aim, however, was to develop a device to expose the cell monolayers to highly unsteady WSS stimuli. The cone-and-plate device (CPD) turned out to be the best system for reproducing such complex waveforms in a controlled environment. We therefore developed a compact, real-time controlled CPD to assess the in vitro effects of realistic WSS waveforms on ECs, with fast temporal variations in WSS magnitude and direction. We verified that realistic WSS profiles, estimated for atheroprone and atheroprotective areas of the carotid bifurcation, can be accurately reproduced. We also verified that ECs can be cultured within the device and that they align when exposed to pulsatile unidirectional flows for 48 h, while they do not align when exposed to oscillating shear stress.
Materials and methods
Cone-and-plate device design
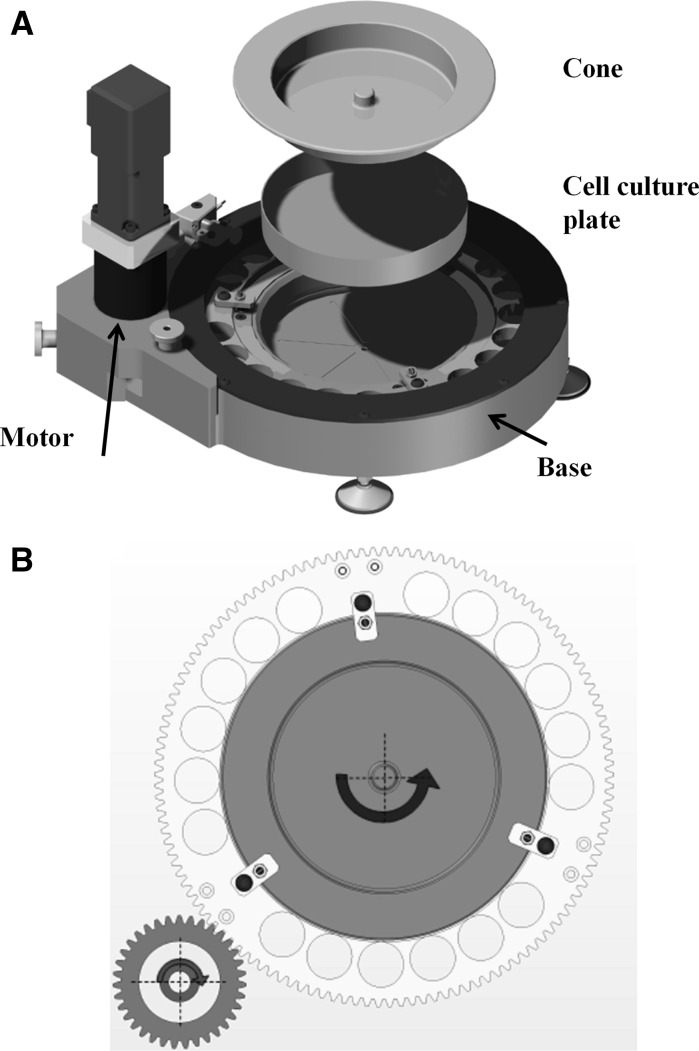
The main requirements for the development of the device were to be able to apply tightly controlled, highly unsteady WSS stimulations on EC cultures, ensuring long-term sterility and proper culture conditions. To fulfill these requirements, we designed and built a compact CPD apparatus driven by a brushless motor (as shown in Fig. 1a). The CPD system is composed of a rotating stainless steel (AISI 316) cone with radius r = 67 mm and a cone angle α = 0.5 deg, coupled with a disposable 150 cm2 plastic dish (Falcon P-150, BD Biosciences, Franklin Lakes, NJ, USA) located in the device base and fixed with a vacuum pump (Fig. 1a). The cone is fixed with a gear moved by a pinion (Fig. 1b) driven by the brushless motor (Mavilor, Barcelona, Spain) that is operated by a programmable driver according to the signal generated by an encoder embedded in the motor. Three interchangeable calibrated spacers support the cone and maintain a gap (h0) of 0.1 mm between the two elements that we used to avoid cell monolayer damage caused by the cone apex. By changing the spacers, it is possible to reduce the gap. For lower gaps however, the WSS at plate level could be affected by the cell monolayer itself due to the non-uniform height of cells that may introduce disturbances in the CPD generated flow. The relatively small size of the device makes it possible to insert it within a standard cell incubator, where proper culture conditions are maintained without the need for other control systems. The design also allows us to separate the CPD base from the motor (as shown in Fig. 1a), that can then be moved under a laminar flow hood, and handle it ensuring sterility during positioning of cell culture plates or culture medium replacement.
Fig. 1.
a Rendering of the cone-and-plate device. b Cone-and-plate device (CPD) motion concept
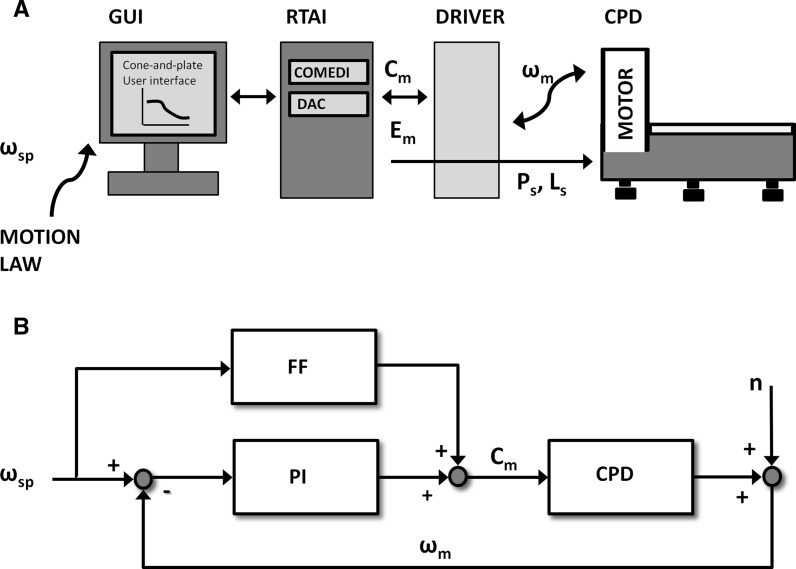
The motion control of the cone, as shown in Fig. 2a, is provided by a PC-based platform, equipped with a Linux-based Real-Time Application Interface (RTAI) that enables the control loop to be closed with a 1 kHz sample frequency through a hard-real time thread. An acquisition data board (NI-6229, National Instruments Corp., Austin, TX, USA) supporting the COMEDI collection of drivers for data acquisition, is used as the interface between the device and the control unit. It acquires encoder signal (Em) based on motor angular velocity ωm(t) and generates a torque control signal (Cm) and two digital signals to enable power and logic driver switches (Ps, Ls). A graphical user interface, developed with Linux IDE (Qt Creator), allows the user to define the motion law that controls cone rotation, to visualize cone rotation velocity, torque and position and finally to save these data. Motion laws can easily be created by the user since these are ASCII-based files that set the cone rotation velocity set-point ωsp(t) and the acceleration, each millisecond.
Fig. 2.
a Control platform scheme, where GUI is the graphical user interface, DAC is the digital to analog converter of the NI-6229 board, Ps and Ls are the power and logic switches, Cm is the torque imposed to the motor by the control, Em is the encoder signal acquired by the control and RTAI is the real-time operating system. b Control system scheme, where ωsp(t) is the angular velocity set point defined by the user, ωm(t) is the instantaneous cone angular velocity measured by the motor encoder, Cm is the torque imposed to the motor by the control, n is the signal noise, FF is the feed-forward module, PI is the proportional-integral controller and CPD is the cone-and-plate device
In order to perform highly unsteady WSS stimulations, a proportional-integral controller (PIC) with an anti wind-up element for the integral component, closed on the cone velocity, provides tight control and fast cone rotation dynamic (Fig. 2b). The PIC is a low-pass filter that can hide high frequency noise while the integral component guarantees the tracking of steady state conditions. To compensate cone and gear inertial effects during fast acceleration, specific of realistic WSS waveforms, a feed-forward block was introduced to compensate for such effects and to increase the dynamic behavior of the system. Finally, we evaluated the device performance in reproducing highly unsteady waveforms. On the test bench we replicated different waveforms and we verified the correspondence of motor angular velocity ωm(t) to velocity set-point ωsp(t).
WSS waveforms analytical evaluation
We evaluated the capability of the device to reproduce unsteady WSS stimulation. We considered two realistic WSS waveforms previously calculated in the carotid artery bifurcation and reported by Dai et al. (2004). To calculate the cone rotation velocity required to obtain these WSS stimuli over the plate surface, we initially considered the formulation proposed by Sdougos et al. (1984), where ω is the cone angular velocity (in rad/s), τ is WSS (in Pa), α is the cone angle (in rad) and μ is the dynamic viscosity (in Pa s) (as shown in Fig. 3a):
| 1 |
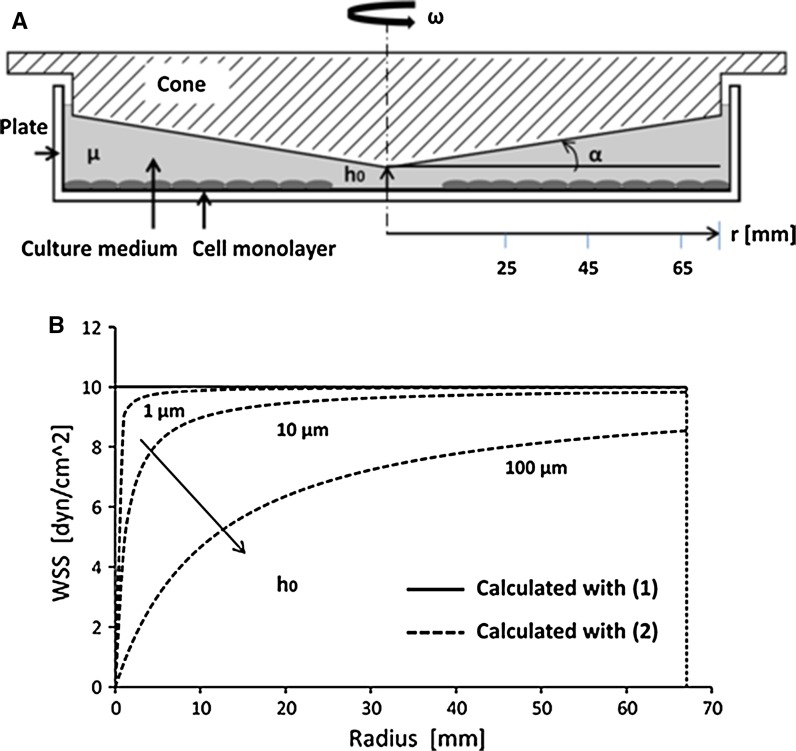
According to these authors, Eq. (1) describes the relationship between cone velocity and WSS on the plate surface only if flow within the device is laminar. To verify this, we calculated the modified Reynolds number (Sdougos et al. 1984). For all conditions tested was <0.5, indicating that flow between the cone and the plate is laminar and that estimating WSS with (1) is correct. This formulation, however, considers an ideal CPD geometry with no distance between the apex of the cone and the plate. In our experimental set-up, we maintained a gap between the cone apex and the plate (Fig. 3b). To evaluate the effect of this gap on WSS magnitude at plate level, we considered the formulation proposed by Sucosky et al. (2008), where h0 is the gap dimension (in cm), and r is the plate radius (in cm):
| 2 |
Fig. 3.
a The cone-and-plate device schematic drawing where μ is medium dynamic viscosity, h0 is the gap between the cone apex and the plate, r is the plate radius, α is the cone angle and ω is the cone angular velocity. b Gap effect on WSS at plate level. The continuous line represents WSS value on the plate surface calculated with Sdougos et al. (1984) approach (1) while the dashed lines represent WSS calculated with Sucosky et al. (2008) formulation (2). The curves were calculated for ω = 1.46 rad/s, μ = 0.00354 Pa s, α = 0.5° and h0 = 1, 10, 100 μm, respectively
Considering the highly unsteady nature of these WSS waveforms, we also evaluated whether fast changes in cone angular velocity actually corresponded to proportional changes in WSS delivered over the plate surface, as calculated by Eq. (2). To this aim, we calculated the time delay (td, in sec.) between a change in cone rotation velocity and the corresponding change in WSS magnitude at the plate level according to Sutera and Nowak (1988), by using the formula for a suddenly accelerated plane in a semi-infinite Newtonian fluid, where hr is the gap (in cm) between the cone and the plate surfaces along the radius and ν is the medium fluid kinematic viscosity (in g/cm3):
| 3 |
When Eq. (3) is satisfied, the fluid has enough time to accelerate and to reach 99 % of the linear velocity profile between the cone and the plate. We calculated a value of td = 0.035 s, at maximum radius, which is one order of magnitude below the time of single 10 Hz sinusoid oscillation (0.1 s). We then considered that cone speed variation frequencies at less than 10 Hz are correctly delivered at the plate level with corresponding WSS calculated by Eq. (2). In line with these observations, we calculated the inverse Fourier transform of the WSS profiles derived from Dai et al. (2004) using frequency components up to 10 Hz to generate motion laws necessary to control cone rotation speed. The use of frequency components up to 10 Hz allowed to accurately reproduce the two WSS patterns identified by these Authors.
Numerical simulations
To verify whether the results obtained by Eq. (2) are reliable in predicting WSS as a function of time on the basis of cone rotation speed, we performed computational fluid dynamics (CFD) analysis of the flow field present between cone and plate surfaces when different WSS waveforms are generated. We performed transient flow numerical simulations using the OpenFOAM code, a multipurpose CFD tool based on the finite volume method (OpenFOAM team 2014). A three-dimensional parametric model of the fluid inside the cone-and-plate system was constructed with a mesh generator tool (blockMesh) that is part of the OpenFOAM v. 2.3.1 suite. The mesh consists of a disc with an upper conical surface representing the cone and a bottom plane surface representing the cell surface, connected with an exterior vertical wall. The internal volume (fluid) was meshed using a structured grid consisting of 138,000 hexahedral cells. We considered the fluid as a Newtonian fluid having measured (data not shown) dynamic viscosity μ = 0.00354 Pa s and density ρ = 0.9544 g/cm3. As boundary conditions we considered the angular velocity ω(t) in rad/s of the cone calculated with Eq. (1), assuming no-slip (i.e., zero velocity) condition on the cell monolayer surface and on the plate vertical wall. The unsteady Navier–Stokes equations were solved using pimpleFoam, a transient solver for incompressible flows with first order Euler time integration scheme. One cycle (T = 1 s) was divided in 1000 fixed time steps and the results were saved for post-processing into 1000 time steps for each cycle. Four complete WSS cycles were solved in order to damp the initial transients of the fluid and only the results of the fourth cycle were considered for data processing.
HUVEC flow exposure
We performed preliminary experiments by exposing HUVECs for 48 h to shear stress of 8–10 dyn/cm2 using a sinusoid waveform and to the atheroprotective and atheroprone WSS waveforms proposed by (Dai et al. 2004). Briefly, HUVECs were isolated from human umbilical cords through collagenase digestion (150 U/mL) according to Jaffe et al. (1973) method. HUVECs between the first and fifth passage, were plated on a P-150 pre-coated with 0.2 % bovine gelatin solution (Sigma-Aldrich, St. Louis, MO, USA) and cultured until confluence in Medium 199 (Biowest, Nauillé, France) supplemented with 10 % new born calf serum (Life Technologies Italia, Monza, Italy), 10 % human serum, 1 % PenStrep (Life Technologies), 1 % Fungizone (Life Technologies), 0.1 % heparin (TEVA, Petah Tikva, Israel) and 0.2 % EC growth supplement (ECGS, Tebu-Bio, Offenbach, Germany). Once HUVECs were confluent, medium in P-150 was substituted with testing medium that consisted of the complete medium without ECGS supplemented with 4 % high molecular weight Dextran (450–650 kDa, Sigma) to increase viscosity up to 0.00354 Pa s. In a laminar flow hood under sterile conditions, the P-150 coated with cells, was inserted into CDP and maintained in position by vacuum (Fig. 4a). The cone, previously sterilized, was positioned over the plate and blocked. A plastic cover was used to close the device which was then placed in a standard incubator and coupled with the motor (Fig. 4b). The cone rotation velocity was slowly increased until reaching the velocity profile previously defined by the user. Every 12 h the device was stopped and medium was changed under sterile conditions. At the beginning, and at the end of each experiment, phase contrast microscopy images were taken to evaluate ECs morphological adaptations to different WSS waveforms.
Fig. 4.
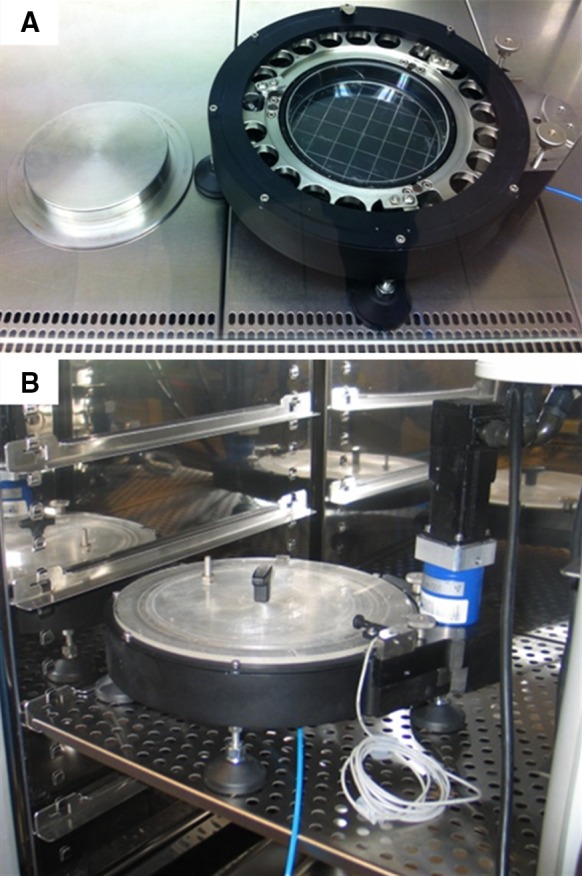
a The cone-and-plate device under the laminar flow hood. b The cone-and-plate device within the standard cell incubator
Results
The compact design of the system and the removable motor allowed for easy handling of the base under a laminar flow hood. This ensured the sterility of cell cultures when inserted into the device or during culture medium change. The use of the device within a standard cell incubator ensures controlled culture conditions regarding temperature and gas composition, with no other components needed (Fig. 4b).
To assess the effective WSS generated by the device on the plate surface, we compared the results obtained by Eq. (2) with those obtained by numerical analysis of flow generated by two motion laws derived from WSS waveforms proposed by Dai et al. (2004). Even though Eq. (2) takes into account the effect of the gap between the cone apex and the plate on WSS, it assumes that changes in cone angular velocity correspond to instantaneous changes in WSS magnitude. However, culture medium inertia may cause a time delay between changes in cone rotation velocity and correspondent changes of WSS magnitude over the plate.
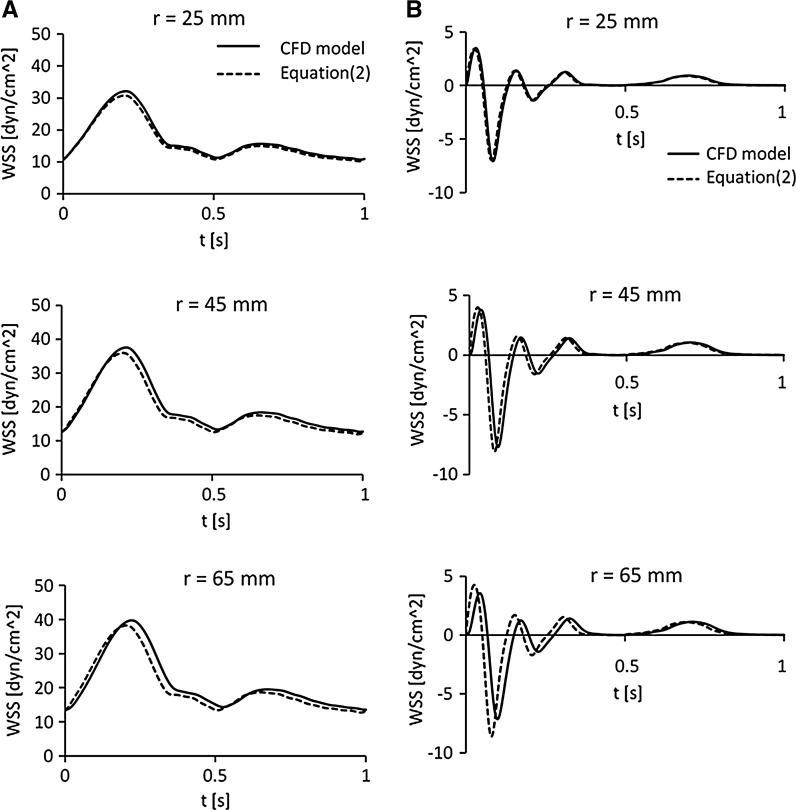
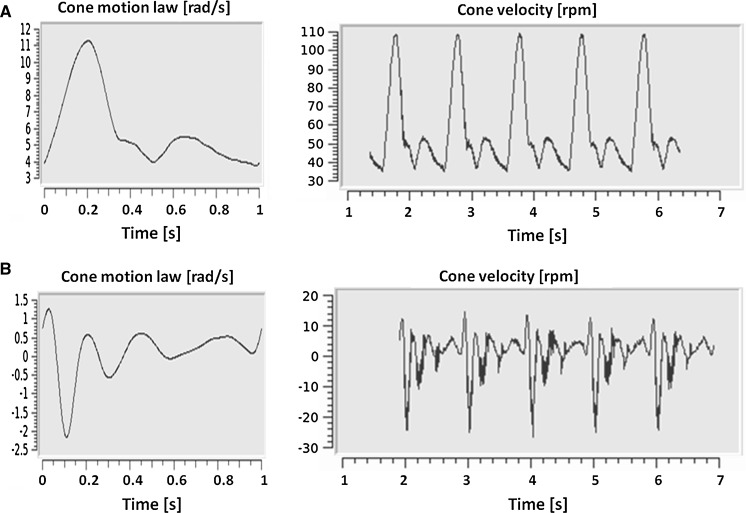
As reported in Fig. 5, the WSS values estimated with Eq. (2) are very close to those calculated by CFD for both motion laws, created to replicate atheroprotective and atheroprone waveforms. Atheroprotective WSS maximum positive peak calculated with Eq. (2) ranges from 95.6 to 96.4 % of WSS value calculated by CFD, at 25 and 65 mm radius, respectively (Fig. 5a). We also observed that the maximum td of WSS peak calculated by CFD compared to WSS estimated with Eq. (2), is 0.017 s at 65 mm radius. As expected this delay is much lower (49.1 %) than the delay estimated by Eq. (3). Atheroprone WSS maximum negative peak calculated by CFD ranges from 98.1 to 120.1 % at 25 and 65 mm (Fig. 5b). The maximum time delay between the minimum WSS calculated by CFD and that estimated by Eq. (2) is 0.019 s at 65 mm radius. This value is 54.8 % of the delay estimated by Eq. (3). Simulations of both WSS waveforms have shown that at the outer radial position (67 mm) the waveform magnitude strongly decrease to 83 and 59.1 % of WSS estimated by Eq. (2), due the plate edge effects. At this plate radial position td remains similar to that calculated at 65 mm radius. In line with these results, since the area with radius smaller than 25 mm is only 14 % of the dish, we assumed that the cell monolayer experiences a sustained and rather uniform WSS. Moreover, the td evaluation confirmed that the frequency of 10 Hz is the correct threshold of frequencies delivered at plate level in the CPD. Below this frequency threshold, the WSS acting on the cell monolayer can reliably be described as a function of the angular velocity (ω) calculated by Eq. (2). The system graphical user interface (GUI) allows the user to monitor the cone rotation velocity in real-time, thus to ensure a correct delivery of WSS at cell monolayer level. As shown in Fig. 6, we experimentally confirmed the good quality tracking of the pre-defined cone angular velocity [ωsp(t)]. Recording of effective cone angular velocity measured and displayed by the motor encoder [ωm(t)] was very close to pre-defined angular velocity of the cone, except for some negligible overshoot during fastest acceleration phases, especially for the atheroprone waveform (Fig. 6b).
Fig. 5.
a Atheroprotective WSS waveforms (Dai et al. 2004). The continuous line represents the WSS value on the plate surface calculated with CFD simulation while the dashed line represents WSS calculated with Sucosky et al. (2008) formulation (2). The curves were calculated for μ = 0.00354 Pa s, h0 = 0.1 mm, α = 0.5° and r = 25, 45 and 65 mm, respectively. b Atheroprone WSS waveforms (Dai et al. 2004). The continuous line represents WSS value on the plate surface calculated with CFD simulation while the dashed line represents WSS calculated with Sucosky et al. (2008) formulation (2). The curves were calculated for μ = 0.00354 Pa s, h0 = 0.1 mm, α = 0.5° and r = 25, 45 and 65 mm, respectively
Fig. 6.
a GUI image during Atheroprotective waveform test. Visualization of the user-defined motion law (single period) and visualization of five periods of the effective cone angular velocity measured by the motor encoder. b GUI image during Atheroprone waveform test
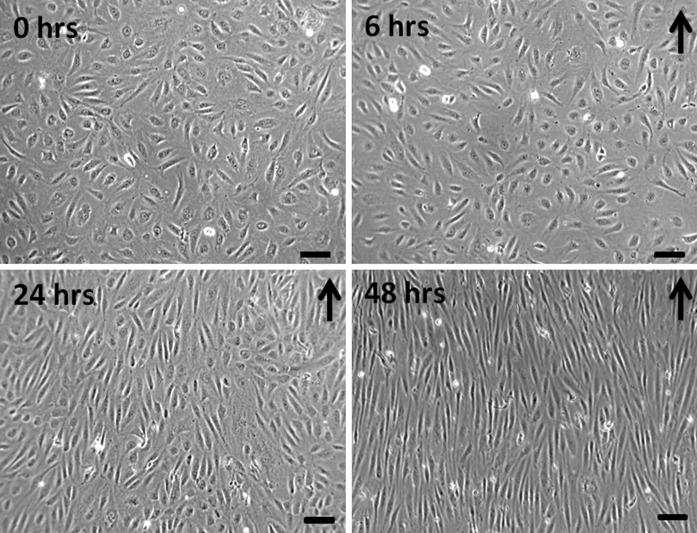
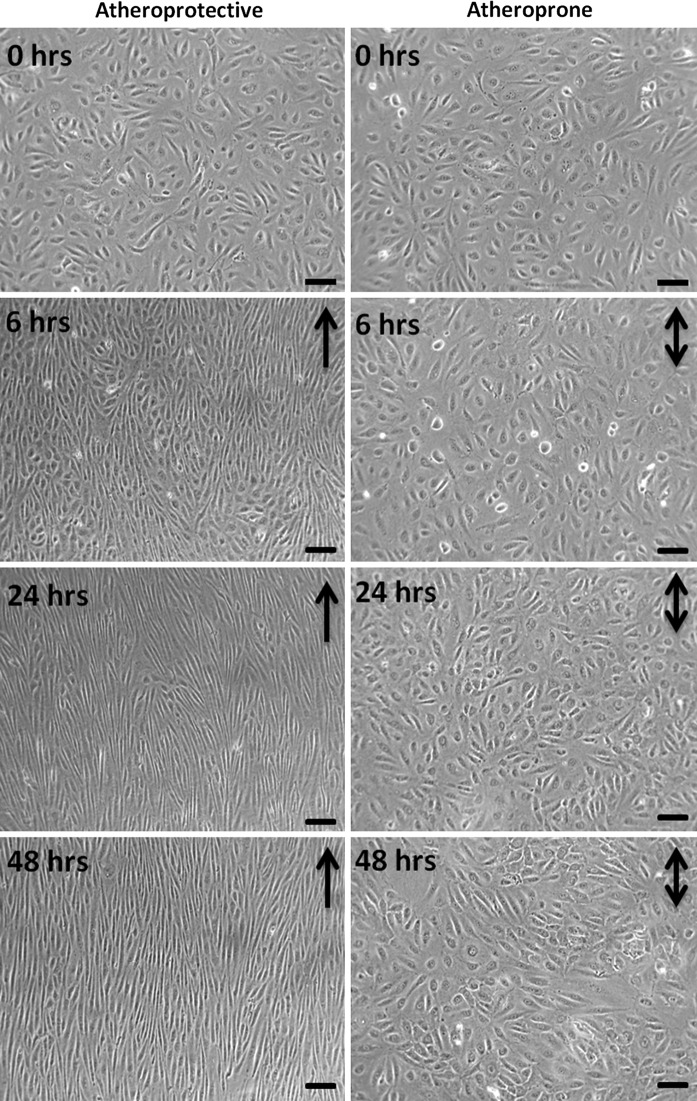
We also tested experimentally the device for EC exposure to WSS for extended period of time. We cultured monolayers of HUVECs to assess cell viability and morphology, and to verify that exposure to laminar WSS induces expected changes in cell alignment and elongation. As shown in Fig. 7, HUVECs exposed to unidirectional and sinusoidal WSS waveform ranging from 8 to 10 dyn/cm2 progressively aligned with the flow direction, starting at 24 h of flow exposure. At 48 h of flow exposure, HUVECs showed a strong alignment in the flow direction and a major elongation. Furthermore, as shown in Fig. 8, HUVECs exposed to atheroprotective WSS, elongated and aligned in the flow direction after just 6 h and the morphology was maintained for up to 48 h. On the contrary, HUVECs exposed to atheroprone WSS did not elongate neither align. These cells maintained the cobblestone shape, as already reported in literature (Dai et al. 2004). This demonstrates that our device makes it possible to maintain adequate culture conditions, and the capability of the system to induce flow-dependent ECs morphology.
Fig. 7.
HUVEC monolayer exposed to 0, 6, 24, 48 h of sinusoidal WSS stimulation (8–10 dyn/cm2). Black arrows indicate the flow direction. Magnification 20×, scale bar 30 μm
Fig. 8.
HUVEC monolayer exposed to 0, 6, 24, 48 h of atheroprotective (left) and atheroprone, (right) WSS stimulation. Black arrows indicate the flow direction. Magnification 20×, scale bar 30 μm
Discussion
Our investigation allowed to develop and test a real-time controlled CPD, suitable for providing a wide range of WSS waveforms by varying cone angular velocity magnitude, sense of rotation and frequency of oscillations. Although CPD systems have been investigated extensively and used in biomedical applications, few studies have investigated the effects of realistic WSS stimulations and considered the limitations of the system in reproducing high frequency components of physiological and pathological WSS waveforms, derived from patient-specific computational studies (Buschmann et al. 2005; Dai et al. 2004; Himburg et al. 2007; White et al. 2005).
The solutions adopted in our CPD design led to a system that is easy to use and can accurately reproduce a wide series of WSS stimuli over cell cultures. By using disposable culture plates within the device, we ensured ease of experiment set-up and a cost-effective solution that allows several biological determinations on the cell monolayer, after flow exposure. The calibrated spacers used as cone supports provided a simple and accurate method for positioning the cone and modulating the gap h0 between the cone apex and the plate surface. The addition of high molecular weight dextran to cell culture medium, allows us to investigate a wide range of WSS magnitudes ensuring the onset of primary, laminar flow without compromising cell biology (Rouleau et al. 2010). Even at the highest cone rotation velocity, limited to 20 rad/s for safety reasons, the modified Reynolds number remains lower than 0.5, and thus negligible secondary flows develop (Sdougos et al. 1984). Finally, the motion laws generated as ASCII-text files allow us to create a wide range of WSS waveforms very easily.
The CPD reliability and capability in generating accurate WSS stimulations at the plate level was investigated both analytically and numerically. The results showed that, despite a radial dependence of WSS magnitude, the stimulation on cell monolayer could be considered uniform on the plate for radii bigger than 25 mm. The propagation time, required for transmitting cone velocity changes at the plate level, can be estimated analytically. According to Eq. (3) we calculated the td present at maximum plate radius. The analytical approach, however, overestimates td since it considers acceleration of cone an instantaneous step. Cone accelerations imposed by motion laws have a defined magnitude, thus the td that occurs between cone velocity and WSS changes is lower. The results allow us to reproduce WSS waveforms with frequency components up to 10 Hz. Below this threshold it is possible to reproduce WSS waveforms with no frequency component loss and coherence between stimulations generated at different radial positions on the plate surface.
To prove the capability of the system to maintain cell vitality and proper culture conditions, we observed cells behavior at 48 h of unidirectional, sinusoidal WSS stimuli. We verified that exposure of EC to 48 h of 8–10 dyn/cm2 sinusoidal WSS stimuli induced cell elongation and alignment and reorganization of cell monolayer. The EC elongation, previously reported by other groups (Remuzzi et al. 1984; Tzima et al. 2001), demonstrates the capability of the CPD to induce flow-dependent cell morphological adaptations. In addition, the capability of the system to induce flow-dependent morphological adaptations has been further verified by exposing HUVECs to the atheroprotective and atheroprone WSS waveforms, as calculated in a model of the carotid bifurcation (Dai et al. 2004). We have observed a strong, relatively fast elongation and alignment in cells exposed to the unidirectional and protective stimulation. On the contrary cells exposed to the low, oscillating WSS stimulus, representatives of those found in carotid areas prone to develop atherosclerosis, have maintained a cobblestone shape. EC elongation is considered a flow-induced protective effect on endothelium, since it is functional for control of tissue permeability and for upregulation of Krüppel like factor 2 (Boon et al. 2010). This transcription factor is known to induce EC quiescence and to prevent EC dysfunction. To further investigate flow-induced effects on EC, our system can be used to visualize cells morphology and protein expression by immunofluorescence staining. The system we developed may also be used to quantify protein and gene expression by performing Western-blot or RT-PCR analysis on ECs detached from the plate surface, and finally to quantify protein content in cell medium.
Since the system is used within a cell incubator, the heat exchange of the system with the surrounding isolated environment may cause an increase in temperature over the optimal value for fast, prolonged cone rotation. In the present configuration, we verified the maintenance of the correct temperature of 37 °C for WSS waveforms up to 25–30 dyn/cm2. Since the protective effects of unidirectional WSS such as cell elongation, cytoskeletal remodeling and Krüppel like factor 2 upregulation have already been observed with exposure to 25 dynes/cm2 or lower stimuli (Boon et al. 2010; Helmke 2005; Malek et al. 1999), the level of WSS that can be obtained with our device is adequate for investigating the majority of WSS waveforms observable within human vasculature.
In addition, the capability of the CPD to correctly reproduce fluid flow high frequency oscillations, allows us to investigate the effects of realistic WSS waveforms like those calculated using CFD methods. The endothelial sensitivity to shear stress frequency harmonics and the possible role in the focal development of vascular inflammation have recently been investigated (Feaver et al. 2013), but the overall mechanisms controlling frequencies’ differential mechanotransduction remain to be elucidated. A previous study (Himburg et al. 2007) already showed that besides magnitude, WSS frequency regulates a number of EC genes involved in endothelial inflammatory response. To our knowledge no previous investigations have defined the frequency threshold correctly reproduced by CPD. This aspect is important since frequency components of WSS waveforms may have an important role in atherosclerotic lesions development as well as in other vascular pathological changes such as the neointimal hyperplasia. This condition usually develop in vascular grafts and in vascular access created in hemodialysis patients with native vessels, where flow conditions are characterized by high flow rate and blood velocity gradients near the vessel wall (Fitts et al. 2014; Remuzzi and Ene-Iordache 2013).
In conclusion, the CPD we have developed and tested is a suitable apparatus for investigating highly unsteady WSS waveforms effects on cell monolayer cultures and for highlighting the biological processes induced by different stimuli and involved in pathology development. Our CPD offers the possibility to accurately modulate WSS magnitude by controlling cone rotation velocity and to maintain a relatively uniform instantaneous shear stress field over the cell culture, underneath the cone.
Acknowledgments
This research was supported by the Cariplo Foundation (Fondazione Cariplo, Milano, Italy) under the “I4BIO—Innovazione e Bioingegneria” Project. Marco Franzoni was the recipient of a research fellowship from the ARMR Foundation (Aiuti per la Ricerca sulle Malattie Rare, Bergamo, Italy).
Compliance with ethical standards
Conflict of interest
All the authors have declared no competing interests.
References
- Ando J, Yamamoto K. Effects of shear stress and stretch on endothelial function. Antioxid Redox Signal. 2011;15:1389–1403. doi: 10.1089/ars.2010.3361. [DOI] [PubMed] [Google Scholar]
- Blackman BR, Garcia-Cardena G, Gimbrone MA., Jr A new in vitro model to evaluate differential responses of endothelial cells to simulated arterial shear stress waveforms. J Biomech Eng. 2002;124:397–407. doi: 10.1115/1.1486468. [DOI] [PubMed] [Google Scholar]
- Boon RA, Leyen TA, Fontijn RD, Fledderus JO, Baggen JM, Volger OL, van Nieuw Amerongen GP, Horrevoets AJ. KLF2-induced actin shear fibers control both alignment to flow and JNK signaling in vascular endothelium. Blood. 2010;115:2533–2542. doi: 10.1182/blood-2009-06-228726. [DOI] [PubMed] [Google Scholar]
- Buschmann MH, Dieterich P, Adams NA, Schnittler HJ. Analysis of flow in a cone-and-plate apparatus with respect to spatial and temporal effects on endothelial cells. Biotechnol Bioeng. 2005;89:493–502. doi: 10.1002/bit.20165. [DOI] [PubMed] [Google Scholar]
- Chatzizisis YS, Coskun AU, Jonas M, Edelman ER, Feldman CL, Stone PH. Role of endothelial shear stress in the natural history of coronary atherosclerosis and vascular remodeling: molecular, cellular, and vascular behavior. J Am Coll Cardiol. 2007;49:2379–2393. doi: 10.1016/j.jacc.2007.02.059. [DOI] [PubMed] [Google Scholar]
- Chiu JJ, Chien S. Effects of disturbed flow on vascular endothelium: pathophysiological basis and clinical perspectives. Physiol Rev. 2011;91:327–387. doi: 10.1152/physrev.00047.2009. [DOI] [PMC free article] [PubMed] [Google Scholar]
- Dai G, Kaazempur-Mofrad MR, Natarajan S, Zhang Y, Vaughn S, Blackman BR, Kamm RD, García-Cardeña G, Gimbrone MA., Jr Distinct endothelial phenotypes evoked by arterial waveforms derived from atherosclerosis-susceptible and -resistant regions of human vasculature. Proc Natl Acad Sci USA. 2004;101:14871–14876. doi: 10.1073/pnas.0406073101. [DOI] [PMC free article] [PubMed] [Google Scholar]
- Davies PF, Civelek M, Fang Y, Fleming I. The atherosusceptible endothelium: endothelial phenotypes in complex haemodynamic shear stress regions in vivo. Cardiovasc Res. 2013;99:315–327. doi: 10.1093/cvr/cvt101. [DOI] [PMC free article] [PubMed] [Google Scholar]
- Ene-Iordache B, Remuzzi A. Disturbed flow in radial-cephalic arteriovenous fistulae for haemodialysis: low and oscillating shear stress locates the sites of stenosis. Nephrol Dial Transplant. 2012;27:358–368. doi: 10.1093/ndt/gfr342. [DOI] [PubMed] [Google Scholar]
- Feaver RE, Gelfand BD, Blackman BR. Human haemodynamic frequency harmonics regulate the inflammatory phenotype of vascular endothelial cells. Nat Commun. 2013;4:1525. doi: 10.1038/ncomms2530. [DOI] [PMC free article] [PubMed] [Google Scholar]
- Fitts MK, Pike DB, Anderson K, Shiu YT. Hemodynamic Shear Stress and Endothelial Dysfunction in Hemodialysis Access. Open Urol Nephrol J. 2014;7:33–44. doi: 10.2174/1874303X01407010033. [DOI] [PMC free article] [PubMed] [Google Scholar]
- Helmke BP. Molecular Control of cytoskeletal mechanics by hemodynamic forces. Physiology. 2005;20:43–54. doi: 10.1152/physiol.00040.2004. [DOI] [PubMed] [Google Scholar]
- Himburg HA, Dowd SE, Friedman MH. Frequency-dependent response of the vascular endothelium to pulsatile shear stress. Am J Physiol Heart Circ Physiol. 2007;293:H645–H653. doi: 10.1152/ajpheart.01087.2006. [DOI] [PubMed] [Google Scholar]
- Jaffe EA, Nachman RL, Becker CG, Minick CR. Culture of human endothelial cells derived from umbilical veins. Identification by morphologic and immunologic criteria. J Clin Invest. 1973;52:2745–2756. doi: 10.1172/JCI107470. [DOI] [PMC free article] [PubMed] [Google Scholar]
- Malek AM, Alper SL, Izumo S. Hemodynamic shear stress and its role in atherosclerosis. JAMA. 1999;282:2035–2042. doi: 10.1001/jama.282.21.2035. [DOI] [PubMed] [Google Scholar]
- OpenFOAM Team (2014) The OpenFOAM Foundation http://www.openfoam.org. Accessed 26 Jun 2015
- Rajabi-Jagahrgh E, Krishnamoorthy MK, Wang Y, Choe A, Roy-Chaudhury P, Banerjee RK. Influence of temporal variation in wall shear stress on intima-media thickening in arteriovenous fistulae. Semin Dial. 2013;26:511–519. doi: 10.1111/sdi.12045. [DOI] [PubMed] [Google Scholar]
- Remuzzi A, Ene-Iordache B. Novel Paradigms for Dialysis Vascular Access: upstream Hemodynamics and Vascular Remodeling in Dialysis Access Stenosis. Clin J Am Soc Nephrol. 2013;8:2186–2193. doi: 10.2215/CJN.03450413. [DOI] [PMC free article] [PubMed] [Google Scholar]
- Remuzzi A, Dewey CF, Jr, Davies PF, Gimbrone MA., Jr Orientation of endothelial cells in shear fields in vitro. Biorheology. 1984;21:617–630. doi: 10.3233/bir-1984-21419. [DOI] [PubMed] [Google Scholar]
- Rouleau L, Rossi J, Leask RL. Concentration and time effects of dextran exposure on endothelial cell viability, attachment, and inflammatory marker expression in vitro. Ann Biomed Eng. 2010;38:1451–1462. doi: 10.1007/s10439-010-9934-4. [DOI] [PubMed] [Google Scholar]
- Sdougos HP, Bussolari SR, Dewey CF. Secondary flow and turbolence in a cone and plate device. J Fluid Mech. 1984;138:379–404. doi: 10.1017/S0022112084000161. [DOI] [Google Scholar]
- Sucosky P, Padala M, Elhammali A, Balachandran K, Jo H, Yoganathan AP. Design of an ex vivo culture system to investigate the effects of shear stress on cardiovascular tissue. J Biomech Eng. 2008;130:035001. doi: 10.1115/1.2907753. [DOI] [PMC free article] [PubMed] [Google Scholar]
- Sui B, Gao PY, Lin Y, Jing L, Sun S, Qin H. Hemodynamic parameters distribution of upstream, stenosis center, and downstream sides of plaques in carotid artery with different stenosis: a MRI and CFD study: a preliminary study. Acta Radiol. 2015;56:347–354. doi: 10.1177/0284185114526713. [DOI] [PubMed] [Google Scholar]
- Sutera SP, Nowak MD. A programmable, computer-controlled cone-plate viscometer for the application of pulsatile shear stress to platelet suspension. Biorheology. 1988;25:449–459. doi: 10.3233/bir-1988-25306. [DOI] [PubMed] [Google Scholar]
- Tzima E, del Pozo MA, Shattil SJ, Chien S, Schwartz MA. Activation of integrins in endothelial cells by fluid shear stress mediates Rho-dependent cytoskeletal alignment. EMBO J. 2001;20:4639–4647. doi: 10.1093/emboj/20.17.4639. [DOI] [PMC free article] [PubMed] [Google Scholar]
- van Thienen JV, Fledderus JO, Dekker RJ, Rohlena J, van Ijzendoorn GA, Kootstra NA, Pannekoek H, Horrevoets AJ. Shear stress sustains atheroprotective endothelial KLF2 expression more potently than statins through mRNA stabilization. Cardiovasc Res. 2006;72:231–240. doi: 10.1016/j.cardiores.2006.07.008. [DOI] [PubMed] [Google Scholar]
- White CR, Stevens HY, Haidekker M, Frangos JA. Temporal gradients in shear, but not spatial gradients, stimulate ERK1/2 activation in human endothelial cells. Am J Physiol Heart Circ Physiol. 2005;289:H2350–H2355. doi: 10.1152/ajpheart.01229.2004. [DOI] [PubMed] [Google Scholar]


