Abstract
Oral cancer is the eleventh most prevalent cancer worldwide. The most prevalent oral cancer is oral squamous cell carcinoma (OSCC). Damnacanthal (DAM) and nordamnacanthal (NDAM), the anthraquinone compounds, are isolated from the root of Morinda citrifolia L. (Noni), which has been used for the treatment of several chronic diseases including cancer. The objectives of this study were to evaluate the cytotoxicity, cell death mode, cell cycle, and the molecular mechanism of apoptosis induced by DAM and NDAM on OSCC. The cytotoxic effects of these compounds against OSCC cell lines were determined by MTT assay. The cell death mode was analysed by DNA laddering and FITC-annexin V/PI flow cytometric assays. In addition, the mechanism of apoptosis induced by DAM and NDAM was detected using mitochondrial membrane potential, Cytochrome c, and caspases assays. Finally, the effect of DAM and NDAM on cell cycle phase distribution of OSCC cells was detected by flow cytometry. In the present study, DAM and NDAM showed cytotoxicity towards OSCC cell lines and the maximum growth inhibition for both compounds was observed in H400 cells with IC50 value of 1.9 and 6.8 μg/ml, respectively, after 72 h treatment. The results also demonstrated the inhibition of H400 OSCC cells proliferation, internucleosomal cleavage of DNA, activation of intrinsic apoptosis pathway, and cell cycle arrest caused by DAM and NDAM. Therefore, these findings suggest that DAM and NDAM can be potentially used as antitumor agents for oral cancer therapy.
Keywords: Damnacanthal and nordamnacanthal, Human oral squamous cell carcinoma (OSCC), Apoptosis, Mitochondrial membrane potential, Cytochrome c
Introduction
Cancer is one of the most common causes of fatality and morbidity worldwide. Based on the world cancer report announced by IARC, GLOBOCAN 2012, an estimated 14.1 million new cancer cases and 8.2 million cancer-related deaths occurred in 2012, compared to 12.7 million and 7.6 million, respectively, in 2008 (Ferlay et al. 2014). Oral cavity cancer, a subtype of head and neck cancer, is the 11th most prevalent cancer worldwide (Stewart and Kleihues 2003). There were approximately 300,400 new cases and 145,400 deaths being attributed to oral cavity cancer globally in 2012 (Torre et al. 2015). The most prevalent oral cancer is oral squamous cell carcinoma (OSCC), which comprises 90 % of all oral cancers (Neville and Day 2002). In Malaysia, the incidence of oral cancer differs by gender and ethnic group. Indian and indigenous people of Malaysia have the highest prevalence of this cancer (Ghani et al. 2011). Heavy or regular use of tobacco, excessive alcohol consumption, fruit and vegetable deficiency in diet, chewing paan and betel nut in addition to poor oral hygiene are the major risk factors associated with oral cancer (Balaram et al. 2002; Pavia et al. 2006). OSCC results in high mortality and morbidity rates around the world, since it is commonly detected in advanced stages prior to treatment (Johnson et al. 2011).
The typical strategies of OSCC therapy rely on surgery, radiotherapy, chemotherapy and targeted therapy. Oral cancer therapy basically aims to recognize chemopreventive as well as treatment agents that selectively target OSCC cells without having cytotoxic impacts on normal cells (Sato et al. 2013). Regardless of recent progress in oral squamous cell carcinoma therapy, the prognosis of these patients has not ameliorated significantly over the past 20 years. Development of resistance and unbearable side effects of current chemotherapy drugs are considerable problems that need to be settled (Haghiac and Walle 2005). In cancer therapy, almost 74 % of anticancer agents are naturally-derived products; therefore, one of the reasonable and effective strategies regarding cancer chemoprevention is the research for new anti-tumour agents from plant sources (Gordaliza 2007).
Morinda citrifolia L., commonly known as ‘noni’, belongs to the Rubiaceae family. It is native to the Pacific islands, Hawaii, Caribbean, Asia and Australia. Damnacanthal (DAM) and nordamnacanthal (NDAM) are part of a general class of athraquinone derivatives which are isolated from Morinda species. Both DAM and NDAM incorporate some exclusive chemical and biological characteristics (Alitheen et al. 2010). DAM displayed cytotoxic activity against breast cancer cell lines along with small cell lung cancer cell lines (Kanokmedhakul et al. 2005). In addition, it was documented that DAM isolated from the root of noni acted as an inhibitor associated with ras function, which is considered to be linked to the signal transduction in various human cancers including colon, lungs and leukaemia (Hiramatsu et al. 1993). NDAM has also featured many biological properties, which include antioxidant activities, cytotoxic properties and anti-cancer effects on human B-lymphoblastoid cell lines (Jasril et al. 2003).
Apoptosis, or programmed cell death, is a sophisticated and highly intricate mechanism which consists of two distinct pathways; intrinsic (mitochondrial) and extrinsic (death receptor) (Elmore 2007). Mitochondria perform crucial roles in apoptotic cell death and it is becoming one of the key targets in screening treatment agents against cancer (Kumar et al. 2009). The objectives of this study were to evaluate the anti-proliferative or cytotoxic activity and induction of apoptosis capability of DAM and NDAM on the most common type of oral cancer, oral squamous cell carcinoma (OSCC) cells. To achieve these objectives various assays were carried out. MTT assay was performed to detect the cytotoxicity or cell growth inhibition effect of DAM and NDAM. In addition, DNA laddering and FITC-annexin V/PI assays were carried out to determine the cell death mode induced by DAM and NDAM. Moreover, the molecular mechanism of apoptosis induced by DAM and NDAM against OSCC cell lines was determined using mitochondrial membrane potential, Cytochrome c and caspases assays. Furthermore, cell cycle analysis was performed to investigate the effect of DAM and NDAM on cell cycle phase distribution of OSCC cells.
Materials and methods
Damnacanthal and nordamnacanthal
The damnacanthal and nordamnacanthal (Fig. 1) were kindly supplied by Prof. Dr. Nor Hadiani Ismail from Universiti Teknologi MARA (UiTM, Shah Alam Selangor, Malaysia) were isolated from the roots of Morinda citrifolia (Ismail et al. 1997). The compounds in powdered-form were dissolved in dimethylsulphoxide (DMSO) (Vivantis Technologies Sdn. Bhd, Subang Jaya, Malaysia) to get a stock solution of 10 mg/mL, which was then stored at −20 °C in aliquots for future use.
Fig. 1.
The molecular structure of Damnacanthal (a) and Nordamnacanthal (b)
Cell lines and culture conditions
The human oral squamous cell carcinoma cell lines used in this study, H103, H400, H413, H357, H376 and H314, were kindly provided by Professor. Dr. Ian Charles Paterson (University of Malaya, Kuala Lumpur, Malaysia) (Table 1). OSCC cell lines were routinely cultured in DMEM/Ham’s F-12 medium (Nacalai Tesque, Kyoto, Japan) supplemented with 10 % foetal bovine serum (J R Scientific, Inc., Woodland, CA, USA), 100 Units/mL penicillin and 100 μg/mL streptomycin (Sigma-Aldrich, St. Louis, MO, USA) at 37 °C in a humidified atmosphere of 5 % CO2. In the current study, 3T3 (normal mouse fibroblast) (ATCC, Manassas, VA, USA) cells were used as normal cell line. Growth and morphology of the cells were regularly monitored and the culture medium was renewed 2–3 times weekly.
Table 1.
Human OSCC cell lines and the sites from which the cell lines have been derived
| Cell line | H103 | H400 | H413 | H357 | H376 | H314 |
|---|---|---|---|---|---|---|
| Site | Tongue | Alveolar process | Buccal mucosa | Tongue | Floor of mouth | Floor of mouth |
MTT assay
Cell growth and viability were determined using the 3-(4, 5-dimethylthiazol-2-yl)-2, 5-diphenyltetrazolium bromide (MTT) assay. In brief, OSCC cell lines were seeded into 96-well plates (Nunclon™, Roskilde, Denmark) at a density of 1 × 10⁵ cells/mL in total volume of 100 μL in each well of 96-well plate. Following a culture at 37 °C for 24 h, the cells were treated with various concentrations of DAM and NDAM by serial dilution in DMEM medium to give a volume of 100 μL in each well of the plate. After incubation at 37 °C for 72 h, 20 μL of MTT solution (5 mg/mL in phosphate buffer saline; Invitrogen, Carlsbad, CA, USA) was added to each well and the cells were further incubated for 4 h at 37 °C and 5 % CO2. MTT was reduced to insoluble purple formazan crystals by metabolically active cells in the wells. Subsequently the medium was removed and MTT formazan crystals were dissolved in 150 μL of DMSO. The optical density (OD) was measured at 575 nm with reference at 650 nm wavelength using Tecan Infinite 200 Pro ELISA plate reader (Tecan, Männedorf, Switzerland). The assay for each concentration of compounds was performed in triplicate and the inhibitory concentration of compounds that inhibited 50 % (IC50) of OSCC cell growth was determined from absorbance versus concentration curve.
DNA fragmentation analysis
Apoptotic DNA fragmentation or internucleosomal cleavage of DNA is an essential feature of apoptosis. In brief, H400 OSCC cell lines were plated in 6-well plates at a concentration of 5 × 10⁵ cells/mL. The treatment was performed at two different concentrations of the compounds, IC50 (1.9 ± 0.014 and 6.8 ± 0.019 μg/mL for DAM and NDAM, respectively) and IC75 (3.4 and 22 μg/mL for DAM and NDAM, respectively) for different time intervals (24, 48 and 72 h). All cells (including floating cells) were harvested and washed with phosphate buffer saline (PBS). Total DNA was extracted from both untreated and treated cells using Vivantis GF-1 Nucleic Acid Extraction kit according to manufacturer’s instruction. Isolated DNA was analyzed on a 1.5 % agarose gel electrophoresis at 50 V for 1 h. DNA fragments, containing multimers of 180–200 base pairs, were visualized by Ethidium Bromide under ultraviolet light using a gel documentation system.
FITC-annexin V/PI double staining
Apoptotic cell death was quantitatively determined by FITC-annexin V/propidium iodide (PI) assay kit (BD Bioscience-Pharmingen, San Diego, CA, USA) using flow cytometry. Approximately 5 × 10⁵ H400 OSCC cells were washed with cold PBS, resuspended in 100 μL binding buffer and stained with 5 μL of FITC-conjugated Annexin V and 5 μL of PI. Following the 15 min incubation in a dark room, 400 μL of binding buffer was added. Finally the cells were analyzed using CyAn ADP flow cytometer (Beckman Coulter, Brea, CA, USA). Early and late apoptosis was examined on fluorescence 2 (FL2 for propidium iodide) versus fluorescence 1 (FL1 for annexin) plots. For each sample, 10,000 events were collected and the results were analysed using Summit v4.3 software.
Analysis of caspases activities
Caspases perform essential effector functions in apoptosis in mammalian cells. Caspase-3/7, 8 and 9 assays were carried out in triplicates using Caspase-Glo 3/7, 8 and 9 Kit (Promega, Fitchburg, WI, USA) according to the manufacturer’s protocol. H400 OSCC cell lines were seeded in a white 96-well plate (Nunclon™, Denmark) at the concentration of 5 × 10⁴ cells/mL. The cells were treated with DAM and NDAM at three different concentrations of compounds IC25 (1.4 and 3.6 μg/mL for DAM and NDAM, respectively), IC50 (1.9 ± 0.014 and 6.8 ± 0.019 μg/mL for DAM and NDAM, respectively) and IC75 (3.4 and 22 μg/mL for DAM and NDAM, respectively) for 24 h. Following the incubation period, 100 μL of the caspase-Glo reagent was added to the wells and further incubated for 1 h. Finally, the caspases activities were measured using Tecan Infinite 200 Pro (Tecan, Männedorf, Switzerland) microplate reader.
Mitochondrial Membrane Potential (ΔΨm) assay
The assay is based on detection of the mitochondrial membrane potential changes in the cells by the cationic, lipophilic JC-10 dye. The assay was performed in triplicate using Mitochondrial Membrane Potential Kit (Abcam, Cambridge, UK) according to manufacturer’s protocol. Briefly, H400 OSCC cells were seeded in a 96-well plate with black walls and clear bottom at the concentration of 1 × 10⁵ cells/mL at the total volume of 90 μl. The treatment was performed by adding 10 μl of 10X (10× IC50) DAM and NDAM compounds for 24 h. Then the cells were incubated with 50 μL of JC-10 dye-loading solution at 37 °C for 30 min. Finally 50 μL of Assay Buffer B was added into the dye loading plate before reading the fluorescence intensity. The fluorescent intensities for both J-aggregates and monomeric forms of JC-10 were measured at Ex/Em = 490/525 nm and 490/590 nm using ELISA microplate reader (Tecan, Männedorf, Switzerland). The fluorescence intensity value for the blank reaction (the cell culture medium without cells) was subtracted from the experimental values.
Analysis of Cytochrome c
Measurement of Cytochrome c release from mitochondria is a tool to identify the first early stages of commencing apoptosis in the cells. Quantitative detection of Cytochrome c was performed in duplicate using ELISA kit (Invitrogen, USA) according to the manufacturer’s protocol. In brief, H400 OSCC cells were seeded in a 75 cm2 flasks (Corning, Corning, NY, USA) at a concentration of 1.2 × 10⁵ cells/mL. The treatment was performed according to IC50 value of compounds for 24 h. The recommended cell lysis buffer in the protocol [10 mM Tris (pH 7.4), 100 mM NaCl, 1 mM EDTA, 1 mM EGTA, 1 mM NaF, 20 mM Na4P2O7, 2 mM Na3VO4, 1 % Triton X-100, 10 % glycerol, 0.1 % SDS, 0.5 % deoxycholate, 1 mM PMSF (stock is 0.3 M in DMSO) and Protease inhibitor cocktail] was used for extraction of proteins from the cells. A monoclonal antibody specific for Cytochrome c has been coated onto the wells of plate. Samples, including a standard (1: 2 dilution, in duplicate and ranging from 0 to 5 ng/ml) containing Cytochrome c, were pipetted into the wells. Throughout the first incubation, the Cytochrome c antigen were bound to the immobilized antibody. After washing, a biotin-conjugated antibody specific for Cytochrome c was added to the wells. After washing the surplus detection antibody, Streptavidin-HRP (enzyme) was added. This bound to the biotinylated detection antibody to create the four-member sandwich. Ultimately, following the third incubation as well as washing to eliminate all the extra Streptavidin-HRP, the substrate solution was added to the wells to create the colored products. Subsequently, the reaction was stopped by addition of acid and absorbance was measured at 450 nm using ELISA microplate reader (Tecan, Männedorf, Switzerland). A standard curve was developed to determine the Cytochrome c concentration.
Cell cycle analysis
The effect of DAM and NDAM on the cell cycle phase distribution of H400 OSCC cell lines were detected by flow cytometry. This assay is based on quantitative analysis of DNA content in cultured cells using the nucleic acid stain propidium iodide. OSCC cells were grown at a concentration of 5 × 10⁵ cells/mL medium in T-25 flasks. At roughly 60 % confluent, the cells were treated with respective IC50 value of compounds for 24 and 48 h. After the incubation time, the cells were harvested by centrifugation at 500 g for 5 min. Subsequently, the cells were fixed gently by ice-cold 66 % ethanol and incubated overnight at 4 °C. Then, the cells were spun down and washed twice with PBS. Ultimately the cell pellets were stained in PBS buffer containing 1 mg/mL Propidium Iodide and 110,000 U/mL RNase A. The stained cells were analysed using CyAn ADP flow cytometer (Beckman Coulter, USA). Propidium iodide fluorescence was collected in the appropriate channel (FL2) using 488 nm laser illumination. The percentage of cells in G1, S and G2/M phases were assessed using the ModFit LT software. In each experiment, 10,000 events per sample were recorded.
Statistical analysis
The data are presented as mean ± SEM. The statistical differences between the treated and control groups were determined using independent-sample t test. One-way analysis of variance (ANOVA) was also used for multiple comparisons, where P < 0.05 was regarded as statistically significant. Asterisks indicate significant difference (*P < 0.05, **P < 0.01) as compared to control.
Results
Cell viability assay
To determine the cytotoxic and growth inhibition effects of DAM and NDAM in vitro, the OSCC cell lines (H103, H400, H413, H357, H376 and H314) were exposed to various concentrations of the compounds for 72 h. The inhibitory effect against OSCC cell lines was assessed with the half-maximal inhibition concentration (IC50) of DAM and NDAM (Table 2). The IC50 values for DAM-treated H103, H400, H413, H357, H376 and H314 cell lines were 3 ± 0.040, 1.9 ± 0.014, 2.9 ± 0.005, 2 ± 0.005, 2.6 ± 0.005 and >30 μg/mL, respectively. Whereas the IC50 values for NDAM-treated H103, H400, H413, H357, H376 and H314 cell lines were 8 ± 0.045, 6.8 ± 0.019, 12.2 ± 0.030, 13 ± 0.026, 10 ± 0.062 and >30 μg/mL, respectively. On the other hand, the compounds did not show any significant inhibitory effect against 3T3 cells. The lowest IC50 values for both compounds were observed in H400 OSCC cells and thus H400 was selected for further study (Table 2). Furthermore, the IC50 concentration of the DAM compound was lower than the IC50 concentrations of NDAM compound in all cell lines.
Table 2.
Cytotoxicity of DAM and NDAM on OSCC and 3T3 cells after 72 h treatment
| Cell line | DAM | NDAM |
|---|---|---|
| IC50 ± SEM (μg/mL) | ||
| H103 | 3 ± 0.040 | 8 ± 0.045 |
| H400 | 1.9 ± 0.014 | 6.8 ± 0.019 |
| H413 | 2.9 ± 0.005 | 12.2 ± 0.030 |
| H357 | 2 ± 0.005 | 13 ± 0.026 |
| H376 | 2.6 ± 0.005 | 10 ± 0.062 |
| H314 | >30 | >30 |
| 3T3 | >30 | >30 |
Data are presented as mean ± SEM from three independent experiments (n = 3). Values in bold characters show maximum growth inhibition compared to other cell lines
DNA fragmentation assay
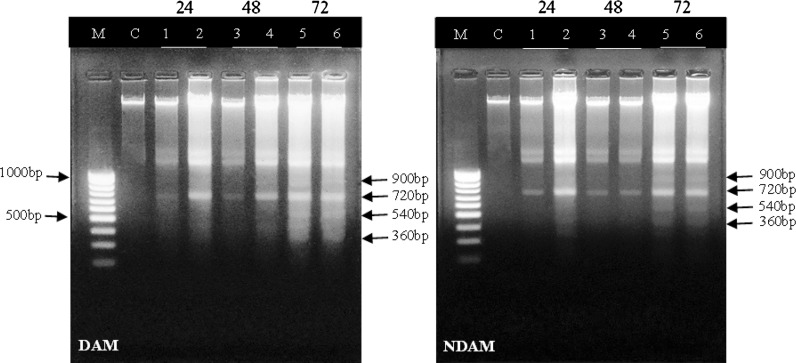
To detect the cell death mode mediated by DAM and NDAM, DNA laddering assay was performed for the IC50 and IC75 concentrations of compounds at three different time points (24, 48, and 72 h). In Fig. 2 degradation of chromosomal DNA into small internucleosomal fragments, a typical feature of apoptosis can be observed obviously in DAM and NDAM-treated H400 cells after 48 and 72 h in both concentrations. In addition, the DNA ladder was detected indistinctly in H400 cells treated with DAM and NDAM at IC50 concentration after 24 h. In contrast, the DNA of control cells showed no fragmentation or smearing pattern.
Fig. 2.
Apoptotic DNA fragmentation in H400 cells treated with IC50 and IC75 concentrations of DAM and NDAM for 24, 48 and 72 h. Images are representative of two independent experiments. M 1 kb DNA marker, C control cells, Lane 1 Treatment with IC50 concentration for 24 h, Lane 2 Treatment with IC75 concentration for 24 h, Lane 3 Treatment with IC50 concentration for 48 h, Lane 4 Treatment with IC75 concentration for 48 h, Lane 5 Treatment with IC50 concentration for 72 h, Lane 6 Treatment with IC75 concentration for 72 h
Flow cytometric analysis of apoptosis by FITC-annexin V/PI
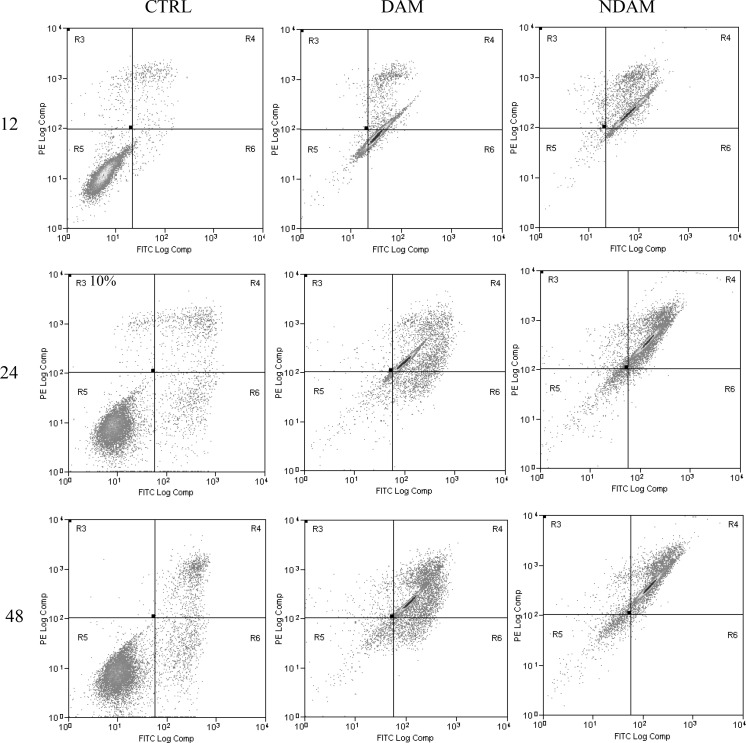
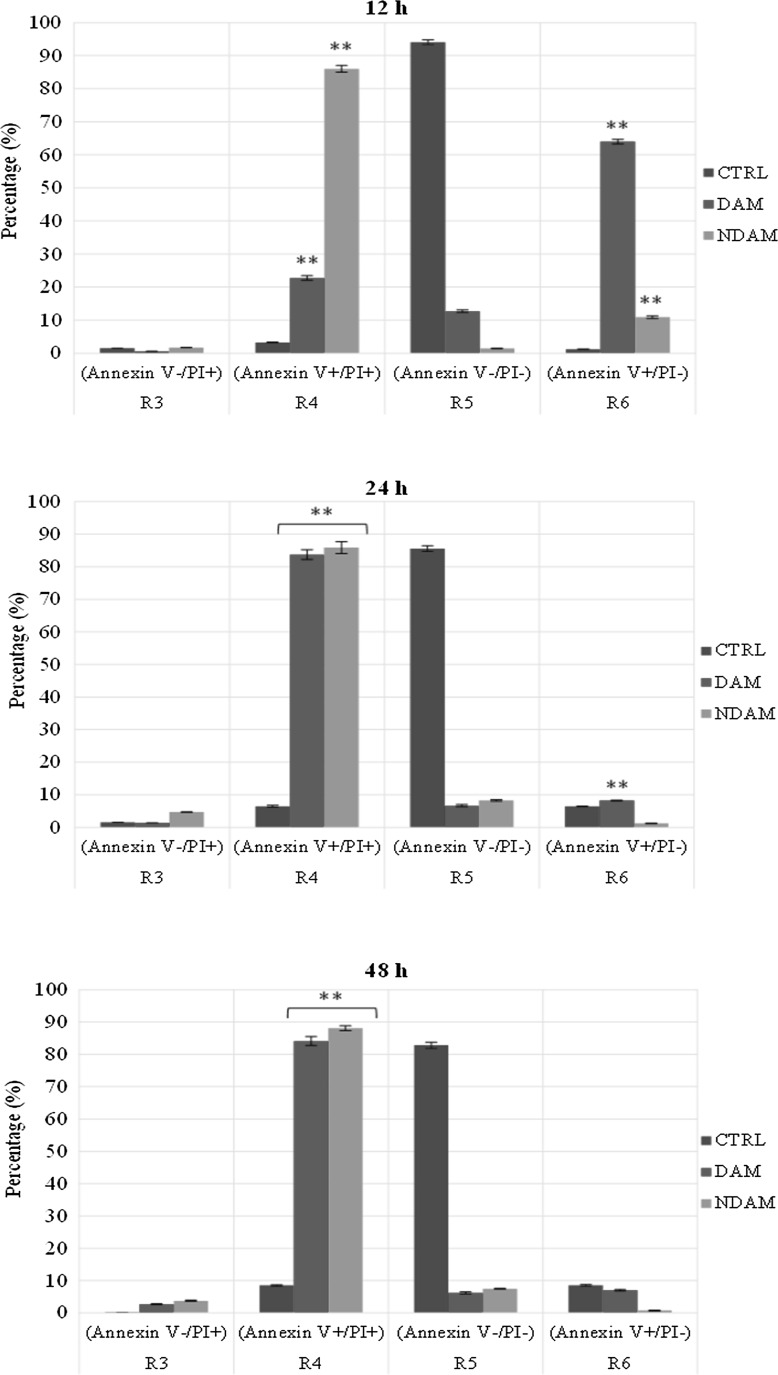
To confirm apoptosis induced by DAM and NDAM, the phosphatidylserine (PS) externalisation, which was an early event in the apoptosis pathway, was measured using annexin V-FITC and propidium iodide double staining. Treatment of H400 OSCC cells at IC50 concentration of DAM and NDAM for 12, 24 and 48 h was identified to induce apoptosis through the observation of a shift in live cell population from early to late stage of apoptosis/secondary necrosis. Tracking the movement of DAM and NDAM-treated H400 cells through the quadrant stages showed a dramatic reduction in the percentage of viable cells and a significant increment in the percentage of early (R6) and late (R4) apoptosis after 12 and 24 h treatment, compared to the control cells. Moreover, the percentage of DAM and NDAM-treated H400 cells remained almost unchanged after 48 h treatment as opposed to 24 h treatment (Fig. 3). Therefore, this study confirms that apoptosis is the major mode of cell death induced by these two compounds in H400 OSCC cells.
Fig. 3.
Flow cytometric analysis of apoptosis in H400 cells treated with IC50 concentration of DAM and NDAM for 12, 24 and 48 h using FITC-annexin V/PI double staining. Early and late apoptosis were examined on fluorescence 2 (FL2 for propidium iodide) versus fluorescence 1 (FL1 for Annexin) plots. Images are representative of three independent experiments. R3 damaged/dead cells, R4 late apoptotic/secondary necrotic cells, R5 viable cells and R6 early apoptotic cells. Statistically significant differences between control and treated cells were set at **P < 0.01
Elevation of caspase-3/7 and -9 activities by DAM and NDAM
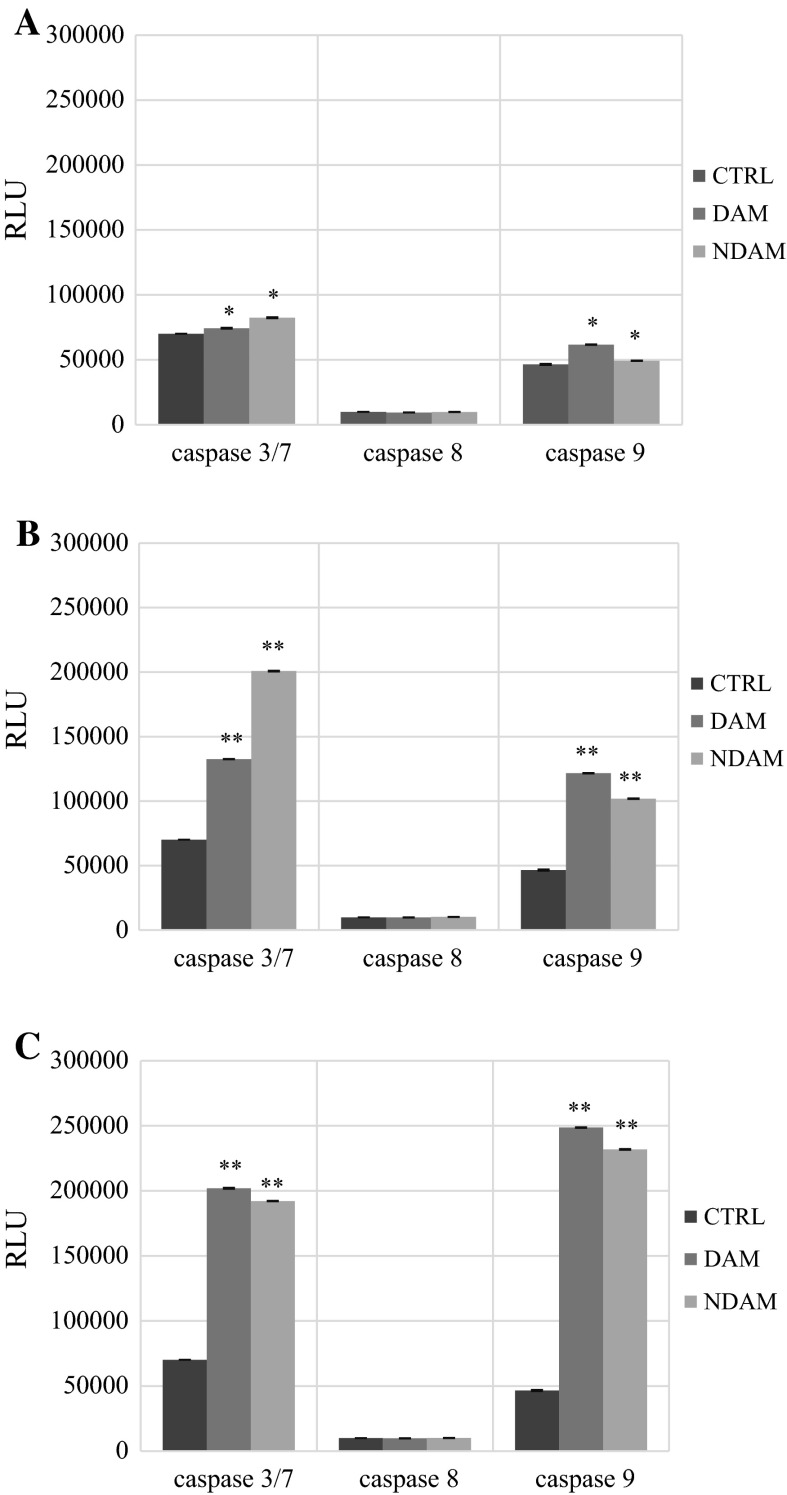
On a molecular level, apoptosis is intricately controlled via caspases (Nicholson 1999). In this assay the luminescent intensity of caspase-3/7, 8 and 9 activity was measured in DAM and NDAM-treated H400 OSCC cells with three different concentrations of compounds (IC25, IC50 and IC75) for 24 h. According to Table 3 and Fig. 4, there is a significant increase in the luminescent intensity of caspase-3/7 and 9 activities in DAM and NDAM-treated H400 cells at all concentrations compare to control. In addition, the luminescent intensity of caspase-3/7 and 9 increased dramatically from IC25 to IC75 value of compounds. Moreover, caspase-8 activity was not influenced in all concentration of DAM and NDAM. Therefore, these results suggest that DAM and NDAM induced apoptosis in H400 OSCC cells via the intrinsic (mitochondrial) pathway. Furthermore, treated cells with increasing concentrations of DAM and NDAM demonstrated that both compounds dose dependently induced caspase-3/7 and 9 activation compared to control.
Table 3.
Bioluminescent intensity of caspase-3/7, 8 and 9 activity in control cells and H400 OSCC cells treated with DAM and NDAM at three different concentrations for 24 h
| Caspase | DAM | NDAM | Control | ||||
|---|---|---|---|---|---|---|---|
| IC25 | IC50 | IC75 | IC25 | IC50 | IC75 | ||
| Caspase-3/7 | 7.4 × 10⁴ ± 2.9 × 10² | 1.3 × 10⁵ ± 1.1 × 10² | 2.0 × 10⁵ ± 3.5 × 10² | 8.2 × 10⁴ ± 3.5 × 10² | 2.0 × 10⁵ ± 3.4 × 10² | 1.9 × 10⁵ ± 1.7 × 10² | 7.0 × 10⁴ ± 6.7 |
| Caspase-8 | 9.5 × 10³ ± 3.2 × 10 | 9.9 × 10³ ± 7.5 × 10 | 9.8 × 10³ ± 5.6 × 10 | 9.8 × 10³ ± 6.4 × 10 | 1.0 × 10⁴ ± 4.6 × 10 | 1.0 × 10⁴ ± 3.6 × 10 | 9.9 × 10³ ± 5.8 |
| Caspase-9 | 6.2 × 10⁴ ± 2.3 × 10² | 1.2 × 10⁵ ± 2.1 × 10² | 2.5 × 10⁵ ± 2.4 × 10² | 4.9 × 10⁴ ± 7.8 × 10 | 1.0 × 10⁵ ± 2.7 × 10² | 2.3 × 10⁵ ± 2.7 × 10² | 4.7 × 10⁴ ± 4.5 × 10² |
Fig. 4.
Caspase-3/7, 8 and 9 activities in H400 cells treated with IC25, IC50 and IC75 concentrations of DAM and NDAM for 24 h. a Treatment with IC25 concentration; b treatment with IC50 concentration; c treatment with IC75 concentration. Data are presented as mean ± SEM from three individual experiments (n = 3). Statistically significant differences between control and treated cells were set at *P < 0.05, **P < 0.01. RLU Relative luminescence units
Disruption of mitochondrial membrane potential by DAM and NDAM
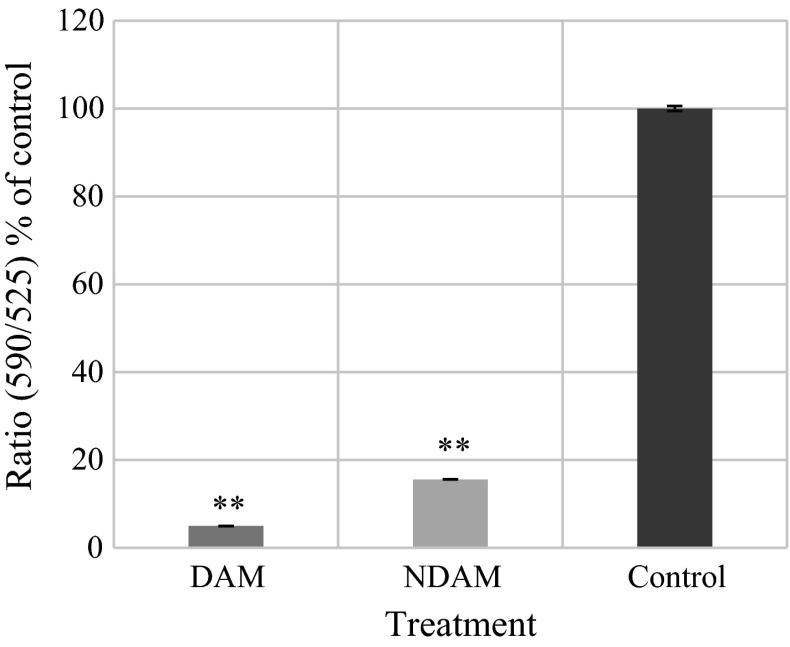
DAM and NDAM induced mitochondrial membrane potential changes in H400 OSCC cells that were measured using JC-10 dye. The dye selectively entered into mitochondrial matrix and switched the colour from red to green when ΔΨm was reduced. In live cells, JC-10 was accumulated in the mitochondrial matrix and produced red fluorescent aggregates while in apoptotic and necrotic cells, JC-10 diffused out of mitochondria and converted to monomeric form and stained the cells in green fluorescence. The fluorescent intensities for both aggregates and monomeric forms of JC-10 were monitored at specific wavelength are displayed in Table 4 and Fig. 5. H400 OSCC cells exhibited a significant reduction of fluorescence intensity [ratio (590/525) or red/green] after 24 h treatment with DAM and NDAM, which reflected the collapse associated with mitochondrial membrane potential. According to the histogram, the fluorescence intensity after 24 h treatment with DAM and NDAM were 4.96 and 15.59 % of the control, respectively.
Table 4.
The fluorescent intensities for both J-aggregates and monomeric forms of JC-10 at Ex/Em = 490/525 nm (green fluorescence) and 490/590 nm (red florescence) after 24 h treatment of H400 OSCC cells with DAM and NDAM
| Compounds | Red/green florescence (590/525) | Percentage of control |
|---|---|---|
| DAM | 0.58 ± 0.005 | 4.96 |
| NDAM | 1.82 ± 0.006 | 15.59 |
| Control | 11.72 ± 0.590 | 100 |
The values are presented as mean ± SEM from three individual experiments (n = 3)
Fig. 5.
Mitochondrial membrane potential disruption in H400 cells treated with IC50 concentration of DAM and NDAM for 24 h. Data are presented as mean ± SEM from three individual experiments (n = 3). Statistically significant differences between control and treated cells were set at *P < 0.05, **P < 0.01
Translocation of Cytochrome c from Mitochondria to the Cytosol
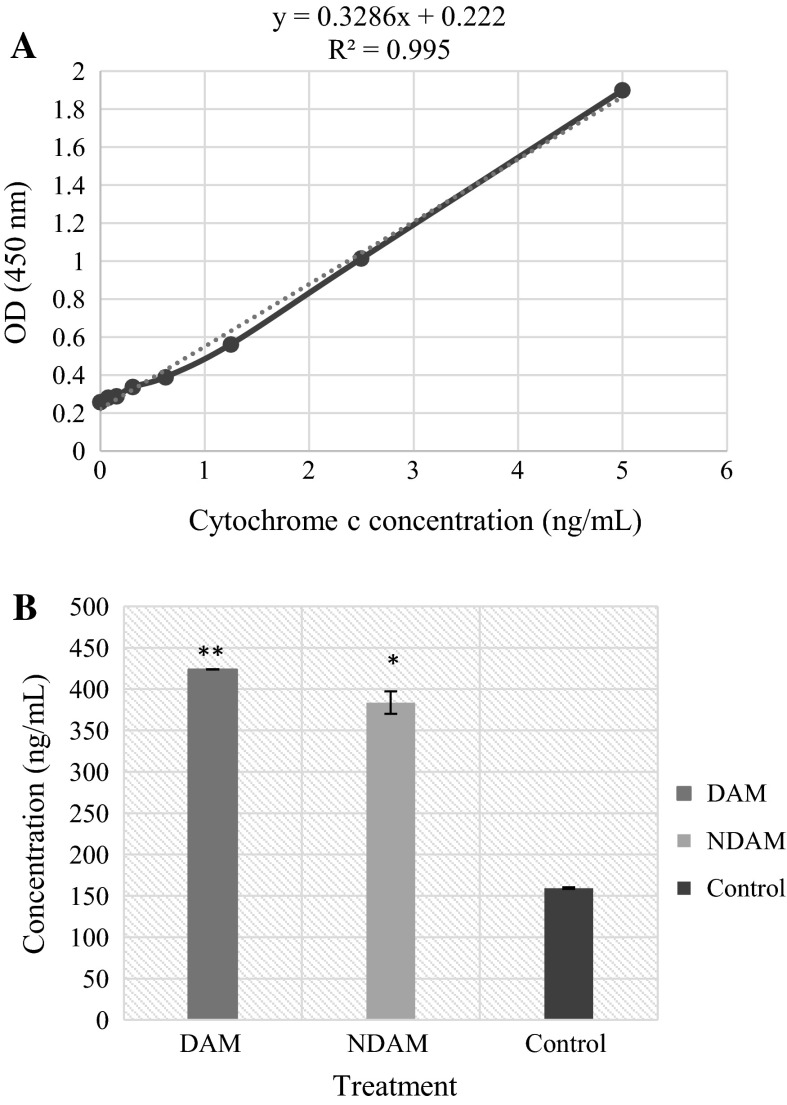
Cytochrome c is an essential mediator of programmed cell death through the intrinsic pathway. Apoptotic stimulus triggers the release of Cytochrome c from the mitochondria into the cytosol (Czerski and Nuñez 2004). In the present study, there was a significant increase in the concentration of Cytochrome c in DAM and NDAM-treated H400 OSCC cells compared to control. The concentration of Cytochrome c in the cytosol of the control cells and also the cells treated with DAM and NDAM was 159.40, 423.79 and 383.57 ng/mL, respectively (Tables 5, 6; Fig. 6). The concentration of Cytochrome c in the cells treated with DAM and NDAM was more than two times higher than for the control cells. These results propose that the treatment of H400 OSCC cells with DAM and NDAM triggered the translocation of Cytochrome c from mitochondria into the cytosol.
Table 5.
The following data were obtained from standard, in duplicate, over the range of 0–5 ng/mL of Cytochrome c
| Concentration of Cytochrome c standard (ng/mL) | OD for standard 1 (nm) | OD for standard 2 (nm) | Average OD (nm) |
|---|---|---|---|
| 5 | 1.864 | 1.9356 | 1.8998 |
| 2.5 | 1.0343 | 0.9942 | 1.01425 |
| 1.25 | 0.5594 | 0.5659 | 0.56265 |
| 0.625 | 0.3851 | 0.3957 | 0.3904 |
| 0.312 | 0.3566 | 0.3195 | 0.33805 |
| 0.156 | 0.2873 | 0.2927 | 0.2900 |
| 0.078 | 0.2810 | 0.2836 | 0.2823 |
| 0 | 0.2568 | 0.2599 | 0.25835 |
A standard curve was developed to determine the protein concentration in the samples
Table 6.
Concentration of Cytochrome c in control cells and H400 OSCC cells treated with IC50 value of DAM and NDAM for 24 h
| Compounds | Concentration of Cytochrome c (ng/mL) |
|---|---|
| DAM | 423.79 ± 0.19 |
| NDAM | 383.57 ± 13.59 |
| Control | 159.40 ± 0.95 |
Fig. 6.
a Standard curve associated with Cytochrome c concentration in the samples. Natural Cytochrome c from cell lysate was serially diluted (0–5 ng/mL) in Standard Diluent Buffer. The optical density (OD) of each dilution was plotted against the Cytochrome c standard curve. Parallelism of Cytochrome c demonstrated by the figure, showed that the standard precisely reflected Cytochrome c content in the samples. Linear regression analysis provided a correlation coefficient of 0.995. b Quantitative detection of Cytochrome c in cell lysates of H400 OSCC cells treated with IC50 concentration of DAM and NDAM for 24 h. Cytochrome c levels were examined in duplicate using ELISA kit. Data are shown as mean ± SEM of two independent experiments. Significant difference from the control was at *P < 0.05, **P < 0.01
Cell cycle analysis
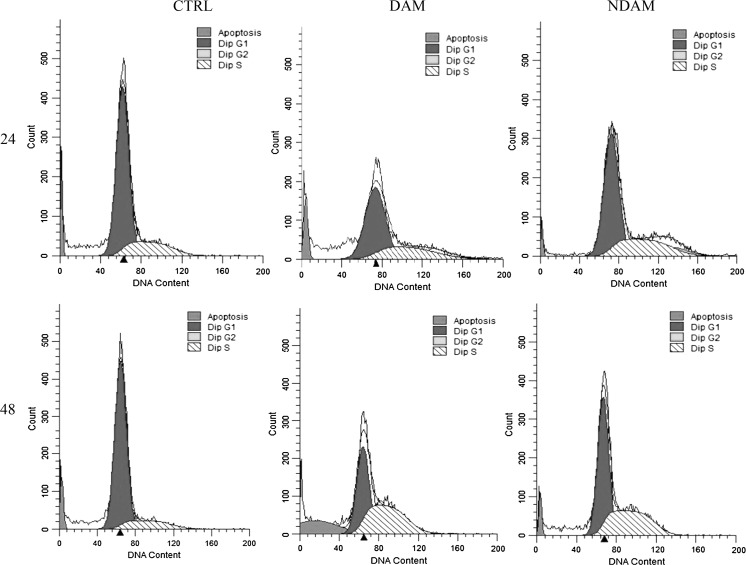
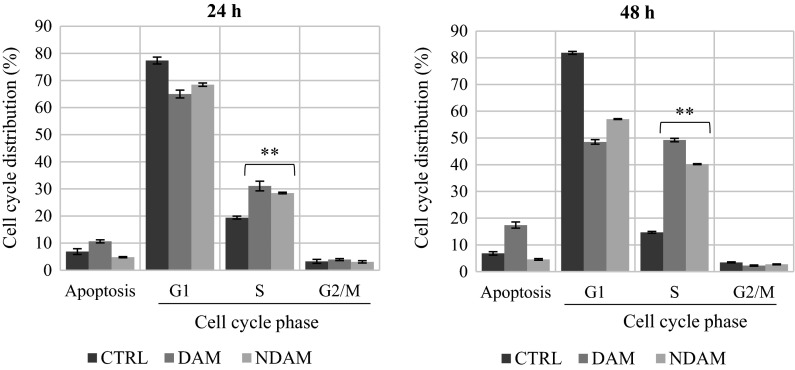
The cell cycle is essential for cell growth and cell division. According to Fig. 7, DAM and NDAM-treated H400 OSCC cells demonstrated a dramatic accumulation of the cells in S-phase after 24 and 48 h treatment. The number of cells in S-phase of DAM and NDAM-treated cells after 24 h was 31.07 and 28.48 %, respectively, compared to the control cells (19.40 %). A significant increase was also observed from 14.70 (control) to 49.23 and 40.22 % in S-phases of DAM and NDAM-treated cells for 48 h, respectively (Table 7; Figs. 7, 8). In addition, the treated cells showed higher accumulation in S-phase after 48 h compare to 24 h. Induction of apoptosis by DAM and NDAM was confirmed by the existence of a substantial number of cells in sub-G1 population. Therefore, these results suggest that both DAM and NDAM induced S-phase cell cycle arrest in a time-dependent manner.
Fig. 7.
Flow cytometric analysis of cell cycle in H400 cells treated with IC50 concentration of DAM and NDAM for 24 and 48 h. Images are representative of three independent experiments. The x and y axes represent DNA content and cell number respectively
Table 7.
The percentage of cell cycle phase distribution in control cells and H400 OSCC cells treated with IC50 concentration of DAM and NDAM for 24 and 48 h
| Time (hour) | Treatment | Cell cycle phases | Apoptosis (%) | ||
|---|---|---|---|---|---|
| G1 (%) | S (%) | G2/M (%) | |||
| 24 | CTRL | 77.36 ± 1.25 | 19.40 ± 0.53 | 3.23 ± 0.73 | 6.86 ± 1.08 |
| DAM | 65.01 ± 1.45 | 31.07 ± 1.78 | 3.92 ± 0.36 | 10.66 ± 0.57 | |
| NDAM | 68.45 ± 0.62 | 28.48 ± 0.28 | 3.07 ± 0.42 | 4.79 ± 0.21 | |
| 48 | CTRL | 81.86 ± 0.54 | 14.70 ± 0.35 | 3.44 ± 0.19 | 6.83 ± 0.64 |
| DAM | 48.52 ± 0.83 | 49.23 ± 0.62 | 2.25 ± 0.20 | 17.41 ± 1.14 | |
| NDAM | 57.06 ± 0.14 | 40.22 ± 0.16 | 2.72 ± 0.15 | 4.57 ± 0.32 | |
Fig. 8.
The effect of DAM and NDAM on cell cycle phase distribution of H400 cells after 24 and 48 h treatment. The values are expressed as mean ± SEM from three independent experiments. Significant difference from the control was at *P < 0.05, **P < 0.01
Discussion
Damnacanthal or 3-hydroxy-1-methoxyanthraquinone-2-carboxaldehyde (C16H10O5) and nordamnacanthal or 2-formyl-1, 3-dihydroxyanthraquinone (C15H8O5), as derivatives of anthraquinones, are mostly generated by plants of Morinda species (Alitheen et al. 2010). DAM and NDAM have been known to possess various health advantages (Alitheen et al. 2010). There is little knowledge of the effectiveness of noni and its anthraquinones in cancer therapy, particularly regarding the effect of DAM and NDAM on various cancer cells. Hence, we studied the mechanism of apoptosis induction in OSCC cells in response to DAM and NDAM in vitro.
Apoptosis is one of the most important objectives for cancer therapy including chemotherapy and chemoprevention (Czerski and Nuñez 2004). Apoptosis is characterized by particular morphological as well as biochemical alterations, which include cell shrinkage, nuclear condensation and fragmentation, plasma membrane blebbing, formation of apoptotic bodies in addition to loss of cell contacts to neighbor cells (Nishida et al. 2008). Biochemical changes consist of chromosomal DNA cleavage into internucleosomal fragments, externalization of phosphatidylserine and the cleavage of some intracellular substrates by specific proteolysis (Ali et al. 2011). In the present study, cytotoxic potential of DAM and NDAM on oral squamous cell carcinoma cell lines were evaluated by MTT assay. DAM and NDAM demonstrated significant cytotoxic effect against all OSCC cell lines except H314 and no significant cytotoxicity was observed against the normal cell line (3T3). Purified compounds with <10 μg/mL of cytotoxicity concentration are considered as promising cancer chemotherapy agents (Shier 1991). This cytotoxicity is attributed to the chemical structure of DAM and NDAM, as shown by Ali et al. (2000) where the chemical structure between these compounds is tightly associated and the presence of the hydroxyl group at C-1 and C-3 and/or a formyl group at C-2 in the anthraquinones structure might be responsible for their cytotoxicity effects against several cancer cell lines. The selective cytotoxic effect of DAM and NDAM was supported by several previous studies. Lin et al. (2011) claimed the selective cytotoxic effect of DAM for human liver adenocarcinoma SKHep 1 cells. Alitheen et al. (2010) also reported the selective cytotoxic effects of DAM and NDAM against leukaemia cell lines. The selective cytotoxic effect associated with DAM and NDAM is important, because currently available anticancer medicines target both normal and cancer cells, leading to severe side effects. Therefore, these findings invite additional analysis on the apoptotic effects of these compounds and their potency as anticancer drugs for OSCC cells therapy. In this study, a significant difference on the cytotoxic effect of DAM and NDAM compounds against the OSCC cell lines was observed. The difference in the cytotoxicity of these compounds is in line with the study as reported by Alitheen et al. (2010). They claimed that it may be due to the presence of methoxyl group (–OCH3) of DAM at position C-1 whilst NDAM possesses hydroxyl group (–OH) at the same position. Additionally, the number and position of hydroxyl groups in the structure of DAM and NDAM might significantly affect the corresponding activities (Alitheen et al. 2010; Kamei et al. 1998; Konoshima et al. 1989). Therefore, the exclusive chemical and biological properties of DAM and NDAM were regarded as significant factor associated with their respective cytotoxicity activities (Alitheen et al. 2010).
In this study, two different assays were executed to prove the mode of cell death induced by DAM and NDAM against H400 OSCC cells; DNA fragmentation and FITC-annexin V/PI flow cytometry. Creation of DNA ladder has been broadly used as a unique indicator of programmed cell death (Krithika et al. 2009). Various caspase substrates are associated in the regulation of DNA structure, repair as well as replication. An essential feature associated with programmed cell death is the fragmentation of genomic DNA by cellular endonucleases into integer multiples of 180–200 bp units creating a ladder-like pattern on agarose gel electrophoresis (Alabsi et al. 2012). In the present study, the standard ladder-like pattern of nuclear DNA was observed in DAM and NDAM-treated H400 OSCC cells, which supports the apoptosis-inducing capacity of these compounds. DNA fragmentation is regarded as a biochemical hallmark associated with apoptosis. The cleavage of genomic DNA at the internucleosomal region via cellular endonucleases results in DNA fragments with integer multiples of 180–200 base pairs units, which creates a ladder-like pattern when analysed on conventional agarose gel electrophoresis. This type of DNA fragmentation is as a result of CAD (caspase-activated DNase) release from the mitochondria and the translocation to the nucleus following the cleavage by caspase-3. Other types of DNA fragmentation which are carried out by AIF (Apoptosis-inducing factor) (creation of ~50–300 kb pieces DNA fragments) and endonuclease G operate independently of the caspase. In the current study, the standard ladder-like pattern of nuclear DNA with integer multiples of 180–200 base pairs units (360, 540, 720 and 900 bp) was observed in DAM and NDAM-treated HNSCC cells (especially in the cells treated with IC50 and IC75 concentrations after 72 h incubation), all of which supports the apoptosis-inducing capacity of the theses compounds while no fragmentation or smearing pattern was observed in control cells (Wyllie 1980; Zhang and Xu 2002). FITC-annexin V is commonly used in conjugation with propidium iodide to determine early apoptotic cells prior the loss of cell membrane integrity (Aubry et al. 1999). Translocation of phosphatidylserine (PS) from the inner to the outer leaflet of the plasma membrane or externalization of PS to the cell surface occurs in the apoptotic cells (Alabsi et al. 2012). In this study, flow cytometric study of apoptosis by FITC-annexin V/PI demonstrated that DAM and NDAM induced apoptosis in H400 OSCC cells through the observation of shift in live cell population from early to late stage of apoptosis from 12 to 48 h.
In addition, three types of assays were performed to confirm the molecular mechanism of apoptosis induced by DAM and NDAM against H400 OSCC cells which included mitochondrial membrane potential, Cytochrome c, and caspases activities. An involvement of mitochondria in the mechanisms of DAM and NDAM cytotoxicity was demonstrated from the ratio of red fluorescence of JC-10 aggregates and green fluorescence of JC-10 monomers. The aggregation of monomers is directly related to mitochondrial membrane potential, ΔΨm, and its disruption in dying cells leads to increase of green fluorescence (Jakubikova et al. 2005). Treatment of H400 OSCC cells with IC50 concentration of DAM and NDAM for 24 h revealed a dramatic reduction of red/green fluorescence intensity ratio. There are two major pathways in apoptosis and have been defined as extrinsic (death receptor) pathway and intrinsic (mitochondrial) pathway. The mitochondrial pathway relies on the release of Cytochrome c from mitochondria into the cytosol. Lots of researches have proposed that the release of mitochondrial Cytochrome c is an important process in caspase activation and apoptotic processes. Depletion of ΔΨm leads to the opening of the mitochondria permeability transition pores, which triggers the release of Cytochrome c and apoptosis-inducing factors into the cytosol and induce apoptotic cell death. The Bcl-2 family is crucial to retaining mitochondrial integrity and it consists of pro- and anti-apoptotic molecules (Antonsson and Martinou 2000). Induction of programmed cell death is almost linked to the activation of caspases (Nhan et al. 2006). Upon release of Cytochrome c to the cytosol and induction of apoptosis by the various apoptosis-inducing agents, creation of apoptosome complex consisting of Cytochrome c, Apaf-1, deoxyadenosine triphosphate (dATP), in addition to procaspase-9 is facilitated. Ultimately it leads to the activation of caspase-9. Cleaved or active form of caspase-9 cleaves effector caspases including caspase-3, -6, and also -7 (Wang et al. 2005). The current study demonstrated that DAM and NDAM-treated H400 OSCC cells exhibited an increase in the activity of Cytochrome c, caspase-9 and also caspase-3/7.
Cancers have been generally known as cell cycle disorder and this is because of deregulation of the cell cycle machinery during cancer initiation and development. Suppression of the cell cycle is a desirable target for cancer therapy with cytotoxic agents (Schwartz and Shah 2005). The cell cycle is organised through a number of checkpoints scanning genomic integrity as well as confirming that DNA replication continues in a coordinated fashion (Machida et al. 2005). After inducing cell cycle arrest, checkpoint signalling may also lead to activation of pathways resulting in apoptosis if cellular damage cannot be appropriately fixed (Pietenpol and Stewart 2002). In this study the cell cycle phase distribution analysis showed that DAM and NDAM hampered the cell cycle progression by arresting the H400 OSCC cells in the S phase.
Conclusion
In conclusion, DAM and NDAM induced a selective cytotoxic effect against H400 OSCC cell lines. In addition, the mechanistic studies suggested that DAM and NDAM compounds caused irreparable DNA damage, leading to cell cycle arrest and cell death through an intrinsic apoptotic pathway in OSCC cells. Therefore, it appears likely that both DAM and NDAM possess great potential to be developed as new cancer chemotherapy agents for oral cancer therapy.
Acknowledgments
This study was financially supported by UMRG Grant (RP002D-13HTM) from University of Malaya, Malaysia.
References
- Alabsi AM, Ali R, Ali AM, Al-Dubai SAR, Harun H, Abu Kasim NH, Alsalahi A. Apoptosis induction, cell cycle arrest and in vitro anticancer activity of gonothalamin in a cancer cell lines. Asian Pac J Cancer Prev. 2012;13:5131–5136. doi: 10.7314/APJCP.2012.13.10.5131. [DOI] [PubMed] [Google Scholar]
- Ali A, Ismail N, Mackeen M, Yazan L, Mohamed S, Ho A, Lajis N. Antiviral, cyototoxic and antimicrobial activities of anthraquinones isolated from the roots of Morinda elliptica. Pharm Biol. 2000;38:298–301. doi: 10.1076/1388-0209(200009)38:4;1-A;FT298. [DOI] [PubMed] [Google Scholar]
- Ali R, Alabsi AM, Ali AM, Ideris A, Omar R, Yusoff K, Ali RS. Cytolytic effects and apoptosis induction of Newcastle disease virus strain AF2240 on anaplastic astrocytoma brain tumor cell line. Neurochem Res. 2011;36:2051–2062. doi: 10.1007/s11064-011-0529-8. [DOI] [PubMed] [Google Scholar]
- Alitheen N, Mashitoh A, Yeap S, Shuhaimi M, Manaf AA, Nordin L. Cytotoxic effect of damnacanthal, nordamnacanthal, zerumbone and betulinic acid isolated from Malaysian plant sources. Int Food Res J. 2010;17:711–719. [Google Scholar]
- Antonsson B, Martinou J-C. The Bcl-2 protein family. Exp Cell Res. 2000;256:50–57. doi: 10.1006/excr.2000.4839. [DOI] [PubMed] [Google Scholar]
- Aubry JP, Blaecke A, Lecoanet-Henchoz S, Jeannin P, Herbault N, Caron G, Moine V, Bonnefoy JY. Annexin V used for measuring apoptosis in the early events of cellular cytotoxicity. Cytometry. 1999;37:197–204. doi: 10.1002/(SICI)1097-0320(19991101)37:3<197::AID-CYTO6>3.0.CO;2-L. [DOI] [PubMed] [Google Scholar]
- Balaram P, Sridhar H, Rajkumar T, Vaccarella S, Herrero R, Nandakumar A, Ravichandran K, Ramdas K, Sankaranarayanan R, Gajalakshmi V, Muñoz N, Franceschi S. Oral cancer in southern India: the influence of smoking, drinking, paan-chewing and oral hygiene. Int J Cancer. 2002;98:440–445. doi: 10.1002/ijc.10200. [DOI] [PubMed] [Google Scholar]
- Czerski L, Nuñez G. Apoptosome formation and caspase activation: is it different in the heart? J Mol Cell Cardiol. 2004;37:643–652. doi: 10.1016/j.yjmcc.2004.04.016. [DOI] [PubMed] [Google Scholar]
- Elmore S. Apoptosis: a review of programmed cell death. Toxicol Pathol. 2007;35:495–516. doi: 10.1080/01926230701320337. [DOI] [PMC free article] [PubMed] [Google Scholar]
- Ferlay J, Soerjomataram I, Ervik M, Dikshit R, Eser S, Mathers C, Rebelo M, Parkin DM, Forman D, Bray F (2014) Globocan 2012, Cancer incidence and mortality worldwide. International Agency for Research on Cancer, Lyon. http://globocan.iarc.fr [DOI] [PubMed]
- Ghani WM, Razak IA, Yang Y-H, Talib NA, Ikeda N, Axell T, Gupta PC, Handa Y, Abdullah N, Zain RB. Factors affecting commencement and cessation of betel quid chewing behaviour in Malaysian adults. BMC Public Health. 2011;11:82. doi: 10.1186/1471-2458-11-82. [DOI] [PMC free article] [PubMed] [Google Scholar]
- Gordaliza M. Natural products as leads to anticancer drugs. Clin Transl Oncol. 2007;9:767–776. doi: 10.1007/s12094-007-0138-9. [DOI] [PubMed] [Google Scholar]
- Haghiac M, Walle T. Quercetin induces necrosis and apoptosis in SCC-9 oral cancer cells. Nutr Cancer. 2005;53:220–231. doi: 10.1207/s15327914nc5302_11. [DOI] [PubMed] [Google Scholar]
- Hiramatsu T, Imoto M, Koyano T, Umezawa K. Induction of normal phenotypes in ras-transformed cells by damnacanthal from Morinda citrifolia. Cancer Lett. 1993;73:161–166. doi: 10.1016/0304-3835(93)90259-C. [DOI] [PubMed] [Google Scholar]
- Ismail NH, Ali AM, Aimi N, Kitajima M, Takayama H, Lajis NH. Anthraquinones from Morinda citrifolia. Phytochemistry. 1997;14:1723–1725. doi: 10.1016/S0031-9422(97)00252-5. [DOI] [Google Scholar]
- Jakubikova J, Bao Y, Sedlak J. Isothiocyanates induce cell cycle arrest, apoptosis and mitochondrial potential depolarization in HL-60 and multidrug-resistant cell lines. Anticancer Res. 2005;25:3375–3386. [PubMed] [Google Scholar]
- Jasril LN, Mooi LY, Abdullah MA, Sukari MA, Ali AM. Antitumor promoting and antioxidant activities of anthraquinones isolated from the cell suspension culture of Morinda elliptica. Asia Pac J Mol Biol Biotechnol. 2003;11:3–7. [Google Scholar]
- Johnson NW, Warnakulasuriya S, Gupta P, Dimba E, Chindia M, Otoh EC, Sankaranarayanan R, Califano J, Kowalski L. Global oral health inequalities in incidence and outcomes for oral cancer causes and solutions. Adv Dent Res. 2011;23:237–246. doi: 10.1177/0022034511402082. [DOI] [PubMed] [Google Scholar]
- Kamei H, Koide T, Kojima T, Hashimoto Y, Hasegawa M. Inhibition of cell growth in culture by quinones. Cancer Biother Radiopharm. 1998;13:185–188. doi: 10.1089/cbr.1998.13.185. [DOI] [PubMed] [Google Scholar]
- Kanokmedhakul K, Kanokmedhakul S, Phatchana R. Biological activity of Anthraquinones and Triterpenoids from Prismatomeris fragrans. J Ethnopharmacol. 2005;100:284–288. doi: 10.1016/j.jep.2005.03.018. [DOI] [PubMed] [Google Scholar]
- Konoshima T, Kozuka M, Koyama J, Tagahara T, Okatani T, Tagahara K, Tokud AH. Studies on inhibitors of skin tumor promotion, VI. Inhibitory effects of quinones on Epsterin-Barr virus activation. J Nat Prod. 1989;52:987–995. doi: 10.1021/np50065a012. [DOI] [PubMed] [Google Scholar]
- Krithika R, Mohankumar R, Verma RJ, Shrivastav PS, Mohamad IL, Gunasekaran P, Narasimhan S. Isolation, characterization and antioxidative effect of phyllanthin against CCl4-induced toxicity in HepG2 cell line. Chem Biol Interact. 2009;181:351–358. doi: 10.1016/j.cbi.2009.06.014. [DOI] [PubMed] [Google Scholar]
- Kumar B, Kumar A, Pandey B, Mishra K, Hazra B. Role of mitochondrial oxidative stress in the apoptosis induced by diospyrin diethylether in human breast carcinoma (MCF-7) cells. Mol Cell Biochem. 2009;320:185–195. doi: 10.1007/s11010-008-9920-4. [DOI] [PubMed] [Google Scholar]
- Lin F-L, Hsu J-L, Chou CH, Wu WJ, Chang CI, Liu HJ. Activation of p38 MAPK by damnacanthal mediates apoptosis in SKHep 1 cells through the DR5/TRAIL and TNFR1/TNF-α and p53 pathways. Eur J Pharmacol. 2011;650:120–129. doi: 10.1016/j.ejphar.2010.10.005. [DOI] [PubMed] [Google Scholar]
- Machida YJ, Hamlin JL, Dutta A. Right place, right time, and only once: replication initiation in metazoans. Cell. 2005;123:13–24. doi: 10.1016/j.cell.2005.09.019. [DOI] [PubMed] [Google Scholar]
- Neville BW, Day TA. Oral cancer and precancerous lesions. CA: A Cancer J Clin. 2002;52:195–215. doi: 10.3322/canjclin.52.4.195. [DOI] [PubMed] [Google Scholar]
- Nhan TQ, Liles WC, Schwartz SM. Physiological functions of caspases beyond cell death. Am J Pathol. 2006;169:729–737. doi: 10.2353/ajpath.2006.060105. [DOI] [PMC free article] [PubMed] [Google Scholar]
- Nicholson D. Caspase structure, proteolytic substrates, and function during apoptotic cell death. Cell Death Differ. 1999;6:1028–1042. doi: 10.1038/sj.cdd.4400598. [DOI] [PubMed] [Google Scholar]
- Nishida K, Yamaguchi O, Otsu K. Crosstalk between autophagy and apoptosis in heart disease. Circ Res. 2008;103:343–351. doi: 10.1161/CIRCRESAHA.108.175448. [DOI] [PubMed] [Google Scholar]
- Pavia M, Pileggi C, Nobile CG, Angelillo IF. Association between fruit and vegetable consumption and oral cancer: a meta-analysis of observational studies. Am J Clin Nutr. 2006;83:1126–1134. doi: 10.1093/ajcn/83.5.1126. [DOI] [PubMed] [Google Scholar]
- Pietenpol J, Stewart Z. Cell cycle checkpoint signalling: cell cycle arrest versus apoptosis. Toxicology. 2002;181:475–481. doi: 10.1016/S0300-483X(02)00460-2. [DOI] [PubMed] [Google Scholar]
- Sato D, Kondo S, Yazawa K, Mukudai Y, Li C, Kamatani T, Katsuta H, Yoshihama Y, Shirota T, Shintani S. The potential anticancer activity of extracts derived from the roots of Scutellaria baicalensis on human oral squamous cell carcinoma cells. Mol Clin Oncol. 2013;1:105–111. doi: 10.3892/mco.2012.14. [DOI] [PMC free article] [PubMed] [Google Scholar]
- Schwartz GK, Shah MA. Targeting the cell cycle: a new approach to cancer therapy. J Clin Oncol. 2005;23:9408–9421. doi: 10.1200/JCO.2005.01.5594. [DOI] [PubMed] [Google Scholar]
- Shier WT. Mammalian cell culture on $5 a day: a laboratory manual of low cost methods. Los Banos Univ Philipp. 1991;64:9–16. [Google Scholar]
- Stewart B, Kleihues P. Head and neck cancer. World cancer report. Lyon: International Agency for Research on Cancer; 2003. [Google Scholar]
- Torre LA, Bray F, Siegel RL, Ferlay J, Ward E, Forman D. Global cancer statistics, 2002. CA: A Cancer J Clin. 2015;65:87–108. doi: 10.3322/caac.21262. [DOI] [PubMed] [Google Scholar]
- Wang Z-B, Liu Y-Q, Cui Y-F. Pathways to caspase activation. Cell Biol Int. 2005;29:489–496. doi: 10.1016/j.cellbi.2005.04.001. [DOI] [PubMed] [Google Scholar]
- Wyllie AH. Glucocorticoid-induced thymocyte apoptosis is associated with endogenous endonuclease activation. Nature. 1980;284:555–556. doi: 10.1038/284555a0. [DOI] [PubMed] [Google Scholar]
- Zhang J, Xu M. Apoptotic DNA fragmentation and tissue homeostasis. Trends Cell Biol. 2002;12:84–89. doi: 10.1016/S0962-8924(01)02206-1. [DOI] [PubMed] [Google Scholar]


