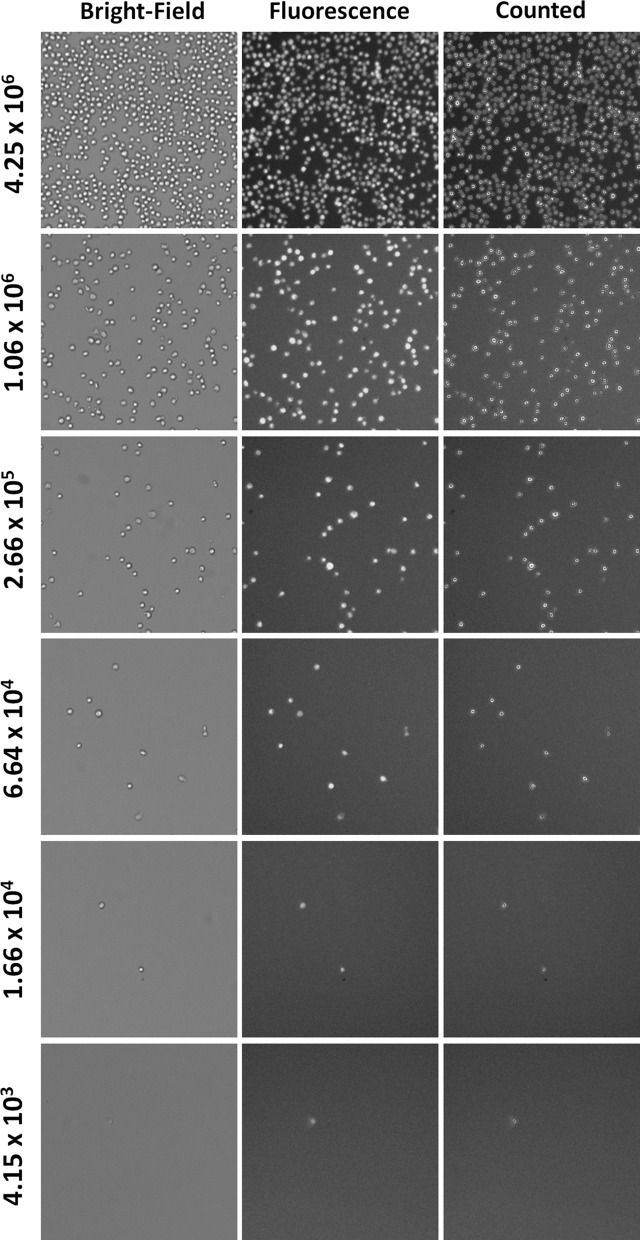
Fig. 4.
Bright-field and fluorescent images of AO stained Jurkat cells at different concentrations. Serial dilutions of Jurkat cells were stained with AO to generate concentration linearity plot. The images showed decreasing cell numbers as the concentration decreased. In addition, the purple outline of the Jurkat cells indicated that these cells were counted by the software. Even at very low concentration when only a few cells were present, the Celigo software was able to count each AO or PI positive cell. (Color figure online)

