

Abstract
Key points
Mitochondrial‐derived vesicle (MDV) formation occurs under baseline conditions and is rapidly upregulated in response to stress‐inducing conditions in H9c2 cardiac myoblasts.
In mice formation of MDVs occurs readily in the heart under normal healthy conditions while mitophagy is comparatively less prevalent.
In response to acute stress induced by doxorubicin, mitochondrial dysfunction develops in the heart, triggering MDV formation and mitophagy.
MDV formation is thus active in the cardiac system, where it probably constitutes a baseline housekeeping mechanism and a first line of defence against stress.
Abstract
The formation of mitochondrial‐derived vesicles (MDVs), a process inherited from bacteria, has emerged as a potentially important mitochondrial quality control (QC) mechanism to selectively deliver damaged material to lysosomes for degradation. However, the existence of this mechanism in various cell types, and its physiological relevance, remains unknown. Our aim was to investigate the dynamics of MDV formation in the cardiac system in vitro and in vivo. Immunofluorescence in cell culture, quantitative transmission electron microscopy and electron tomography in vivo were used to study MDV production in the cardiac system. We show that in cardiac cells MDV production occurs at baseline, is commensurate with the dependence of cells on oxidative metabolism, is more frequent than mitophagy and is up‐regulated on the time scale of minutes to hours in response to prototypical mitochondrial stressors (antimycin‐A, xanthine/xanthine oxidase). We further show that MDV production is up‐regulated together with mitophagy in response to doxorubicin‐induced mitochondrial and cardiac dysfunction. Here we provide the first quantitative data demonstrating that MDV formation is a mitochondrial QC operating in the heart.
Keywords: heart, mitochondrial‐derived vesicles, mitochondrial quality control, mitophagy
Key points
Mitochondrial‐derived vesicle (MDV) formation occurs under baseline conditions and is rapidly upregulated in response to stress‐inducing conditions in H9c2 cardiac myoblasts.
In mice formation of MDVs occurs readily in the heart under normal healthy conditions while mitophagy is comparatively less prevalent.
In response to acute stress induced by doxorubicin, mitochondrial dysfunction develops in the heart, triggering MDV formation and mitophagy.
MDV formation is thus active in the cardiac system, where it probably constitutes a baseline housekeeping mechanism and a first line of defence against stress.
Abbreviations
- CRC
calcium retention capacity
- Doxo
doxorubicin
- FBS
fetal bovine serum
- MDV
mitochondrial‐derived vesicle
- OCR
oxygen consumption rate
- OMM
outer mitochondrial membrane
- PDH
pyruvate dehydrogenase
- PINK1
PTEN‐induced putative kinase 1
- QC
quality control
- TEM
transmission electron microscopy
- TOM20
translocase of the outer membrane
- X/XO
xanthine/xanthine oxidase
Introduction
Eukaryotic cells have evolved sophisticated quality control (QC) mechanisms that ensure repair or replacement of damaged macromolecules and organelles. At the level of mitochondria, the sustained biochemical activity essential for cell function inevitably induces a wear and tear of structural and metabolic components. Mitochondrial QC mechanisms include the cytosolic ubiquitin–proteasome system, which degrades mitochondrial proteins at the surface of the outer membrane, as well as chaperones and proteases that ensure degradation of damaged intra‐mitochondrial proteins (for reviews see Kim et al. 2007; McBride & Scorrano, 2013; Lemasters, 2014). In addition, whole mitochondria that have accumulated excessive damage can be degraded through mitophagy, a process in which damaged organelles are specifically sequestered in double‐membrane autophagosomes and delivered to lysosomes for degradation (Gottlieb & Carreira, 2010). Clearance of whole mitochondria through this process occurs on the scale of hours to days following a mitochondrial insult, and is regulated by multiple mechanisms including the PINK1/PARKIN and NIX/BNIP3 pathways, as well as cardiolipin‐mediated mitophagy (Saito & Sadoshima, 2015).
In organs such as the heart, which has large mitochondrial biomass and nearly exclusive dependence on oxidative phosphorylation for energy supply (Stanley et al. 2005), mitophagy is suggested to play an important role in mounting an adequate response to stress (Gottlieb & Carreira, 2010; Delbridge et al. 2015). This view is supported by the observation that autophagy and mitophagy are upregulated in the heart following ischaemia–reperfusion (I‐R) and sepsis, and by studies in mouse models showing that genetic inactivation of PARKIN attenuates stress‐induced mitophagy, resulting in impaired recovery of mitochondrial and cardiac function (Kanamori et al. 2011 a,b; Hoshino et al. 2012; Piquereau et al. 2013). However, uncertainty exists regarding the precise role of mitophagy on baseline mitochondrial housekeeping, in part because germline and inducible cardiac‐specific deletion of PARKIN causes little (Piquereau et al. 2013) or no (Kubli et al. 2013; Song et al. 2015) mitochondrial dysfunction, and no detectable pathological phenotype at baseline.
In addition to mitophagy, recent studies in cellular models have uncovered a novel mitochondrial QC pathway, conserved from bacteria, in which mitochondria release small, mitochondrial‐derived vesicles (MDVs) from their membranes to deliver specific mitochondrial contents to the late endosome/multivesicular bodies (Soubannier et al. 2012). MDVs are defined by at least three distinct criteria: independence on the core fission GTPase Drp1, the incorporation of selected mitochondrial cargo, and a diameter of 70–150 nm as observed by electron microscopy. In vitro budding assays using bovine heart mitochondria have shown that MDVs are enriched with oxidized cargo, consistent with their role in maintaining mitochondrial health. While the mechanisms of cargo incorporation are unclear, evidence suggests vesicles can form exclusively from the outer membrane, or can be derived from both outer and inner membranes, carrying selected matrix content as well (Neuspiel et al. 2008; Soubannier et al. 2012 a,b; McLelland et al. 2014; Sugiura et al. 2014). In vitro production of these populations of MDVs occurs not only under baseline conditions, but also rapidly (minutes to hours) in response to mitochondrial stress (McLelland et al. 2014). Moreover, MDVs form prior to mitochondrial depolarization (Soubannier et al. 2012 a,b), suggesting that MDV formation represents an essential housekeeping mechanism and a first line of defence against mitochondrial stress. Interestingly, formation and transport of some double membrane MDVs enriched with matrix cargos was recently shown to require PINK1/PARKIN, indicating some level of interaction between MDV formation and mitophagy (McLelland et al. 2014).
Although the data gathered thus far suggest that MDV production is a potentially important mitochondrial QC mechanism, further studies are required to establish its physiological implication in various cell types and, most importantly, in intact organs in vivo. In the present study we used a combination of in vitro experiments in cardiac cells and quantitative morphological electron microscopy in vivo to test the hypothesis that MDV production is a physiological mechanism in the heart. We reveal for the first time that MDV production occurs in cardiac cells under normal baseline conditions, and can be up‐regulated in response to relevant physiopathological stresses. These results have important implications for our understanding of mitochondrial QC in mammalian organs.
Methods
Ethical approval
All animal experiments were approved by the Université de Montréal animal ethics committee and performed in accordance with the guidelines of the Canadian Council of Animal Care.
Cell culture
H9c2 (2‐1) myoblasts were purchased from ATCC (Manassas, VA, USA). Cells were initially cultured in high glucose DMEM (319‐020‐CL; Wisent Inc., Saint‐Jean‐Baptiste, QC, Canada) supplemented with sodium pyruvate (1 mmol l–1, 600‐110‐EL; Wisent), penicillin/streptomycin (450‐201‐EL; Wisent) and 10% fetal bovine serum (FBS, 37°C, 5% CO2). To force cultured cells to rely on mitochondrial oxidative phosphorylation, glucose was replaced with galactose as the major energy substrate. For this, cells were cultured in glucose‐free DMEM (319‐060‐CL; Wisent), supplemented with galactose (10 mmol l−1), sodium pyruvate (1 mmol l−1, 600‐110‐EL; Wisent), HEPES (10 mmol l−1, 330‐050‐EL; Wisent), 1× penicillin/streptomycin (100 IU/100 μg ml−1, 450‐201‐EL; Wisent) and 10% FBS. Cells were maintained in galactose media for 1 week prior to experiments.
Cell differentiation and treatments
H9c2 cells were differentiated into cardiomyocyte‐like cells as previously described (Branco et al. 2012). Cells were plated in T75 flasks at a density of 35 000 cells ml−1 in DMEM supplemented with galactose and allowed to sediment and adhere. After 24 h, FBS was reduced to 1% and the media supplemented with 10 nmol l−1 retinoic acid (R2625; Sigma, St Louis, MO, USA) for six consecutive days (total DMSO added < 0.1%). At day 6, cells were plated at a density of 40 000 cells ml−1 for further experiments. Cell treatments are indicated in the respective figures, as appropriate, and were: antimycin‐A (20 μm, 60 min), xanthine (X0626; Sigma)/xanthine oxidase (X1875; Sigma) (50 μm at 25 mU ml−1 and 100 μm at 50 mU ml−1, 60 min), or doxorubicin (25 μm, D1515; Sigma, 30 min to 24 h). For each experimental condition appropriate time‐matched controls were performed. All treatments were performed in 24‐well plates with cells adherent to coverslips. Each 24‐well included at least two time‐matched control wells according to the experimental protocol.
Immunofluorescence
Immunofluorescence was performed as previously described (McLelland et al. 2014) with all solutions made in PBS (in mm: 136 NaCl, 2.6 KCl, 10 Na2HPO4, 1.8 KH2PO4, pH 7.4). Briefly, at the end of the treatments, cells were first fixed at 37°C in 5% paraformaldehyde, then quenched in NH4Cl (50 mm), and permeabilized with 0.25% Triton‐X. Cells were then blocked with 10% FBS for 1 h prior to primary antibody incubation (5% FBS, 1 h) and subsequent incubation with secondary antibody (5% FBS, 1 h, in the dark). The coverslips were then mounted on glass slides using ProLong Gold without and with DAPI, depending on the experiment (P36934 and P36935, respectively; Life Technologies, Carlsbad, CA, USA).
Confocal microscopy and vesicle quantification
Slides were imaged by confocal microscopy using a 100×, 1.4 NA objective on an LSM 510 Meta confocal microscope (Zeiss, Oberkochen, Germany). Excitation/emission wavelengths were 561/640 nm for pyruvate dehydrogenase (PDH) and 488/520 nm for translocase of the outer membrane (TOM20). Acquired images were analysed using ImageJ (NIH, Bethesda, MD, USA). Vesicles were identified visually, based on apparent size and cargo selectivity (PDH positive or TOM20 positive, but not both) after application of a co‐localization mask to discriminate them from mitochondria (which are positive for PDH and TOM20). Apparent vesicle size was ∼300 nm, which represents an estimated actual size of ∼50 nm considering the lateral resolution limit of confocal microscopy (Neupane et al. 2015). For the analysis, overlay TIF images were opened on ImageJ, colour channels were split, and the co‐localization mask plugin was applied using only the green and red channels (ratio: 50%, Threshold 1 and 2: 50, Display value: 255). After this transformation, the mitochondrial network or any small mitochondria containing both PDH and TOM20 appeared white and were visually excluded from the analysis. On the resulting image the colour balance was then adjusted in each channel to a minimum below signal (30–60 to eliminate background) and maximum of 121 to enhance contrast. The resulting image was used to visually identify circular structures (>9 pixels2) positive for either PDH or TOM20 as previously described (McLelland et al. 2014). Data represent the average of 10–20 cells per experiment and at least three independent experiments, unless otherwise described in the figure legend. Quantitative analysis of mitochondrial morphology was conducted on the same cells in which MDV formation was quantified using the morphometric analysis application of the ImageJ software (W. S. Rasband, NIH, imagej.nih.gov/ij/, 1997–2012). Images of the mitochondrial network were first denoised with a median filter, followed by a top hat filter, to enhance the separation of mitochondria from the background (Koopman et al. 2006; Willems et al. 2009). Images where then binarized to create a mask, and submitted to particle analysis for acquiring form factor (FF = perimeter2/4π × area), aspect ratio (AR = long axis/short axis) and roundness (4 × [area]/π × [major axis2]) values. Form factor, aspect ratio and roundness were used as indicators of mitochondrial morphology: form factor – evaluation of mitochondrial complexity (the higher the form factor the higher the mitochondrial complexity, indicating a branched network); aspect ratio – evaluation of mitochondria elongation (1 being a perfect line); roundness – measurement of proximity to circularity (roundness is an indicator of mitochondrial network fragmentation and mitochondrial damage).
Measurement of oxygen consumption rates
Oxygen consumption rates (OCRs) were measured in H9c2 myoblasts using an XF24 Seahorse extracellular flux analyser (Seahorse Bioscience, North Billerica, MA USA). Thirty thousand cells were plated in XF24 well plates in basal XF media supplemented with galactose (10 mm), sodium pyruvate (1 mm) and 2 mm glutaMax. Baseline OCR was recorded for 30 min following which 25 μm doxorubicin or its vehicle was injected. Baseline measurements were pursued for an additional 30 min, followed by the sequential addition of oligomycin (1 μm), CCCP (1 μm) and antimycin‐A (1 μm). ATP‐linked OCR was calculated as the difference between baseline and oligomycin‐inhibited OCR. Maximal uncoupled respiration was derived from the maximal OCR reached 30 min after injection of CCCP. Proton leak‐driven respiration was calculated as the difference between olygomycin‐inhibited OCR and residual OCR measured after complete inhibition of the electron transport chain flux with antimycin‐A. Wells were visually inspected before and after each experiment to ensure that no cells had detached during the assay. Values are reported in pmol O2 min–1 30,000 cells.
Animal experiments
Adult C57/BL6 mice (8–12 weeks, Charles River, Wilmington, MA, USA) were injected i.p. with doxorubicin (in PBS, 15 mg kg−1) or with PBS (vehicle). Injections were made at 0 and 48 h. Five days following the second injection animals were anaesthetized with inhaled isofluorane (2%) and used for echocardiography, or killed by exsanguination and the hearts used for analysis of mitochondrial function in permeabilized cardiac fibre preparations, or electron microscopy.
Echocardiography
Echocardiography was performed as previously described (Aries et al. 2004; Marchesi et al. 2011). Briefly, mice were anaesthetized with 2% isofluorane (1 l min−1 O2) and their chest shaved. Mice were then placed on their back on a warming pad and the ratio of isofluorane/O2 was adjusted to achieve heart rate values between 500 and 550 bpm under light isofluorane. Echocardiography was performed using a Visual Sonic VEVO 770 ultrasound machine and an RMV 707B High Frame Rate Scanhead with a centre frequency of 30 MHz (VisualSonics Inc., Toronto, ON, Canada).
Permeabilized cardiac fibres
Mitochondrial functional assays in permeabilized muscle fibres
Left ventricle free walls were used for dissection and permeabilization of fibre bundles with saponin, as described previously (Piquereau et al. 2013). Some permeabilized fibres were incubated in a high KCl medium to render ghost fibres. Both permeabilized and ghost fibres were kept on ice until use. Mitochondrial functional parameters were measured in duplicate for each biological replicate with a minimum of six biological replicates utilized per group. All mitochondrial functional parameters were expressed relative to dry fibre weight.
Mitochondrial respiration
Mitochondrial respiration was measured in permeabilized cardiac fibres [< 2 mg wet weight (Picard et al. 2008; Piquereau et al. 2013)] at 23°C, with constant stirring, in a respiration buffer [in mm: 2.77 CaK EGTA, 7.23 K EGTA (100 nm free Ca2+), 6.56 MgCl2 (1 mm free Mg2+), 20 taurine, 0.5 DTT, 50 potassium methane sulfonate (160 mm ionic strength), 20 imidazole, pH 7.1]. Oxygen consumption rate (nmol O2 min–1) was determined using the following sequence: complex I substrates glutamate–malate (5:2.5 mm); ADP (2 mm); the complex I blocker amytal (2 mM); the complex II substrate succinate (5 mm); the complex III blocker antimycin‐A (8 μm); and the complex IV substrates N,N′,N′‐tetramethyl‐p‐phenylenediamine dihydrochloride (TMPD)–ascorbate (0.9:9 mm).
Mitochondrial H2O2 release
Mitochondrial H2O2 release was measured in permeabilized fibres incubated in a buffer (containing in mm: 110 K‐MES, 35 KCl, 1 EGTA, 5 K2HPO4, 3 MgCl26H2O and 0.5 mg ml–1 BSA) with 1.2 U ml–1 horseradish peroxidase and the fluorescent probe Amplex red (20 μm: excitation–emission: 563 to 587 nm) at pH 7.3, 37°C(Ascah et al. 2011). Baseline fluorescence readings were taken prior to the addition of the following compounds: glutamate (5 mm), succinate (5 mm), ADP (10 mm) and antimycin‐A (8 μm). Rates of H2O2 production were calculated as change in fluorescence per minute after subtraction of baseline.
Calcium retention capacity
Calcium retention capacity (CRC) was measured in ghost fibres in CRC buffer (in mm: 250 sucrose, 10 MOPS, 0.005 EGTA, 10 Pi‐Tris, pH 7.3) supplemented with glutamate–malate (5:2.5 mm), 0.5 nm oligomycin and Ca‐Green 5N (excitation–emission: 505 to 535 nm) as per Piquereau et al. (2013). Following the addition of fibres and respiratory substrates, a single pulse of 20 nmol of Ca2+ was added. CRC was defined as the total amount of Ca2+ accumulated by mitochondria prior to permeability transition pore (PTP) opening‐induced Ca2+ release. Relative Ca2+ uptake was calculated as the difference between maximal Ca‐Green fluorescence after calcium pulse addition and fluorescence level at the moment of PTP opening.
Enzyme activity
Activities of complex I (CI, NADH‐CoQ reductase), complex II (CII, succinate dehydrogenase), complex I+III (CI+III, NADH‐CoQ reductase + CoQ:cytochrome c reductase), complex IV (CIV, cytochrome oxidase complex) and citrate synthase (CS) were measured spectrophotometrically in whole heart lysates with a plate reader using standard coupled enzyme assays as previously described (Marcil et al. 2006) with minor modifications (de Wit et al. 2008). Activities are expressed relative to control levels.
Transmission electron microscopy
Transmission electron microscopy (TEM) for morphological analysis or immunogold labelling was performed at the Facility for Electron Microscopy Research, McGill University, according to standard operating procedures. For morphological TEM, hearts from PBS‐ and doxorubicin‐treated mice were fixed in 2.5% glutaraldehyde (Sigma) in phosphate buffer overnight at 4 °C. After sample preparation, 90–100 nm thick sections were mounted onto a 200 mesh copper grid (Electron Microscopy Sciences, Hatfield, PA, USA) and imaged with an FEI Tecnai 12 120 kV transmission electron microscope equipped with an AMT XR80C 8 megapixel CCD camera.
Immunogold labelling
Immunogold co‐labelling of TOM20 and PDH was performed in heart slices from control and doxorubicin‐treated animals using pre‐ and post‐embedding methods. For pre‐embedding, longitudinal left ventricular free‐wall sections ∼1 mm thick were fixed in 5% paraformaldehyde for 30 min at 37 °C. After blocking with 10% FBS in PBS, the sections were incubated overnight with primary antibodies (1:50–1:200 anti‐PDH and anti‐TOM20, 4°C). Following thorough washing with 5% FBS, the sections were incubated overnight (4°C) with gold‐bound secondary antibodies. At the end of secondary antibody incubation the sections were thoroughly washed in PBS (6 × 10 min) and fixed in 2.5% glutaraldehyde in PBS for 15 min and processed as described above (see TEM section). For post‐embedding immunolabelling, samples were fixed in a mixture of 4% paraformaldehyde and 0.5% glutaraldehyde for 4 h at 4°C. Samples underwent either the Tokuyasu method for cryo‐immunolabelling (Tokuyasu, 1973) or LR White immunogold labelling. Primary antibody dilutions ranged between 1:2 and 1:5 with constant secondary antibody dilution of 1:20.
Quantification of MDV budding events by morphological TEM
For quantification of MDV in the heart, TEM images were acquired consecutively at a magnification of 9300× so as to image full cardiomyocytes. Images were manually screened by two independent raters to identify MDV budding events using the following criteria: (1) vesicular structures had to have a diameter of 50–200 nm, (2) their membrane had to be contiguous to the mitochondrial membrane and of comparable electron density, (3) the electron density of the MDV had to be lower than that of the mitochondrial matrix for single membrane MDVs, and similar or higher for double membrane MDVs. For each cardiomyocyte, the average number of MDV per mm2 was calculated. This analysis was performed in cardiomyocytes taken from randomly selected heart regions in 2–3 mice per experimental group. A total of 213 and 153 fields of view were analysed in control and doxorubicin‐treated groups, respectively.
Electron tomography
For tomography, approximately 150–300 μm thick sections were imaged by dual axis image tilt series from –60 to +60 deg in 1.5 deg increments on a FEI Tecnai 12 microscope equipped with a Gatan US‐1000 camera at 6500–12,000× magnification using SerialEM (Mastronarde, 2005). The etomo software package (Kremer et al. 1996) was used to reconstruct tomographic volumes from tilt series. From tomograms, three‐dimensional reconstructions and video animations were generated using 3Dmod (IMOD 4.7, Boulder Laboratory for 3‐D Electron Microscopy of Cells, CO, USA) and Image J (NIH, version 1.47v).
Statistical analysis
Unless indicated, data are presented as mean ± SEM. Unpaired Student's t test or a one‐way ANOVA followed by Dunnet's or Bonferroni multiple comparison post hoc analysis was used to determine significant differences between two or among multiple groups, respectively. Statistically significant differences were considered at P < 0.05. All analyses were performed on Prism 6.0 for Mac OS‐X.
Results
MDV formation in H9c2 cells occurs at baseline and is enhanced by prototypical oxidative stress
Previous studies have shown that in non‐cardiac cells lines made reliant on mitochondrial metabolism (with galactose as primary energy substrate), induction of prototypical oxidative stress, by either complex III inhibition or exposure to xanthine/xanthine oxidase (X/XO) as a source of H2O2, stimulates the rapid production of MDVs destined for lysosomal degradation. The produced MDVs can be identified by their apparent size (300–600 nm by light microscopy) and more importantly their selective and high enrichment for markers of the matrix (e.g. PDH+/TOM20−; hereafter PDH+) or the outer mitochondrial membrane (e.g. TOM20+/PDH−, herafter TOM20+) (Neuspiel et al. 2008; Braschi et al. 2010; Soubannier et al. 2012 a,b; McLelland et al. 2014).
To determine if a similar response occurred in a cardiac cell line model, PDH+ and TOM20+ MDVs were quantified in H9c2 myoblasts cultured in the presence of galactose at baseline and following short‐term exposure to prototypical mitochondrial stresses. TOM20+ and PDH+ vesicles were consistently observed under baseline conditions (Figs 1 A, D, 2 A, C), indicating that vesicle shedding continuously occurs in the absence of exogenous mitochondrial stress. When cells were exposed to antimycin‐A, a robust increase in the production of TOM20+ vesicles was observed within 60 min (Fig. 1 B, D), while PDH+ vesicles did not change significantly. Aspect ratio, roundness and form factor were chosen as shape descriptors to evaluate the effects of mitochondrial or cellular stress on mitochondrial network morphology. Antimycin‐A treatment did not significantly affect mitochondrial morphology (Fig. 1 E–G), as no changes in these shape descriptors were observed.
Figure 1. Antimycin‐A triggers MDV production in H9c2 cells .
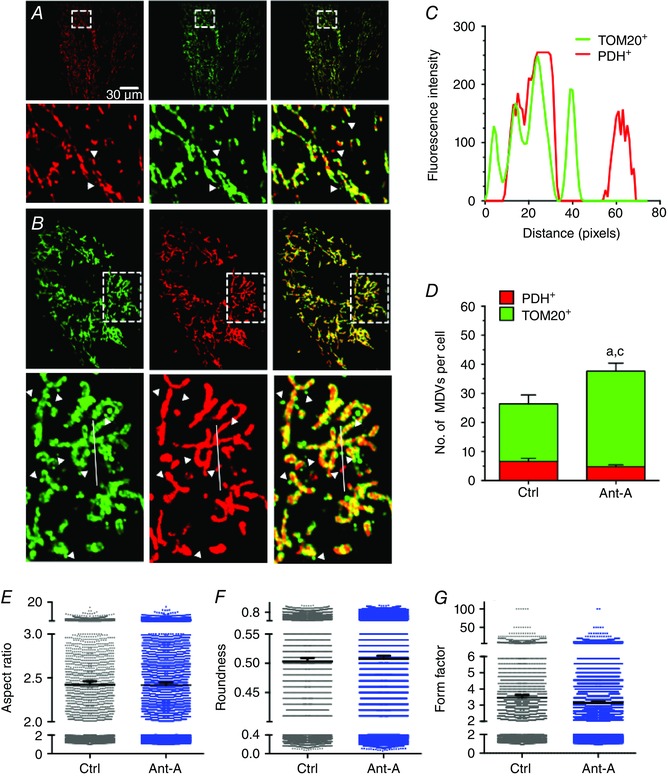
A and B, H9c2 cardiac myoblasts cultured in galactose‐containing media and treated with vehicle (A) or antimycin‐A (20 μm) for 60 min (B). Cells were immunolabelled for TOM20 (green) and PDH (red). MDVs were visually identified as described in the methods. Only circular structures of 9 pixels2 or higher labelled red for PDH or green for TOM20 (but not both) were included in the quantification. Bottom panels are magnifications of the boxed area shown in the top panels. Arrowheads indicate green TOM20+/PDH− and red PDH+/TOM20− vesicles. C, fluorescence intensity along the line illustrated in B, bottom. Two TOM20+/PDH− (green) and one PDH+/TOM20− (red) vesicles are present near the doubly labelled mitochondrion (yellow). The line graph confirms that the structures identified as MDVs are indeed single labelled structures. D, quantification of TOM20+/PDH− and PDH+/TOM20− MDVs in control and antimycin‐A treated cells at 60 min (three independent experiments per group, 10–12 random cells per experiment). Statistical comparison was made between antimycin‐A and control using unpaired t test: a, P < 0.01 TOM20+/PDH−; c, P < 0.01 total MDVs. E–G, mitochondrial network morphology was evaluated using aspect ratio, roundness and form factor as shape descriptors in control and antimycin‐A‐treated cells. Values reported represent mean ± 95% confidence interval for 4000–6000 individual mitochondria. Mitochondrial morphology indicators were determined in the same cells used for MDV quantification. Images were selected to represent average quantification data.
Figure 2. Increased TOM20+ and PDH+ MDV formation in response to H2O2 produced by the xanthine/xanthine oxidase system .
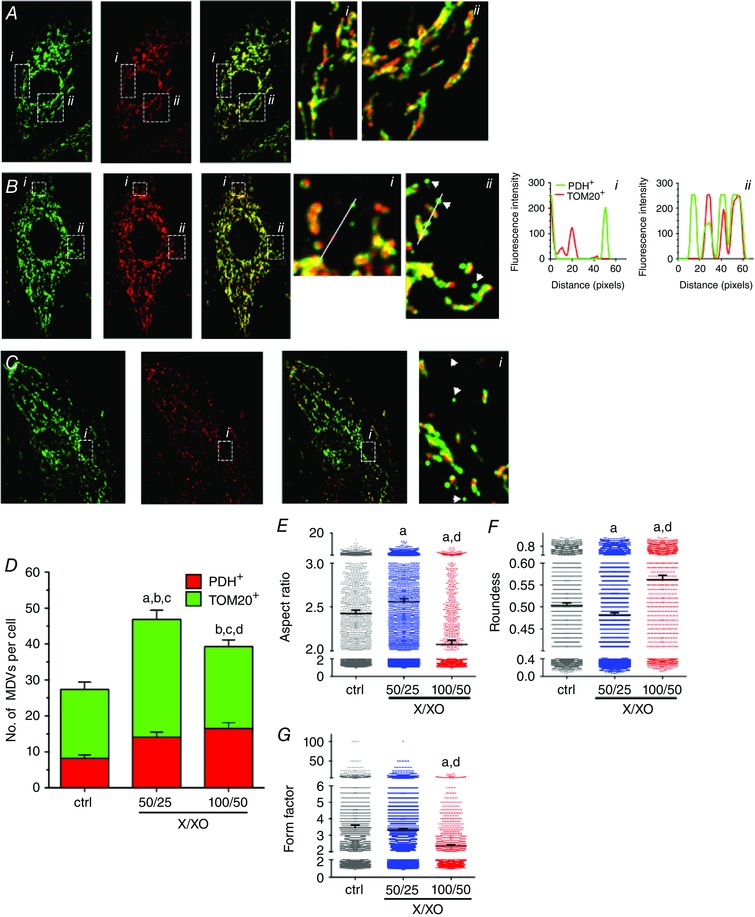
A‐C, H9c2 cardiac myoblasts cultured in galactose‐containing media and treated with vehicle (A) or xanthine/xanthine oxidase (B: X/XO = 50/25 or C: 100/50 μm/mU ml–1), for 60 min. Cells were immunolabelled for TOM20 (green) and PDH (red). Numbered panels on the right are magnifications of the boxed areas shown in the left panels. Fluorescence intensity plots along the illustrated lines are presented on the far right confirming that the structures identified as MDVs are indeed single labelled structures. D, quantification of TOM20+/PDH− and PDH+/TOM20− MDVs, as described in the Methods, in control and X/XO‐treated cells at 60 min (three independent experiments per group, 10–12 random cells per experiment). Statistical comparison was made between X/XO and control and between the two X/XO concentrations using one‐way ANOVA: a, P < 0.01 TOM20+/PDH−; b, P < 0.01 PDH+/TOM20−; c, P < 0.01 total MDVs; d, P < 0,01 TOM20+/PDH− 50/25 vs 100/50. E–G, aspect ratio, roundness and form factor in control and X/XO‐treated cells. Higher X/XO ratio resulted in increased fragmentation of the mitochondrial network (decreased form factor) and increased mitochondrial condensation (increased roundness) and decreased mitochondrial complexity (decreased aspect ratio) Values reported represent mean ± 95% confidence interval for a minimum of 4000–6000 individual mitochondria. Mitochondrial morphology indicators were determined in the same cells used for MDV quantification. A, P < 0.01 X/XO vs control; d, P < 0.01 50/25 vs 100/50 X/XO, one‐way ANOVA. Images were selected to represent average quantification data.
Cells were also acutely exposed (60 min) to increasing amounts of X/XO to generate a sustained and global production of H2O2. At the lowest concentration of X/XO (50 μm/25 mU ml−1) used, the production of TOM20+ and PDH+ vesicles was significantly increased compared to baseline values (Fig. 2 B, D). This was accompanied by a significant increase in the aspect ratio and lower roundness values compared to baseline, suggesting relative hyperfusion of the mitochondrial network (Fig. 2 E–G). At the highest concentration of X/XO (100 μm/50 mU ml−1), the production of PDH+ MDVs, but not TOM20+, was elevated in comparison to baseline (Fig. 2 C, D). However, in this condition, mitochondrial fragmentation was evident, as indicated by lower aspect ratio and form factor values, and increased roundness (Fig. 2 E–G).
Of note, in preliminary experiments MDV production was also examined in cells cultured in glucose‐containing media. Although MDVs were clearly being produced under baseline conditions, stress‐induced MDV production could not be elicited in a reproducible manner (results not shown) consistent with the notion that cellular dependence of OXPHOS facilitates stress‐induced MDV formation (Soubannier et al. 2012 a). For this reason, all subsequent in vitro experiments were performed with galactose‐containing media.
To further validate these results, experiments were next performed in H9c2 cells undergoing cardiomyocyte‐like differentiation. Differentiation of H9c2 cells by serum restriction in the presence of retinoic acid induced polynucleation, and an increase in mitochondrial content (Fig. 3 A–D). Interestingly, under baseline conditions the number of TOM20+ and PDH+ vesicles was three‐fold greater in differentiated vs non‐differentiated cells (Fig. 3 E). However, despite the substantial increase in baseline MDV levels following differentiation, cells maintained their responsiveness to oxidative stress induced by X/XO (Fig. 3 E), indicating that significant MDV formation occurs in differentiated cardiomyocyte‐like cells, both at baseline and under conditions of oxidative stress.
Figure 3. Effect of H9c2 cardiomyocyte‐like differentiation on MDV formation triggered by H 2 O 2 .
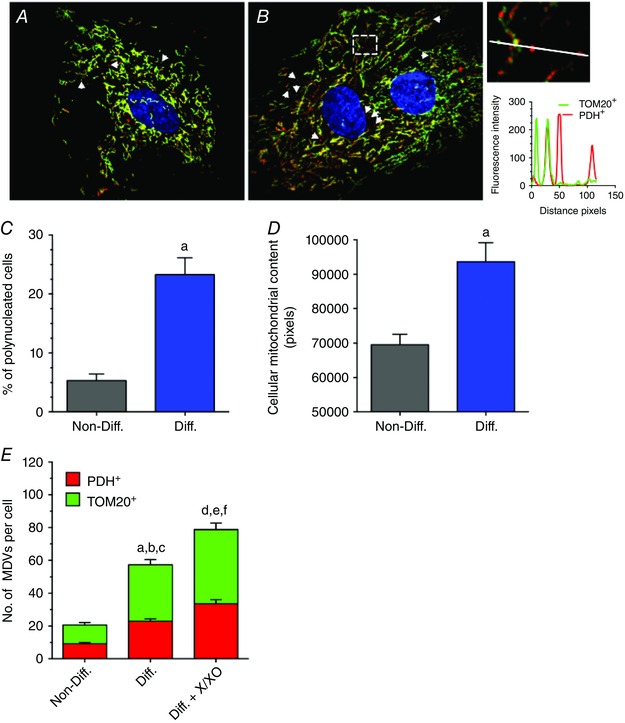
A and B, H9c2 cardiac myoblasts under control non‐differentiated conditions (A) or following differentiation into ‘cardiomyocyte‐like’ in the presence of 1% FBS and 10 nm retinoic acid (B). Cells were immunolabelled for TOM20 (green) and PDH (red), and nuclei were stained with DAPI. Arrowheads indicate TOM20+/PDH− and PDH+/TOM20− vesicles. The inset on the far right presents a magnification of the boxed region in B. A fluorescence intensity plot along the illustrated line is presented below. The line scan shows the presence of one TOM20+/PDH− (green) and two PDH+/TOM20− (red) vesicles near the doubly labelled mitochondrial network. C, percentage of polynucleated cells per field of view in non‐differentiated and differentiated conditions as an indicator of cellular differentiation. D, cellular mitochondrial content measured as the cellular surface occupied by mitochondria in non‐differentiated and differentiated conditions as another indicator of cellular differentiation; a, P < 0.01 differentiated vs. non‐differentiated using unpaired t tests. E, quantification of TOM20+/PDH− and PDH+/TOM20− MDVs in non‐differentiated and differentiated cells at baseline, and following exposure to X/XO for 60 min. Statistical comparison using one‐way ANOVA was made between differentiated and non‐differentiated (a, P < 0.01 TOM20+/PDH−; b, P < 0.01 PDH+/TOM20−; c, P < 0.01 total MDVs) and between differentiated and differentiated X/XO (d, P < 0.01 TOM20+/PDH−; e, P < 0.01 PDH+/TOM20−; f, P < 0.01 total MDVs). All values reported are mean ± SEM of at least three independent experiments per group (10–12 random cells per experiment). Images were selected to represent average quantification data.
Doxorubicin induces a rapid increase in MDV production in H9c2 cells that precedes mitochondrial network fragmentation
The observation of a functional MDV formation system in cardiac cells led us to investigate the impact of doxorubicin, a cardiotoxic anthacyclin used for cancer treatment which is well known to induce mitochondrial injury. Acute exposure of H9c2 myoblasts to 25 μm doxorubicin for 30 min increased the production of TOM20+ and PDH+ vesicles (Fig. 4 B, C). Respirometry experiments showed that between 30 and 120 min after exposure to doxorubicin, leak‐driven, ATP‐linked and maximal uncoupled oxygen consumption was not significantly altered compared to controls (Fig. 4 D–G) indicating that enhanced MDV formation occurred prior to the accumulation of overt mitochondrial dysfunction. A detailed time course of MDV production was also performed over a 6 h period. As shown in Fig. 4, doxorubicin‐induced MDV formation was maximal for both PDH+ and TOM20+ MDVs at 30 min, followed by a gradual decline until 6 h, without reaching control levels. Morphology analysis showed no evidence of mitochondrial network fragmentation at 30 min, when peak MDV production was achieved (Fig. 4 M–O). Starting at 1 h, aspect ratio values declined and roundness increased but form factor remained mainly unchanged, indicating that mitochondrial network fragmentation was progressively beginning to occur. However, cell density and general morphology was unchanged during this period indicating the absence of significant cell death (Fig. 4 I–L).
Figure 4. Acute doxorubicin treatment triggers rapid MDV production in H9c2 cells in the absence of mitochondrial dysfunction and mitochondrial network fragmentation .
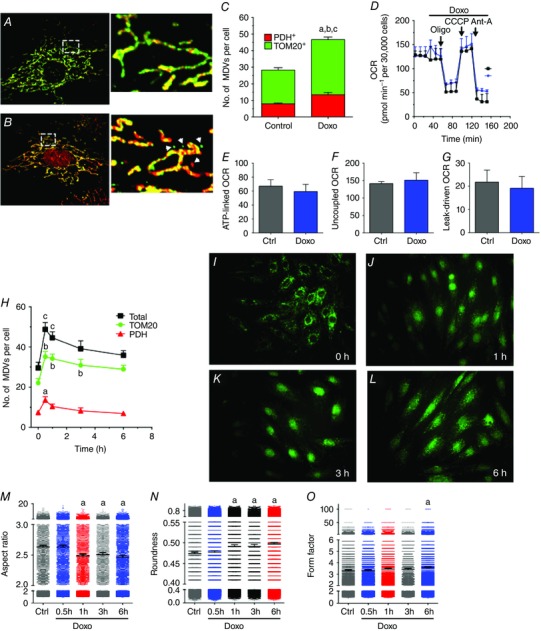
A and B, H9c2 cardiac myoblasts cultured in galactose‐containing media and treated with vehicle (A) or 25 μm doxorubicin (B) for 30 min. As in the previous figures, cells were immunolabelled for TOM20 (green) and PDH (red). In treated cells, doxorubicin fluorescence is also visible in nuclei. Insets on the right represent magnifications of boxed regions represented in A and B. Arrowheads indicate TOM20+/PDH− and PDH+/TOM20− vesicles. C, quantification of TOM20+/PDH− and PDH+/TOM20− MDVs in control and doxorubicin‐treated cells at 30 min as described in the Methods. Statistical comparison was made between doxorubicin and control using unpaired t tests: a, P < 0.01 TOM20+/PDH−; b, P < 0.01 PDH+/TOM20−; c, P < 0.01 total MDVs. D, oxygen consumption rate (OCR) profile in H9c2 cells exposed to vehicle or 25 μm doxorubicin added after recording baseline OCR. Where indicated, oligomycin (Oligo), CCCP and antimycin‐A (Ant‐A) was injected to derive key parameters of mitochondrial respiration such as ATP‐linked, maximal CCCP‐uncoupled, and leak‐driven respiration computed from the OCR profiling tests (E–G, respectively). H, time course analysis of MDV formation in cells exposed to 25 μm doxorubicin. Statistical symbols are similar to C but a one‐way ANOVA was used for the analysis. I–L, H9c2 myoblasts immunolabelled for TOM20 and imaged at low magnification (40×). Over the 6 h kinetics, no cell death was observed as evidenced by preserved cell density and general mitochondrial/cellular morphology. M–O, mitochondrial network morphology assessed as aspect ratio, roundness and form factor in control and doxorubicin‐treated cells. Statistical symbols are similar to C but a one‐way ANOVA was used for the analysis. All values reported are mean ± SEM of at least three independent experiments per group (10–12 random cells per experiment). For mitochondrial morphology, data are reported as mean ± 95% confidence interval for a minimum of 4000–6000 individual mitochondria. Images were selected to represent average quantification data.
MDV formation occurs in the intact heart
To determine the physiological relevance of MDV production, we next focused on an in vivo mouse model. In a first set of experiments, acute inhibition of complex III by antimycin‐A in isolated perfused mouse hearts was used to determine whether MDV formation, specifically budding events, could be visualized using TEM. Due to the relatively short duration of stress (10 min), overall cardiomyocyte morphology was preserved (Fig. 5 A). Importantly, vesicular structures between 50 and 200 nm in diameter were identifiable at the surface of numerous mitochondria (Fig. 5 Bi–iii). These vesicles were either single or double membraned, with the external membrane clearly contiguous with the outer mitochondrial membrane (OMM). Electron density of the single membrane vesicles was generally low, relative to the mitochondrial matrix (Fig. 5 Biii), while double membrane vesicles had an electron density that was similar or higher (Fig. 5 Bi, ii). Vesicles were also clearly distinct from surrounding sarcoplasmic reticulum (SR) tubules or from small mitochondria undergoing fission or fusion (Fig. 5 Bii).
Figure 5. Identification and modelling of MDVs produced in vivo in the mouse heart .
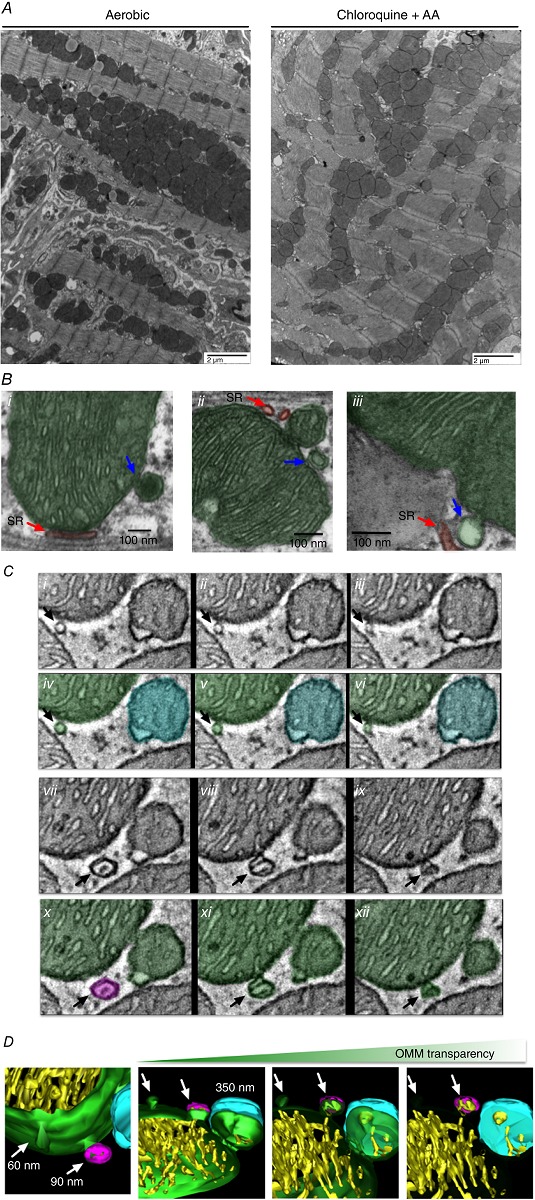
Identification of MDVs in vivo was performed in isolated hearts perfused for 30 min without or with chloroquine 30 μm/antimycin‐A (40 μm during last 10 min). Following perfusion, heart sections were fixed in 2.5% glutaraldehyde and imaged by TEM. A, low‐magnification images indicate good preservation of cardiomyocyte ultrastructure in hearts perfused with chloroquine/antimycin‐A for a short time period. B, identification of MDV budding events in several higher magnification images. Single and double membrane MDVs (blue arrows) can be distinguished from sarcoplasmic reticulum tubules (shaded red in Bi–iii) or mitochondrial fission/fusion events (see small mitochondria in Bii). C, electron tomogram of distinct sections from a chloroquine/antimycin‐A perfused heart. Ci–iii and vii–ix show serial z stack images of a mitochondrion presenting two MDV‐like structures in the process of budding (black arrows). Civ–vi and x–xii show the same images but the remodelled areas are shaded in green, cyan or magenta for increased clarity. D, 3D reconstruction of the region presented in C. The arrows point to the MDV‐like structures still budded to the mitochondria. One vesicle is ∼60 nm in diameter and is composed solely of the OMM (green). The other vesicle, which is ∼90 nm in diameter, is attached to the mitochondrial OMM on the lower portion of its height (green), while the upper portion is separated (magenta). This structure contains some inner membrane (yellow) but does not present the typical electron density of the matrix (C). A mitochondrion of about 350 nm in diameter in the process of fission or fusion is also visible in the reconstructed region. Part of its outer membrane is attached to the mother organelle (green), while the upper portion (cyan) is separated. Electron density of this small mitochondrion is typical of the mitochondrial matrix and comparable to that of the larger organelle.
To clearly distinguish MDV formation from fusion/fission events and to obtain better spatial resolution, electron tomography was performed. Figure 5(Ci–xii) shows serial z planes of two vesicular structures 60 and 90 nm in diameter budding from mitochondria. Three‐dimensional reconstruction showed membrane contiguity between these structures and the OMM across several z planes. One was composed of a single layer of OMM, while the other contained some inner membrane and had an overall electron density that was much lower than the mitochondrial matrix. In addition, the reconstructed region included a small mitochondrion of approximately 300–400 nm diameter in the process of fission or fusion. This mitochondrion, in contrast to budding vesicles, contained an organized cristae arrangement and had an electron density that was typical of the mitochondrial matrix (Fig. 5 D).
Doxorubicin‐induced mitochondrial dysfunction triggers MDV production in mouse heart
To determine whether MDV production occurs in vivo, a commonly used model of acute doxorubicin cardiotoxicity was used in C57BL/6 mice (Diotte et al. 2009; Zhang et al. 2009; Kawaguchi et al. 2012; Hoshino et al. 2013). As shown in Table 1, doxorubicin‐treated mice had a lower body weight, displayed early signs of cardiac remodelling, but had a preserved ejection fraction. Several signs of mitochondrial dysfunction were present including reduced activity of complex I, impaired baseline and ADP‐stimulated respiration in the presence of substrates for complex I, II and IV, reduced Ca2+ retention capacity, and enhanced oxidative stress evidenced by greater H2O2 release and lower aconitase activity (Fig. 6 A–E, respectively).
Table 1.
Haemodynamic characterization by echocardiography of mouse hearts
| Vehicle | Doxorubicin | n | P | |
|---|---|---|---|---|
| Age (weeks) | 2.602 ± 0.061 | 2.724 ± 0.121 | 7 | 0.395 |
| BW (g) | 29.171 ± 0.898 | 23.486 ± 1.157 | 7 | 0.002 |
| IVSd (mm) | 0.781 ± 0.027 | 0.874 ± 0.049 | 7 | 0.126 |
| LVIDd (mm) | 3.912 ± 0.061 | 3.469 ± 0.184 | 7 | 0.042 |
| LVPWd (mm) | 0.827 ± 0.041 | 0.849 ± 0.061 | 7 | 0.774 |
| IVSs (mm) | 1.292 ± 0.043 | 1.289 ± 0.074 | 7 | 0.971 |
| LVIDs (mm) | 2.523 ± 0.096 | 2.179 ± 0.118 | 7 | 0.043 |
| LVPWs (mm) | 1.196 ± 0.069 | 1.239 ± 0.077 | 7 | 0.683 |
| mm‐mode RR | 113.337 ± 1.013 | 114.513 ± 1.241 | 7 | 0.476 |
| HR (bpm) | 529.648 ± 4.770 | 524.328 ± 5.725 | 7 | 0.487 |
| FS (%) | 35.583 ± 1.765 | 36.766 ± 2.998 | 7 | 0.740 |
| LV mass (mg) | 114.775 ± 5.811 | 104.623 ± 9.114 | 7 | 0.366 |
| LV mass index (mg g–1) | 3.974 ± 0.267 | 4.502 ± 0.446 | 7 | 0.330 |
| LV mass cor | 91.820 ± 4.640 | 83.699 ± 7.296 | 7 | 0.366 |
| Lvmass cor index | 3.179 ± 0.220 | 3.602 ± 0.353 | 7 | 0.330 |
| RWT | 0.412 ± 0.012 | 0.506 ± 0.034 | 7 | 0.024 |
| LVVd (μl) | 66.542 ± 2.455 | 51.114 ± 6.323 | 7 | 0.042 |
| LVVs (μl) | 23.180 ± 2.208 | 16.322 ± 2.235 | 7 | 0.050 |
| EF | 65.444 ± 2.354 | 66.934 ± 3.924 | 7 | 0.750 |
BW, body weight; IVSd/s, intraventricular septum (diastole/systole); LVIDd/s, left ventricular inner diameter (diastole/systole); LVPWd/s, left ventricular posterior wall (diastole/systole); HR, heart rate; FS, fractional shortening; RWT, relative wall thickness; LVVd/s, left ventricular volume (diastole/systole); EF, ejection fraction.
Figure 6. Effect of acute doxorubicin treatment on cardiac mitochondrial function .
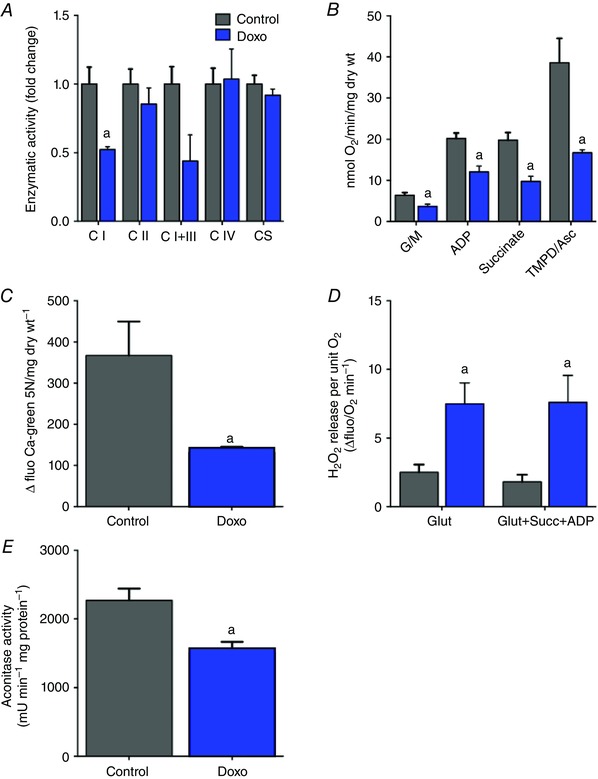
Mitochondrial function was characterized in mouse hearts 5 days after acute doxorubicin treatment as described in the Methods. A, enzymatic activity of complex I, II, I+III, IV and citrate synthase was measured in whole heart lysates. B, respiratory function measured in saponin‐permeabilized cardiac fibre bundles. Respiration was measured following sequential addition of the CI substrates glutamate + malate (G/M), ADP, the C‐II substrate succinate and the CIV substrate TMPD/ascorbate. C, Ca2+ retention capacity measured in permeabilized cardiac fibres using calcium green 5N. Reduced Ca2+ retention is indicative of premature opening of the PTP. D, net mitochondrial H2O2 release measured in permeabilized cardiac fibres under state 2 conditions in the presence of the CI substrate glutamate or under state 3 conditions in the presence of ADP and a combination of glutamate and succinate to provide a dual input of electrons at C‐I and C‐II. E, activity of the ROS‐sensitive mitochondrial enzyme aconitase measured in whole heart lysates. Values represent the mean ± SEM for n = 4–8 mice per group. A, P < 0.05 vs. control; two‐way ANOVA multiple comparisons for mitochondrial respiration and H2O2 release, and unpaired t test for enzymatic activity, calcium retention capacity and aconitase activity.
As acute doxorubicin treatment resulted in mitochondrial dysfunction, we sought to quantify MDV formation. In preliminary experiments, dual immunogold labelling of TOM20 and PDH was performed in pre‐ or post‐embedded heart slices from control animals. Positively stained MDV‐like vesicular structures could be identified in pre‐embedded samples (Fig. 7 Ai, ii). However, due to a combination of low antibody penetration in the cardiac tissue and low antigenicity, this method did not yield sufficient analysable data. Abundant labelling of mitochondria could be achieved using post‐embedding, which improves antigen access. However, preservation of ultrastructure was dramatically reduced and insufficient to resolve small vesicular structures (Fig. 7 Aiii, iv). For these reasons morphological TEM analysis was used for quantification of MDV budding events, by acquiring serial, high‐magnification images (9300×) which were then stitched together to reconstitute entire cardiomyocytes from the left ventricular free wall (Fig. 7 B). Systematic quantification of MDV budding events was performed by two independent raters in cardiomyocytes taken from vehicle and doxorubicin‐treated mice. Spearman's rank coefficient (rho) values of 0.74, P < 0.0001 (Fig. 7 C), were obtained demonstrating good inter‐rater reliability. Using this approach, mitochondrial vesicle budding was frequently observed in hearts from control mice. Furthermore, in response to doxorubicin treatment the incidence of vesicle budding from mitochondria more than doubled, in comparison to control (Fig. 7 D). The average diameter of budding vesicles was 79 ± 2 and 86 ± 2 nm in control and doxorubicin groups, respectively (Fig. 7 E). In addition, the accumulation of small, MDV‐like vesicles immediately surrounding mitochondria was significantly higher in hearts from doxorubicin‐treated mice compared to controls (Fig. 8 A, B). Quantification of autophagosomes containing mitochondria was also performed on the same samples. As shown in Fig. 8(F), autophagosomes containing mitochondria could only be found in hearts from doxorubicin‐treated mice. However, the number of mitophagosomes was an order of magnitude lower than the number of MDV budding events.
Figure 7. MDV formation is increased by acute doxorubicin treatment in the mouse heart .
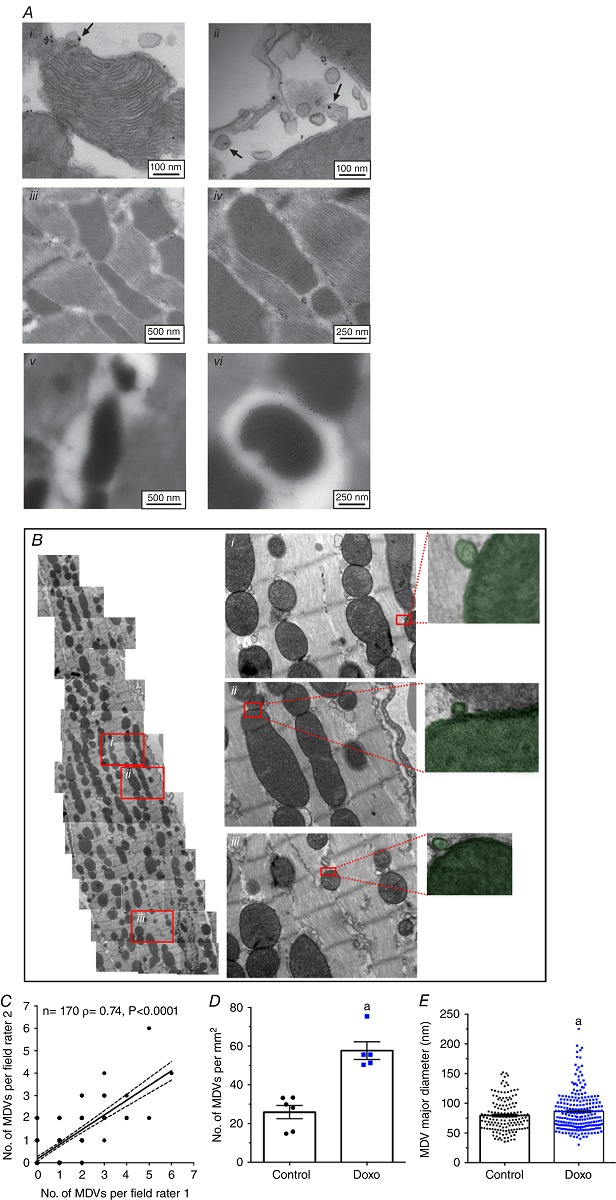
A, immunogold labelling of PDH and TOM20 in the heart. Hearts from control and doxorubicin‐treated animals were subjected pre‐ and post‐embedding immunogold labelling protocols. Pre‐embedding (i, ii) provided higher image quality and high‐specificity binding, but little labelling due to poor antibody penetration, and thus low yield of analysable images. Post‐embedding (iii–vi) provides high‐specificity binding with high sensitivity but very low structural resolution images for MDV identification. B, heart sections from control and doxorubicin‐treated mice were fixed for TEM analysis. Successive images acquired at a magnification of 9300× were stitched together to reconstitute whole cardiomyocytes. Numbered (i–iii) insets represent magnifications of the boxed regions of the left panel. On the far right are representative examples of MDVs, budding from mitochondria, that were included in the quantification (shaded green). C, number of MDV budding events per field of view assessed by two independent raters. Each dot represents a single field of view (n = 170). Average ± 95 % confidence interval of the linear regression analysis is shown along with the Spearman rho (ρ) coefficient, which is indicative of inter‐rater agreement level. D, quantification of MDV budding events in control and doxorubicin‐treated mice reported as number of MDVs per mm2 of cardiomyocyte surface area. E, major diameter of MDVs in control and doxorubicin‐treated mice. Data were obtained from a total of 366 distinct fields of view reconstituting entire cardiomyocytes from 2–3 different mice per experimental group. Each dot represents the average value obtained in distinct cells selected randomly. a, P < 0.05 vs. control, unpaired t test.
Images were selected to represent average quantification data.
Figure 8. Increased incidence of perimitochondrial vesicular clusters and mitophagosomes in response to acute doxorubicin treatment .
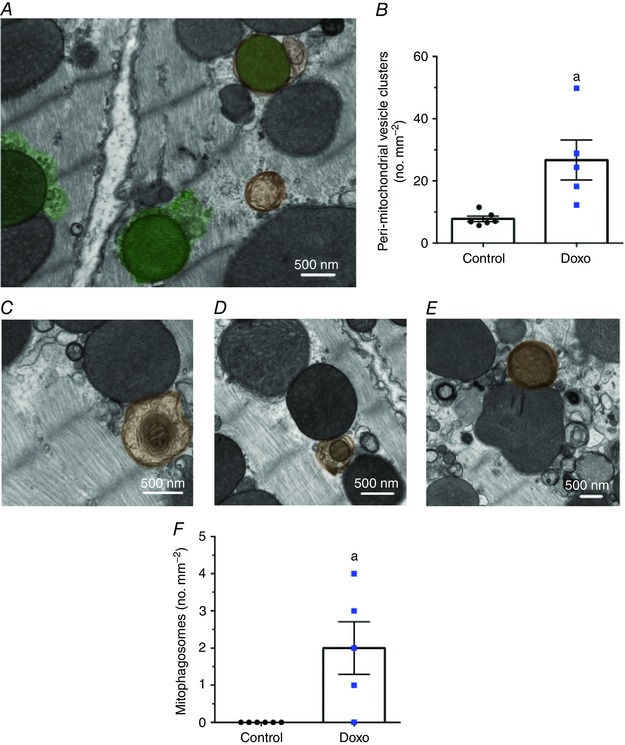
A, accumulation of peri‐mitochondrial vesicle clusters (shaded green) in hearts from doxorubicin‐treated mice. B, quantification of peri‐mitochondrial vesicle clusters in control and doxorubicin‐treated mice per mm2 of cardiomyocyte surface area. C–E, autophagosomes containing mitochondria (shaded orange) in hearts of doxorubicin‐treated mice. F, quantification of mitophagosomes in hearts from control and doxorubicin‐treated mice reported per mm2 of cardiomyocyte surface area. Data were obtained from the same fields of view used to quantify MDV budding events (see Fig. 7 legend for details). a, P < 0.05 vs. control, unpaired t test. Images were selected to represent average quantification data.
Discussion
Throughout the last decade, mitochondrial function and QC have been the subject of increased research focus. Mitochondrial QC mechanisms, including MDV formation, may represent novel targets for modulation of mitochondrial function and cell survival, but remain to be solidly validated in several cell types and, more importantly, in vivo, under both physiological and pathological conditions. In this study, we provide novel evidence supporting a role for MDV formation in mitochondrial QC in the cardiac system.
Our in vitro experiments performed in H9c2 cells reveal important characteristics of the MDV production system in cardiac‐like cells. We show that TOM20+ and PDH+ vesicles, the two types of MDVs recently suggested to be involved in the segregation and delivery of oxidized mitochondrial proteins to lysosomes (Soubannier et al. 2012 a), are produced in cardioblasts under normal cell culture conditions, indicating that MDV formation is an active baseline process. Consistent with our initial observations (Soubannier et al. 2012 a), MDV production is more readily observable when cardioblasts are made reliant on OXPHOS for energy production (i.e. in galactose‐containing media), confirming that this process is commensurate with mitochondrial metabolic activity. In this regard, we also observed that baseline production of TOM20+ and PDH+ vesicles is substantially enhanced in cardioblasts undergoing differentiation. Although the mechanisms underlying this increase in expression have not yet been established, it is striking that it occurs at a time when cells are undergoing significant reprogramming towards oxidative metabolism. In H9c2 cells, this reprogramming not only implies an increase in mitochondrial content and function, but also significant changes in their molecular makeup, requiring an increase in both protein biosynthesis and elimination (Bisetto et al. 2013; Branco et al. 2015; Kuznetsov et al. 2015). Thus, increased MDV formation during cardioblast differentiation may reflect the increasing metabolic activity of mitochondria, and the subsequent need for degradation of specific subsets of proteins (Katajisto et al. 2015).
In addition to being produced under basal cell culture conditions, our data demonstrate that in cardiac‐like cells MDV production is rapidly up‐regulated over a time scale of minutes to hours following exposure to mitochondrial stressors. In vitro time course experiments in cells treated with doxorubicin showed that peak MDV production was achieved within 30 min, and remained elevated for 3–6 h, in the absence of bioenergetic impairments, and overt fragmentation of the mitochondrial network. Enhanced production of MDVs was also observed within 60 min of exposure to antimycin‐A and X/XO. These data bare resemblance to time course studies performed in E2OS cells, where we found MDV production to be upregulated during the first 4 h of exposure to antimycin‐A. In these studies, whole organelle mitophagy was also detected but only after 12–24 h (Chan et al. 2011; McLelland et al. 2014), which is consistent with previous measurements of mitophagy kinetics (Chan et al. 2011; McLelland et al. 2014). Together these data suggest that formation of MDVs may constitute a first line of defence to limit the accumulation of overt mitochondrial damage, which would otherwise result in the onset of whole organelle mitophagy (Sugiura et al. 2014), a process that is arguably more complex and costly for cells.
The molecular mechanisms governing MDV formation are currently unclear. Recent work showed that formation and transport of a subset of PDH+ vesicles was dependent on PINK1/PARKIN, indicating some degree of cross‐talk with mitophagy (McLelland et al. 2014). However, because this represents only a fraction of MDVs being produced (e.g. ∼20% of PDH+ vesicles), it is likely that additional players, such as members of the Rab protein family, or other vesicle‐related proteins of uncharacterized function, may play a more central role (Sugiura et al. 2014).
Technical limitations regarding the specific monitoring of distinct QC mechanisms in intact organs under a variety of conditions pose a major challenge for assessing the physiological relevance of mitochondrial QC mechanisms. In the present study, we provide extensive electron microscopy evidence demonstrating that MDV production represents a dynamic system in the heart in vivo. Using morphological TEM and electron tomography imaging techniques, we show that MDV budding occurs in cardiac mitochondria, and can be clearly distinguished from fission/fusion events. Quantitative analysis of MDV budding events confirms our in vitro observations, demonstrating that budding events are frequent in the normal heart under baseline conditions. Importantly, the number of MDV budding events increases significantly in response to acute doxorubicin‐induced mitochondrial and cardiac dysfunction. Notably, the numbers we report probably underestimate the true amount of MDVs present in cardiomyocytes, as they only consider vesicles in the process of budding. This may be particularly true under stress conditions where the rate of MDV production increases significantly. In this regard, it is striking that, in the hearts of doxorubicin‐treated animals, clusters of small vesicles resembling MDVs were frequently observed in the vicinity of numerous mitochondria. Development of specific markers for MDVs that circumvent the current limitations of immunogold labelling would be required to confirm the origin of these peri‐mitochondrial vesicles, and to obtain a precise quantification of MDV flux.
The role of mitophagy and its contribution to cardiac mitochondrial turnover under normal and pathological conditions remain unclear and somewhat controversial (Saito & Sadoshima, 2015; Wei et al. 2015). In the present study, we provide further insight by direct comparison of the number of mitophagosomes and MDV budding events per cardiomyocyte surface area using the gold‐standard quantitative electron microscopy approach. Under baseline conditions, from a total of 213 fields of view totalling 5000 μm2, not a single autophagosome containing mitochondria was observed, which contrasts with the comparatively higher incidence of MDV budding events detected in the same set of images. Although this represents a static view of mitophagy and MDV formation, it nevertheless highlights the relative rarity of mitochondrial engulfment into autophagosomes vs vesicle shedding, under normal conditions in the adult heart. However, as reported in our previous study (Piquereau et al. 2013), mitophagosomes were present in a quantifiable manner under pathological conditions, suggesting that mitophagy is potently induced under stress, and probably requires a mitochondrial damage threshold to be reached prior to the elimination of entire organelles. However, mitophagy also seems to play a role under physiological conditions requiring a rapid and widespread turnover of mitochondria such as during perinatal cardiac maturation, were ‘fetal’ mitochondria are replaced in the process of global metabolic remodelling (Gong et al. 2015). Altogether, these data and our previously published work (Soubannier et al. 2012 a,b; McLelland et al. 2014) suggest a model in which MDV production acts as a basal mitochondrial housekeeping mechanism and a first line of defence against stress. However, under persistent stress conditions, the MDV system could become insufficient, resulting in the accumulation of mitochondrial damage and the onset of whole organelle mitophagy. Although further work is required to validate this paradigm, it is consistent with results from recent studies showing that adult mice harbouring a germline or a cardiac‐specific knockout of PARKIN have no pathological cardiac phenotype at baseline when mitophagy is impaired, but exhibit an exacerbated mitochondrial and cardiac dysfunction in response to pathological stress (Kubli et al. 2013; Piquereau et al. 2013; Song et al. 2015).
In summary, our data provide evidence of a dynamic MDV production system in cardiac cell mitochondria. Moreover, preliminary observations indicate that MDVs are also present in human skeletal muscle disease caused by primary mitochondrial genetic disorders (Fig. 9). Given the high degree of evolutionary conservation of mitochondrial biology across species and tissues, these findings suggest that MDV formation is likely to be a ubiquitous system that is relevant for our understanding of mitochondrial QC in the human heart. Future work identifying MDV‐specific factors essential for their formation will be instrumental in determining the specific contribution of this mechanism to the maintenance of mitochondrial health.
Figure 9. MDV formation in human skeletal muscle .
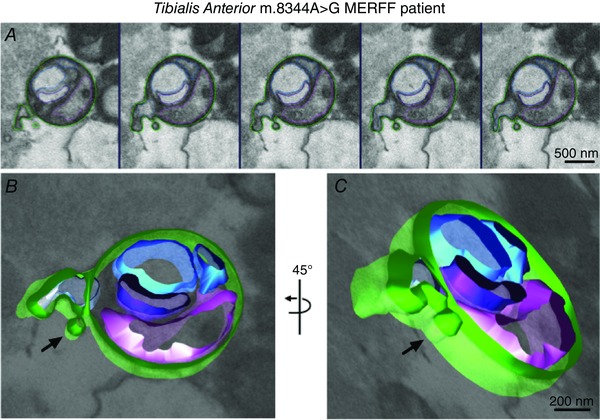
Electron tomography (A) was performed on a biopsy of tibialis anterior from a patient possessing a mitochondrial DNA mutation of MERFF (8344A > G). The sequence of consecutive electron microscopy images showing a vesicle budding off from a mitochondria was modelled using iMod software (B, C), to better demonstrate the vesicular nature of the structure.
Additional information
Competing interests
None.
Author contributions
Conception or design of the work: VJJC and YB. Acquisition, analysis, or interpretation of data for the work and drafting the work or revising it critically for important intellectual content: VJJC, SD, AC, FB, AV, DT, MP, HM, and YB. All authors: approved the final version of the manuscript; agreed to be accountable for all aspects of the work in ensuring that questions related to the accuracy or integrity of any part of the work are appropriately investigated and resolved; and qualified for authorship. All those who qualify for authorship are listed.
Funding
This work is funded by grants from the National Science and Engineering Research Council of Canada (NSERC) and the Canadian Institute of Health Research (CIHR) to YB. VJJC is recipient of a postdoctoral fellowship from the Fonds de Recherche Québec Santé (FRQS).
Acknowledgements
We thank the Facility for Electron Microscopy Research (FEMR), McGill University, in particular Jeannie Mui for technical support and TEM training provided. Also, a special acknowledgement to Dewight Williams from the University of Pennsylvania Electron Microscopy Resource Laboratory.
References
- Aries A, Paradis P, Lefebvre C, Schwartz RJ & Nemer M (2004). Essential role of GATA‐4 in cell survival and drug‐induced cardiotoxicity. Proc Natl Acad Sci USA 101, 6975–6980. [DOI] [PMC free article] [PubMed] [Google Scholar]
- Ascah A, Khairallah M, Daussin F, Bourcier‐Lucas C, Godin R, Allen BG, Petrof BJ, Des Rosiers C & Burelle Y (2011). Stress‐induced opening of the permeability transition pore in the dystrophin‐deficient heart is attenuated by acute treatment with sildenafil. Am J Physiol Heart Circ Physiol 300, H144–H153. [DOI] [PubMed] [Google Scholar]
- Bisetto E, Comelli M, Salzano AM, Picotti P, Scaloni A, Lippe G & Mavelli I (2013). Proteomic analysis of F1F0‐ATP synthase super‐assembly in mitochondria of cardiomyoblasts undergoing differentiation to the cardiac lineage. Biochim Biophys Acta 1827, 807–816. [DOI] [PubMed] [Google Scholar]
- Branco AF, Pereira SP, Gonzalez S, Gusev O, Rizvanov AA & Oliveira PJ (2015). Gene expression profiling of H9c2 myoblast differentiation towards a cardiac‐like phenotype. PLoS One 10, e0129303. [DOI] [PMC free article] [PubMed] [Google Scholar]
- Branco AF, Sampaio SF, Moreira AC, Holy J, Wallace KB, Baldeiras I, Oliveira PJ & Sardao VA (2012). Differentiation‐dependent doxorubicin toxicity on H9c2 cardiomyoblasts. Cardiovasc Toxicol 12, 326–340. [DOI] [PubMed] [Google Scholar]
- Braschi E, Goyon V, Zunino R, Mohanty A, Xu L & McBride HM (2010). Vps35 mediates vesicle transport between the mitochondria and peroxisomes. Curr Biol 20, 1310–1315. [DOI] [PubMed] [Google Scholar]
- Chan NC, Salazar AM, Pham AH, Sweredoski MJ, Kolawa NJ, Graham RL, Hess S & Chan DC (2011). Broad activation of the ubiquitin‐proteasome system by Parkin is critical for mitophagy. Hum Mol Genet 20, 1726–1737. [DOI] [PMC free article] [PubMed] [Google Scholar]
- de Wit LE, Scholte HR & Sluiter W (2008). Correct assay of complex I activity in human skin fibroblasts by timely addition of rotenone. Clin Chem 54, 1921–1922; author reply 1922–1924. [DOI] [PubMed] [Google Scholar]
- Delbridge LM, Mellor KM, Taylor DJ & Gottlieb RA (2015). Myocardial autophagic energy stress responses–macroautophagy, mitophagy, and glycophagy. Am J Physiol Heart Circ Physiol 308, H1194–H1204. [DOI] [PMC free article] [PubMed] [Google Scholar]
- Diotte NM, Xiong Y, Gao J, Chua BH & Ho YS (2009). Attenuation of doxorubicin‐induced cardiac injury by mitochondrial glutaredoxin 2. Biochim Biophys Acta 1793, 427–438. [DOI] [PubMed] [Google Scholar]
- Gong G, Song M, Csordas G, Kelly DP, Matkovich SJ & Dorn GW, 2nd (2015). Parkin‐mediated mitophagy directs perinatal cardiac metabolic maturation in mice. Science 350, aad2459. [DOI] [PMC free article] [PubMed] [Google Scholar]
- Gottlieb RA & Carreira RS (2010). Autophagy in health and disease. 5. Mitophagy as a way of life. Am J Physiol Cell Physiol 299, C203–C210. [DOI] [PMC free article] [PubMed] [Google Scholar]
- Hoshino A, Matoba S, Iwai‐Kanai E, Nakamura H, Kimata M, Nakaoka M, Katamura M, Okawa Y, Ariyoshi M, Mita Y, Ikeda K, Ueyama T, Okigaki M & Matsubara H (2012). p53‐TIGAR axis attenuates mitophagy to exacerbate cardiac damage after ischemia. J Mol Cell Cardiol 52, 175–184. [DOI] [PubMed] [Google Scholar]
- Hoshino A, Mita Y, Okawa Y, Ariyoshi M, Iwai‐Kanai E, Ueyama T, Ikeda K, Ogata T & Matoba S (2013). Cytosolic p53 inhibits Parkin‐mediated mitophagy and promotes mitochondrial dysfunction in the mouse heart. Nat Commun 4, 2308. [DOI] [PubMed] [Google Scholar]
- Kanamori H, Takemura G, Goto K, Maruyama R, Ono K, Nagao K, Tsujimoto A, Ogino A, Takeyama T, Kawaguchi T, Watanabe T, Kawasaki M, Fujiwara T, Fujiwara H, Seishima M & Minatoguchi S (2011. a). Autophagy limits acute myocardial infarction induced by permanent coronary artery occlusion. Am J Physiol Heart Circ Physiol 300, H2261–H2271. [DOI] [PubMed] [Google Scholar]
- Kanamori H, Takemura G, Goto K, Maruyama R, Tsujimoto A, Ogino A, Takeyama T, Kawaguchi T, Watanabe T, Fujiwara T, Fujiwara H, Seishima M & Minatoguchi S (2011. b). The role of autophagy emerging in postinfarction cardiac remodelling. Cardiovasc Res 91, 330–339. [DOI] [PubMed] [Google Scholar]
- Katajisto P, Dohla J, Chaffer CL, Pentinmikko N, Marjanovic N, Iqbal S, Zoncu R, Chen W, Weinberg RA & Sabatini DM (2015). Stem cells. Asymmetric apportioning of aged mitochondria between daughter cells is required for stemness. Science 348, 340–343. [DOI] [PMC free article] [PubMed] [Google Scholar]
- Kawaguchi T, Takemura G, Kanamori H, Takeyama T, Watanabe T, Morishita K, Ogino A, Tsujimoto A, Goto K, Maruyama R, Kawasaki M, Mikami A, Fujiwara T, Fujiwara H & Minatoguchi S (2012). Prior starvation mitigates acute doxorubicin cardiotoxicity through restoration of autophagy in affected cardiomyocytes. Cardiovasc Res 96, 456–465. [DOI] [PubMed] [Google Scholar]
- Kim I, Rodriguez‐Enriquez S & Lemasters JJ (2007). Selective degradation of mitochondria by mitophagy. Arch Biochem Biophys 462, 245–253. [DOI] [PMC free article] [PubMed] [Google Scholar]
- Koopman WJ, Visch HJ, Smeitink JA & Willems PH (2006). Simultaneous quantitative measurement and automated analysis of mitochondrial morphology, mass, potential, and motility in living human skin fibroblasts. Cytometry A 69, 1–12. [DOI] [PubMed] [Google Scholar]
- Kremer JR, Mastronarde DN & McIntosh JR (1996). Computer visualization of three‐dimensional image data using IMOD. J Struct Biol 116, 71–76. [DOI] [PubMed] [Google Scholar]
- Kubli DA, Zhang X, Lee Y, Hanna RA, Quinsay MN, Nguyen CK, Jimenez R, Petrosyan S, Murphy AN & Gustafsson AB (2013). Parkin protein deficiency exacerbates cardiac injury and reduces survival following myocardial infarction. J Biol Chem 288, 915–926. [DOI] [PMC free article] [PubMed] [Google Scholar]
- Kuznetsov AV, Javadov S, Sickinger S, Frotschnig S & Grimm M (2015). H9c2 and HL‐1 cells demonstrate distinct features of energy metabolism, mitochondrial function and sensitivity to hypoxia‐reoxygenation. Biochim Biophys Acta 1853, 276–284. [DOI] [PMC free article] [PubMed] [Google Scholar]
- Lemasters JJ (2014). Variants of mitochondrial autophagy: Types 1 and 2 mitophagy and micromitophagy (Type 3). Redox Biol 2, 749–754. [DOI] [PMC free article] [PubMed] [Google Scholar]
- Marchesi C, Essalmani R, Lemarie CA, Leibovitz E, Ebrahimian T, Paradis P, Seidah NG, Schiffrin EL & Prat A (2011). Inactivation of endothelial proprotein convertase 5/6 decreases collagen deposition in the cardiovascular system: role of fibroblast autophagy. J Mol Med (Berl) 89, 1103–1111. [DOI] [PubMed] [Google Scholar]
- Marcil M, Ascah A, Matas J, Belanger S, Deschepper CF & Burelle Y (2006). Compensated volume overload increases the vulnerability of heart mitochondria without affecting their functions in the absence of stress. J Mol Cell Cardiol 41, 998–1009. [DOI] [PubMed] [Google Scholar]
- Mastronarde DN (2005). Automated electron microscope tomography using robust prediction of specimen movements. J Struct Biol 152, 36–51. [DOI] [PubMed] [Google Scholar]
- McBride H & Scorrano L (2013). Mitochondrial dynamics and physiology. Biochim Biophys Acta 1833, 148–149. [DOI] [PubMed] [Google Scholar]
- McLelland GL, Soubannier V, Chen CX, McBride HM & Fon EA (2014). Parkin and PINK1 function in a vesicular trafficking pathway regulating mitochondrial quality control. EMBO J 33, 282–295. [DOI] [PMC free article] [PubMed] [Google Scholar]
- Neupane B, Jin T, Mellor LF, Loboa EG, Ligler FS & Wang G (2015). Continuous‐wave stimulated emission depletion microscope for imaging actin cytoskeleton in fixed and live cells. Sensors 15, 24178–24190. [DOI] [PMC free article] [PubMed] [Google Scholar]
- Neuspiel M, Schauss AC, Braschi E, Zunino R, Rippstein P, Rachubinski RA, Andrade‐Navarro MA & McBride HM (2008). Cargo‐selected transport from the mitochondria to peroxisomes is mediated by vesicular carriers. Curr Biology 18, 102–108. [DOI] [PubMed] [Google Scholar]
- Picard M, Csukly K, Robillard ME, Godin R, Ascah A, Bourcier‐Lucas C & Burelle Y (2008). Resistance to Ca2+‐induced opening of the permeability transition pore differs in mitochondria from glycolytic and oxidative muscles. Am J Physiol Regul Integr Comp Physiol 295, R659–R668. [DOI] [PubMed] [Google Scholar]
- Piquereau J, Godin R, Deschenes S, Bessi VL, Mofarrahi M, Hussain SN & Burelle Y (2013). Protective role of PARK2/Parkin in sepsis‐induced cardiac contractile and mitochondrial dysfunction. Autophagy 9, 1837–1851. [DOI] [PubMed] [Google Scholar]
- Saito T & Sadoshima J (2015). Molecular mechanisms of mitochondrial autophagy/mitophagy in the heart. Circ Res 116, 1477–1490. [DOI] [PMC free article] [PubMed] [Google Scholar]
- Song M, Gong G, Burelle Y, Gustafsson AB, Kitsis RN, Matkovich SJ & Dorn GW, 2nd (2015). Interdependence of Parkin‐mediated mitophagy and mitochondrial fission in adult mouse hearts. Circ Res 117, 346–351. [DOI] [PMC free article] [PubMed] [Google Scholar]
- Soubannier V, McLelland GL, Zunino R, Braschi E, Rippstein P, Fon EA & McBride HM (2012. a). A vesicular transport pathway shuttles cargo from mitochondria to lysosomes. Curr Biol 22, 135–141. [DOI] [PubMed] [Google Scholar]
- Soubannier V, Rippstein P, Kaufman BA, Shoubridge EA & McBride HM (2012. b). Reconstitution of mitochondria derived vesicle formation demonstrates selective enrichment of oxidized cargo. PloS One 7, e52830. [DOI] [PMC free article] [PubMed] [Google Scholar]
- Stanley WC, Recchia FA & Lopaschuk GD (2005). Myocardial substrate metabolism in the normal and failing heart. Physiol Rev 85, 1093–1129. [DOI] [PubMed] [Google Scholar]
- Sugiura A, McLelland GL, Fon EA & McBride HM (2014). A new pathway for mitochondrial quality control: mitochondrial‐derived vesicles. EMBO J 33, 2142–2156. [DOI] [PMC free article] [PubMed] [Google Scholar]
- Tokuyasu KT (1973). A technique for ultracryotomy of cell suspensions and tissues. J Cell Biol 57, 551–565. [DOI] [PMC free article] [PubMed] [Google Scholar]
- Wei H, Liu L & Chen Q (2015). Selective removal of mitochondria via mitophagy: distinct pathways for different mitochondrial stresses. Biochim Biophys Acta 1853, 2784–2790. [DOI] [PubMed] [Google Scholar]
- Willems PH, Smeitink JA & Koopman WJ (2009). Mitochondrial dynamics in human NADH:ubiquinone oxidoreductase deficiency. Int J Biochem Cell Biol 41, 1773–1782. [DOI] [PubMed] [Google Scholar]
- Zhang Y, El‐Sikhry H, Chaudhary KR, Batchu SN, Shayeganpour A, Jukar TO, Bradbury JA, Graves JP, DeGraff LM, Myers P, Rouse DC, Foley J, Nyska A, Zeldin DC & Seubert JM (2009). Overexpression of CYP2J2 provides protection against doxorubicin‐induced cardiotoxicity. Am J Physiol 297, H37–H46. [DOI] [PMC free article] [PubMed] [Google Scholar]