

Abstract
Peripheral artery disease (PAD) is a highly prevalent disease diagnosed by the use of ankle-brachial index (ABI) at rest. In some clinical conditions (diabetes, renal insufficiency, advanced age), ABI can be falsely normal and other tests are required for the PAD diagnosis (American Heart Association statement). This study was conducted to determine the accuracy of exercise transcutaneous oxygen pressure measurement (exercise-TcPo2) in detection of arterial stenosis ≥50% using computed tomography angiography (CTA) as the gold standard.
We retrospectively analyzed consecutive patients referred to our vascular unit (University Hospital, Rennes, France) for exercise-TcPo2 testing from 2014 to 2015. All included patients had a CTA performed within 3 months of the exercise-TcPo2 test. Exercise-TcPo2 was performed on treadmill (10% slope; 2 mph speed). We calculated the Delta from Resting Oxygen Pressure (DROP) index (expressed in mm Hg) at the proximal and distal levels. Two blinded physicians performed stenosis quantification on CTA. The receiver operating characteristic (ROC) curve was used to define a cutoff point to detect arterial stenosis ≥50%, stenosis ≥60%, and stenosis ≥70%.
A total of 34 patients (mean age 64 ± 2 years old; 74% men) were analyzed. The highest areas under the curve (AUC) were found for 60% stenosis at both proximal and distal levels. For stenosis ≥50%, sensitivity and specificity of proximal minimal DROP were 80.9% [67.1–89.7], 81.0% [59.3–92.7] respectively. For stenosis ≥50%, sensitivity and specificity of distal minimal DROP were 73.2% [60.3–83.1], 83.3% [53.8–96.2], respectively. For stenosis ≥60%, sensitivity and specificity of proximal minimal DROP were 82.5% [67.6–91.5] and 85.7% [67.7–94.8] respectively. For stenosis ≥60%, sensitivity and specificity of distal minimal DROP were 80.4% [67.3–89.1] and 88.2% [64.2–97.7], respectively. For stenosis ≥70%, sensitivity and specificity of proximal minimal DROP were 85.7% [67.7–94.8] and 75.0% [59.6–85.9] respectively. For stenosis ≥70%, sensitivity and specificity of distal minimal DROP were 86.0% [72.2–93.7] and 76.0% [56.1–88.7], respectively.
Exercise-TcPo2 using a proximal minimal DROP value ≤−15 mm Hg or a distal minimal DROP value ≤−16 mm Hg is accurate to diagnose arterial stenosis especially stenosis ≥60% on the lower limbs. Exercise-TcPo2 is safe and noninvasive test that might be used in second line for PAD diagnosis.
Keywords: exercise, methods, oxymeter, PAD, peripheral artery disease, vascular medicine
1. Introduction
Peripheral arterial disease (PAD) is a highly prevalent disease mainly caused by atherosclerosis, a systemic disease process that alters the normal structure and function of the vessels.[1]
Ankle-brachial index at rest (resting-ABI), the ratio of the systolic blood pressure measured at the ankle to the systolic blood pressure measured at the brachial artery, is the recommended clinical test to diagnose the presence and severity of PAD.[2–4] PAD is diagnosed when resting-ABI is equal to or lower than 0.90.[2–4] Unfortunately in case of various clinical conditions (diabetes, renal insufficiency, and advanced age) resting-ABI can be falsely in normal range.[2–4] In this case, the American Heart Association (AHA) stated that “when the resting-ABI is >0.90 but there is clinical suspicion of PAD, post-exercise ABI or other noninvasive tests, which may include imaging, should be used (Class I; Level of Evidence A).”[2]
Among the noninvasive tests (postexercise ABI, ultrasound examination, etc.),[5] exercise transcutaneous oxygen pressure measurement (exercise-TcPo2) can be a good means. However, the accuracy of exercise-TcPo2 to detect arterial stenosis using computed tomography angiography (CTA) as a gold standard is unknown. Two previous studies have been performed showing good sensitivity/specificity of this method to detect proximal arterial stenosis ≥75% (79%/86%) and distal arterial stenosis ≥75% (86%/84%) using arteriography as gold standard.[6,7] Unfortunately, no data exist for lower degrees of arterial stenosis although the main interest of exercise technique is to detect arterial stenosis that has no downstream hemodynamic effect at rest but becomes hemodynamically significant during exercise. We hypothesized that exercise-TcPo2 can be accurate to diagnose arterial stenosis ≥50%. Therefore, the aim of this study was to determine the accuracy of exercise-TcPo2 to detect proximal and distal arterial stenosis ≥50% using CTA as gold standard.
2. Materials and methods
2.1. Study design and population
A retrospective analysis was performed on consecutive patients with suspected claudication referred to our vascular unit (university hospital, Rennes, France) for exercise-TcPo2 testing from 2014 to 2015. In this population, we selected patients who had a CTA performed within 3 months of the TcPo2 exercise test. Patients with an abdominal aortic aneurysm 40 mm or a history of vascular surgery or angioplasty between the exercise test and arteriography were excluded. This study was conducted according to the principles outlined in the French Laws. No informed consent was required for this retrospective study performed in routine clinical practice.
2.2. Demographic characteristics
Several variables were collected such as age, gender, body mass index, and comorbidities. Coronary artery disease was defined by a history of coronary artery disease. Hypercholesterolemia was defined as a total cholesterol >6.5 mmol/L or the presence of a treatment for elevated blood lipids. Hypertension was defined as a systolic blood pressure ≥140 mm Hg, a diastolic blood pressure ≥90 mm Hg, or the presence of an antihypertensive medication.[8] Diabetes was defined as the presence of oral antidiabetic medication or insulin. Stroke was defined by a history of stroke. History of peripheral artery disease was defined by a history of vascular surgery or a previous ABI ≤0.90.
2.3. Ankle-brachial index measurement
The measurement of the ABI was performed according to the AHA guidelines using a hand-held Doppler probe (8 MHz) by trained physicians.[3] The patient was at rest for 10 minutes in the supine position, relaxed, head and heels supported, in a room with comfortable temperature (21°C). The following counterclockwise sequence was used: right brachial artery, right posterior tibial artery, right dorsalis pedis artery, left posterior tibial artery, left dorsalis pedis artery, left brachial artery, and right brachial artery.
2.4. Exercise-TcPo2 measurement
Briefly, measurement of TcPo2 was performed using calibrated TcPo2 electrodes (TCOM/TcPo2; PF 6000TcPo2/CO2 Unit; Perimed; Jarfalla, Sweden). The temperature of each electrode was set to 45°C, which allows maximal vasodilation and decreases the arterial to skin surface oxygen pressure gradient. A reference electrode (chest electrode) was placed between the scapulae to measure systemic changes in TcPo2 during exercise.[7,9,10] One electrode was positioned on each buttock, 4 to 5 cm behind the bony prominence of the trochanter, and 1 electrode on each calf. Once the electrodes were in position, a period of 10 minutes in the standing position was required to stabilize the electrodes to obtain baseline values. Exercise was performed on a treadmill at a 10% slope and a speed of up to 2 mph.[9] A 12-lead ECG monitored heart rate and rhythm during the exercise test procedure. The patient was encouraged to walk for the longest time possible to mimic his/her symptoms of claudication. Exercise was discontinued at the patient's request (or, by protocol, up to maximum exercise duration of 20 minutes). The measurements from the TcPo2 electrodes were used to calculate the Delta from Resting Oxygen Pressure (DROP) index (expressed in mm Hg), the absolute change in TcPo2 from resting value in each of the 4 limb electrodes, corrected for the absolute change in TcPo2 at the chest electrode. The equation for the DROP index is as follows:[10]
where PO2(site)tt is the oxygen pressure at a measurement site at time t, PO2(site)t0 is the mean oxygen pressure at a measurement site over the baseline resting period; PO2(chest)tt is the oxygen pressure at a chest site at time t, and PO2(chest)t0 is the mean oxygen pressure at a chest site over the baseline resting period (2 min). We used the following procedure to analyze the raw data on each electrode using an excel spreadsheet. The system PF 6000 (TcPo2/CO2 Unit; Perimed; Jarfalla, Sweden) records the value at 2 Hz. Moving averaging over 10 samples was performed on raw data to decrease the electronic artifacts on the signal. Then the values were averaged over 2.5-second interval. Additionally, on each 2.5-second interval, the TcPo2 values in each site were corrected. For this correction, we calculated the difference between the mean TcPo2 values over the 10 last seconds and over the first 2 minutes of the test. This difference was then divided by the duration of the test and the result was subtracted or added in each TcPo2 value as a weighting factor. Then the DROPs at each site were calculated. Results of exercise-TcPo2 were analyzed without knowing the results of CTA.
Right proximal DROP allows the detection of flow-reducing lesions in the right proximal arteries (the aorta, the right common iliac artery, and the right internal iliac artery), whereas right distal DROP allows the detection of flow-reducing lesions in the right proximal and distal arteries (the aorta, the right common iliac artery, the right external iliac artery, the right common femoral artery, the right superficial femoral artery, the right popliteal artery). Left proximal DROP allows the detection of flow-reducing lesions in the left proximal arteries (the aorta, the left common iliac artery, and the left internal iliac artery), whereas left distal DROP allows the detection of flow-reducing lesions in the left proximal and distal arteries (the aorta, the left common iliac artery, the left external iliac artery, the left common femoral artery, the left superficial femoral artery, the left popliteal artery).[10]
2.5. Arterial stenosis quantification using CTA
The patient's referring doctor ordered CTA as his or her discretion. CTA, used as gold standard, was performed to detect luminal arterial stenosis in each patient in our University Hospital. Significant stenosis at each artery level (aorta, common iliac artery, external iliac artery, internal iliac artery, common femoral artery, superficial femoral artery, popliteal artery on both sides) were reported by 2 blinded physicians (EC and CK) without knowing the results of exercise-TcPo2. In case of discordant stenosis quantification, a third physician (GM) performed the stenosis quantification. The percent stenosis was calculated as follows by each physician: 100 × [1 − (diameter of the lumen at the site of the stenosis/diameter if the normal lumen)]. Finally, the degree of stenosis at each artery level used for the statistical analyses was calculated as the mean of the quantification performed by both physicians. In case of a third measurement, the mean of the 2 closest stenosis quantifications was used.
2.6. Statistical analyses
2.6.1. Sample size calculation
In a 2-sided test comparing the area under the ROC curve (AUC) to a reference value for discrete response data using a z-test approximation, a sample size of 17 from the positive group (with the condition) and a sample size of 17 from the negative group (without the condition) achieves 90% power at the 0.05% significance level when the AUC under the null hypothesis is 0.500 and the AUC under the alternative hypothesis is 0.800.
2.6.2. Data analysis
Results are expressed as mean ± standard deviation in case of normal distribution (Shapiro–Wilk test) or in median [25th centile; 75th centile] in case of non-normal distribution. ROC curves were used to study the relationship between TcPo2 values (minimal DROP) and degrees of arterial stenosis assessed using CTA.[11] The minimal value of the DROP (minimal DROP) at each site was used for the analysis. The proximal minimal DROP was the combination of the right and left proximal minimal DROPs. For right proximal minimal DROP, the highest arterial stenosis on the corresponding arteries (aorta, right common iliac artery, and right internal iliac artery) was used. For left proximal minimal DROP, the highest arterial stenosis on the corresponding arteries (aorta, left common iliac artery, and left internal iliac artery) was used. The distal minimal DROP was the combination of the right and left distal minimal DROPs. For right distal minimal DROP, the highest arterial stenosis on the corresponding arteries (aorta, right common iliac artery, right external iliac artery, right common femoral artery, right superficial femoral artery, right popliteal artery) was used. For left distal minimal DROP, the highest arterial stenosis on the corresponding arteries (aorta, left common iliac artery, left external iliac artery, left common femoral artery, left superficial femoral artery, left popliteal artery) was used. ROC curve analysis is based on calculating the sensitivity and specificity of a test for each value of the studied variable in the diagnosis of a disease state. An area under the curve (AUC) of 1.000 indicates perfect performance of the test, whereas an AUC of 0.500 indicates no discriminatory power. We used the cutoff point to calculate the best sensitivity, specificity, positive predictive value (PPV), and negative predictive value (NPV).[11] Likelihood ratio positive [(LR ± Sensitivity/(1 − Specificity)] and likelihood ratio negative [LR− = (1 − Sensitivity)/Specificity] were also calculated. Statistical analyses were performed with MedCalc 12.6.1.0 software (MedCalc Software, Mariakerke, Belgium). For all statistical tests, a 2-tailed probability level of P <0.05 was used to indicate statistical significance.
3. Results
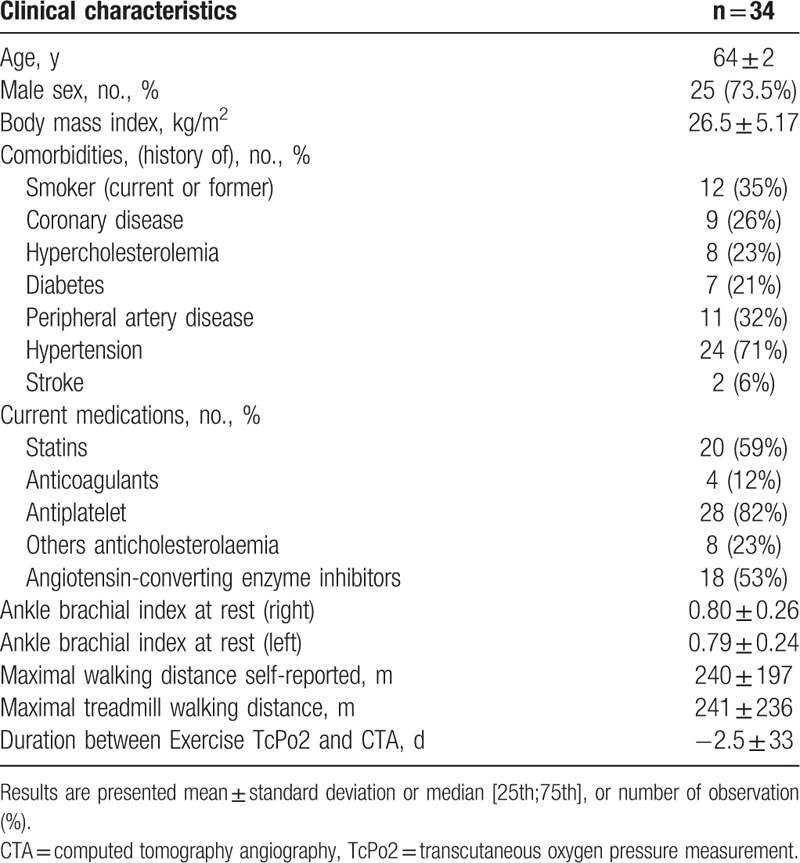
Thirty-four patients (73.5% men) were included in this retrospective study (Fig. 1). The average age and body mass index were 64 [58; 67] years old, 26.2 [23.8; 28.6] kg/m2 respectively. In this population, mean estimated walking distance was 240 ± 197 m and mean maximal walking distance on treadmill was 241 ± 236 m. Patient characteristics with comorbidities are presented in Table 1.
Figure 1.
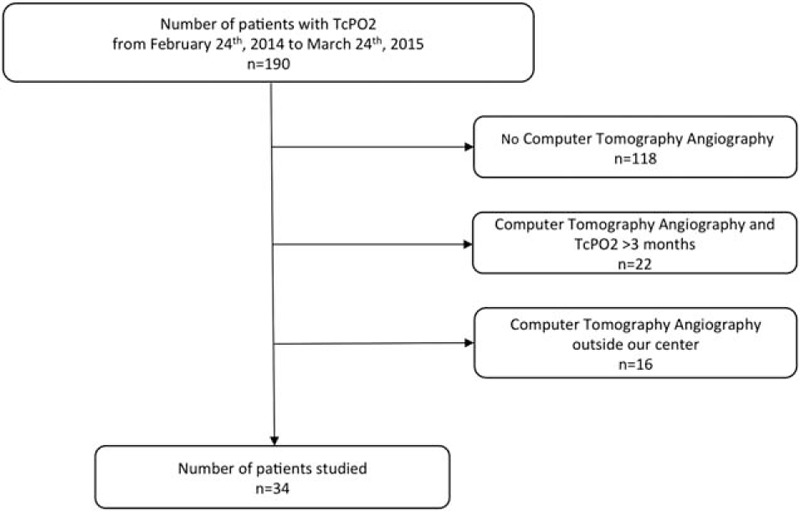
Diagram flow of the patients in the analysis.
Table 1.
Characteristics of the population studied.
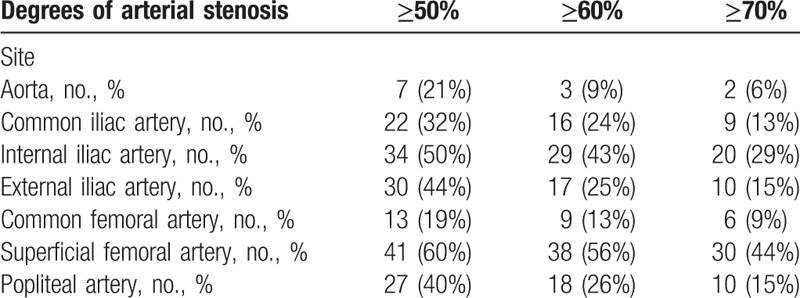
The different degrees of stenosis found of each arterial site are presented in Table 2.
Table 2.
Distribution of the stenosis assessed by computed tomography angiography.
The mean values of oxygen pressure measurement at rest at the chest level, right buttock level, left buttock level, right calf level, and left calf level were 58 ± 11, 64 ± 10, 69 ± 12, 65 ± 8, and 64 ± 10 mm Hg respectively. To detect 50%, 60%, and 70% stenosis with the proximal minimal DROP, the AUCs were 0.845 [0.737–0.921], 0.894 [0.796–0.956], and 0.798 [0.683–0.885], respectively (Table 3). For distal minimal DROP, AUCs were 0.823[0.711–0.905], 0.909[0.814–0.965], and 0.871[0.767–0.940] to detect 50%, 60%, and 70% stenosis (Table 4). The highest AUC were found for 60% stenosis at both proximal and distal levels (Fig. 2). For this degree of stenosis, the sensitivity, the specificity, and the accuracy of proximal minimal DROP with a cut-off value of −15 mm Hg were 82.5% [67.6–91.5], 85.7% [67.7–94.8], and 83.8% [75.1–92.6] respectively. For the same degree of stenosis, the sensitivity, the specificity, and the accuracy of distal minimal DROP with a cut-off value of −16 mm Hg were 80.4% [67.3–89.1], 88.2% [64.2–97.7], and 82.4% [73.3–91.4] respectively. For stenosis ≥50%, sensitivity and specificity of proximal minimal DROP were 80.9% [67.1–89.7], 81.0% [59.3–92.7] respectively (Table 3). For stenosis ≥50%, sensitivity and specificity of distal minimal DROP were 73.2% [60.3–83.1], 83.3% [53.8–96.2], respectively (Table 4). For stenosis ≥70%, sensitivity and specificity of proximal minimal DROP were 85.7% [67.7–94.8], 75.0% [59.6–85.9] respectively (Table 3). For stenosis ≥70%, sensitivity and specificity of distal minimal DROP were 86.0% [72.2–93.7], 76.0% [56.1–88.7], respectively (Table 4). We had no adverse event when performing exercise-TcPo2.
Table 3.
Overall diagnostic accuracy of proximal minimal DROP, cutoff point, area under the curve determined by receiver operating characteristic (ROC) curves to detect lower extremity arterial stenosis using computed tomography angiography as gold standard.
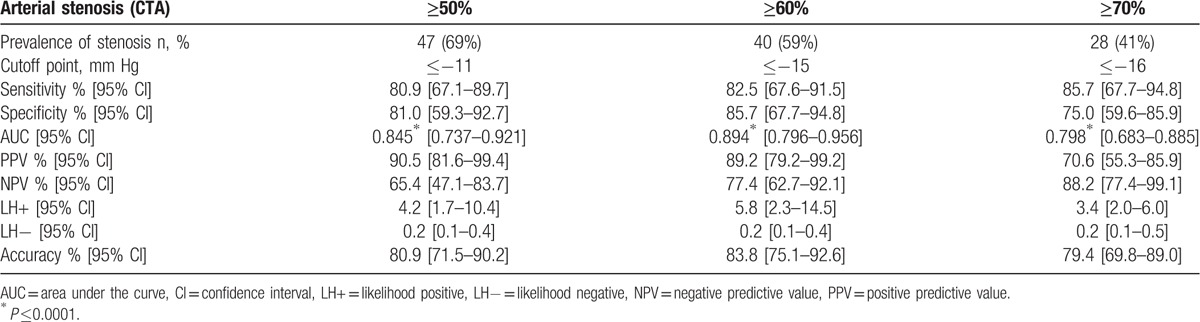
Table 4.
Overall diagnostic accuracy of distal minimal DROP, cutoff point, area under the curve determined by receiver operating characteristic (ROC) curves to detect lower extremity arterial stenosis using computed tomography angiography as gold standard.
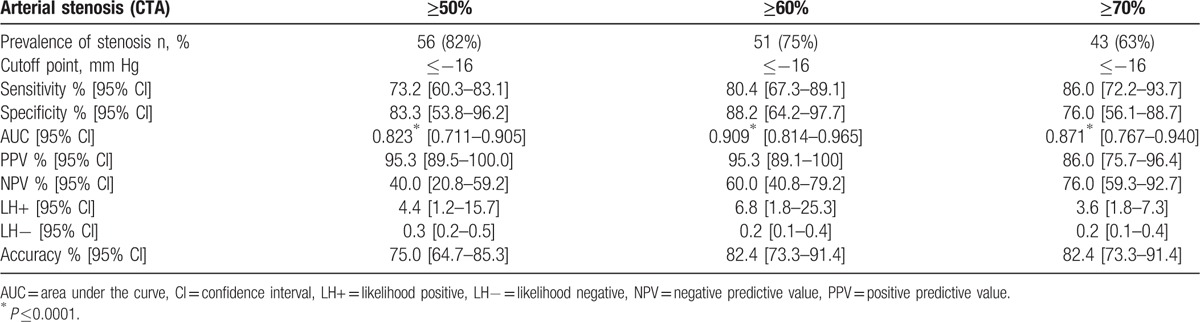
Figure 2.
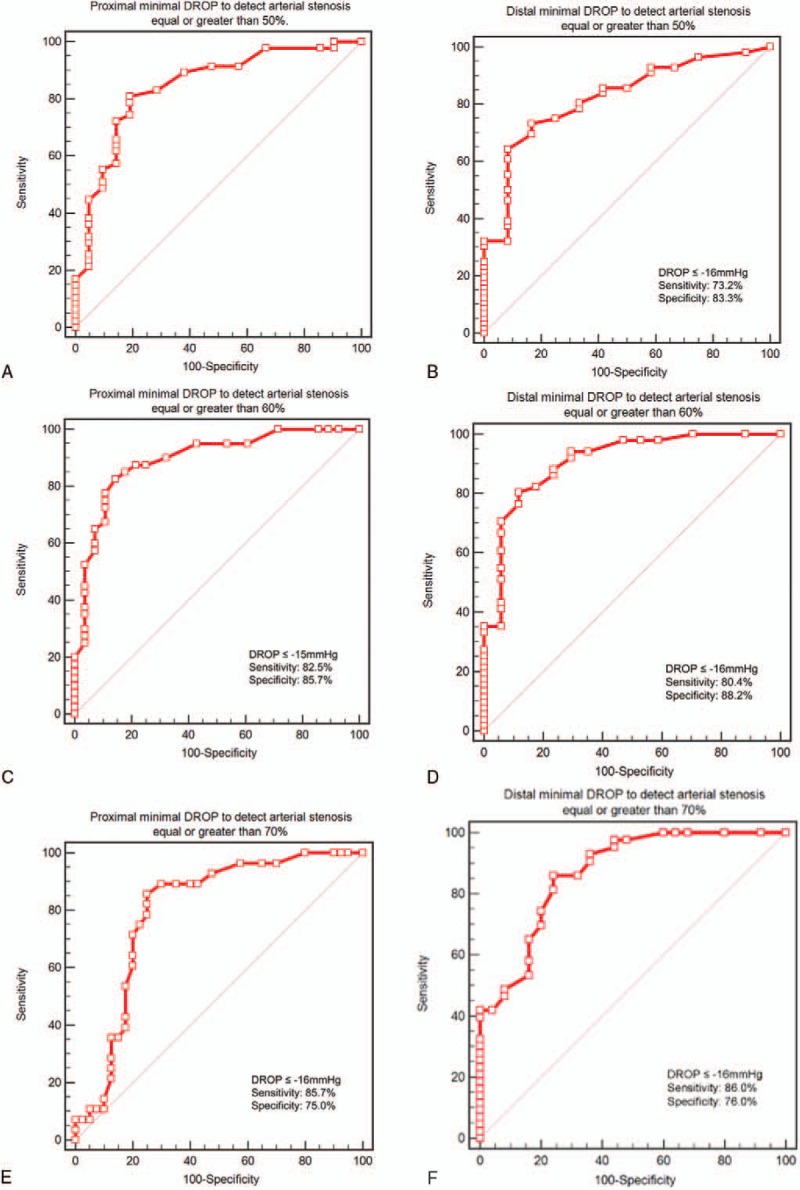
Receiving operator characteristic (ROC) curve for proximal and distal minimal DROP to detect arterial stenosis ≥50%, arterial stenosis ≥60%, and arterial stenosis ≥70% assessed by computed tomography angiography. A, ROC curve for proximal minimal DROP to detect arterial stenosis ≥50% assessed by computed tomography angiography. B, ROC curve for distal minimal DROP to detect arterial stenosis ≥50% assessed by computed tomography angiography. C, ROC curve for proximal minimal DROP to detect arterial stenosis ≥60% assessed by computed tomography angiography. D, ROC curve for distal minimal DROP to detect arterial stenosis ≥60% assessed by computed tomography angiography. E, ROC curve for proximal minimal DROP to detect arterial stenosis ≥70% assessed by computed tomography angiography. F, ROC curve for distal minimal DROP to detect arterial stenosis ≥70% assessed by computed tomography angiography. DROP = Delta from Resting Oxygen Pressure index (expressed in mm Hg). Using a ROC curve, the higher the area under curve the better the accuracy of the test.
4. Discussion
This study is the first that assesses the accuracy of exercise-TcPo2 to detect arterial stenosis ≥50% using CTA as gold standard. We find that exercise-TcPo2 is accurate to diagnose arterial stenosis especially stenosis ≥60% on the lower limbs.
Indeed, the highest AUCs are found for 60% stenosis at both proximal and distal minimal DROPs. For this degree of stenosis, the sensitivity and the specificity of proximal minimal DROP are 82.5% [67.6–91.5], 85.7% [67.7–94.8], respectively. For the same degree of stenosis, the sensitivity and the specificity of distal minimal DROP are 80.4% [67.3–89.1], 88.2% [64.2–97.7], respectively. These results are in the same range to the results found in 2 previous studies where angiography was used as gold standard to detect stenosis ≥75%.[6,7] For the proximal minimal DROP, Abraham et al found a sensitivity and specificity of 79% and 86% whereas the sensitivity and specificity for the distal minimal DROP were 86% and 84% respectively. Of interest, the proximal and distal minimal DROP cutoff values were −15 mm Hg in the 2 previous studies and similar to the minimal DROP cutoff values found in our present study (−15 mm Hg at the proximal level and −16 mm Hg at the distal level for the detection of arterial stenosis ≥60%). However, direct comparisons with previous studies are difficult due to the different gold standard used (arteriography vs CTA), the incomplete descriptions of the previous studied populations, the absence of double-blinded quantifications of arteriograms, and the use of a slightly different methodology before calculating the DROP.[6,7] In our study as described in the Method section, we systematically applied a drift correction on absolute values recorded by each electrode to correct a potential drift of the O2 pressure measurement with time at each electrode.
The other interest of this work is to evaluate the exercise-TcPo2 accuracy against CTA, a noninvasive imaging technique that is widely used in clinical routine to assess lower extremity arteries. Indeed it appears important for clinicians to know the relationship between exercise-TcPo2 and a technique that they used every day. The 2 previous studies compared exercise-TcPo2 with arteriography that is less common nowadays because it is an invasive means that is now mostly reserved to therapeutic features.[6,7]
The final but likely the most important question is what might be the place of exercise-TcPo2 in the patient management? Of course exercise-TcPo2 is not a first line test to diagnose PAD. The first line as mentioned by AHA guidelines is the used of resting ABI.[2,4] AHA recommends the use of other noninvasive tests when PAD is suspected in patients with an ABI >0.90.[2] In this aim, exercise-TcPo2 could be of interest for several reasons.
First, exercise-TcPo2 and near-infrared spectroscopy allows detecting and localizing regional blood flow impairment during exercise contrary to postexercise ABI.[9,12,13] Using a 5-electrode system, 4 different sites can be evaluated in the same time with the proximal right minimal DROP, proximal left minimal DROP, distal right minimal DROP, and distal left minimal DROP. Hence for a patient with a proximal left minimal DROP equal to −20 mm Hg, the CTA will probably detect a stenosis greater than 60% either on the aorta or the left common iliac or the left internal iliac artery.[7,14]
Second, exercise-TcPo2 is of great interest for proximal claudication where resting ABI can be inaccurate (diabetes, renal insufficiency, advanced age).[2–4] It has been shown that 1 of 7 patients with proximal claudication has resting ABI greater than 0.90.[15] As shown our study, exercise-TcPo2 is accurate to detect stenosis ≥60% at the proximal level and this accuracy is nearly similar to ultrasound to detect aorto-iliac stenoses ≥50%.[16] The use of a peak systolic velocity ratio ≥2.8 provided 86% sensitivity and 84% specificity (positive predictive value, 84%; negative predictive value, 85%; accuracy, 85%).[16] However, “routine” ultrasound has a poor sensitivity (41% [34%–47%]) and fair specificity (81% [72%–87%]) to detect arterial stenosis in patients with proximal claudication as shown in a multicenter study.[17] Compared with ultrasound, exercise-TcPo2 has also the advantages to assess in the same time the maximal walking distance and to reveal other causes of exercise limitations.[10]
Third, in patients with a borderline or normal resting ABI, postexercise ABI is suggested among noninvasive tests by AHA.[2,4] AHA proposed the use of 2 postexercise criteria: a postexercise ankle pressure decrease from resting value of >30 mm Hg or a postexercise ABI decrease of >20% from the resting values are diagnostic criteria for PAD diagnosis. However, Mahe et al[18] have shown an inconsistency between these 2 “standard” postexercise criteria for identifying patients with PAD (approximately 1 in 5 patients were classified differently by the 2 criteria). Furthermore, postexercise ABI does not assess blood flow during exercise and can be thus falsely normal even after exercise.
Fourth, the reproducibility of exercise-TcPo2 has been already studied and was good for the proximal minimal DROP and distal minimal DROP (r2 = 0.82 and r2 = 0.80, respectively).[19]
4.1. Limits
Although we did not assess specifically patients with resting ABI >0.90 and a high suspicion of PAD, we think that exercise-TcPo2 could be of interest especially in this group. We have previously shown that exercise-TcPo2 is accurate in noncompressible artery patients and in diabetes patients.[10,20] Nevertheless, further works are required to evaluate the interest of this technique in this specific population. Finally, we did not compare AUCs because it was not an aim of this study and this would have required having more patients.
5. Conclusion
Exercise-TcPo2 using a proximal minimal DROP value ≤−15 mm Hg or a distal minimal DROP value ≤−16 mm Hg is accurate to diagnose arterial stenosis, especially stenosis ≥60% on the lower limbs. Exercise-TcPo2 is safe and noninvasive test that might be used in second line for PAD diagnosis.
Footnotes
Abbreviations: ABI = Ankle Brachial Index, AHA = American Heart Association, AUC = area under the curve, CTA = computed tomography angiography, DROP = Delta from Resting Oxygen Pressure, Exercise-TcPo2 = exercise transcutaneous oxygen pressure measurement, LR− = likelihood ratio negative, LR+ = likelihood ratio positive, NPV = negative predictive value, PAD = peripheral artery disease, PPV = positive predictive value, ROC = receiver operating characteristic.
SC received a grant from the “Region Bretagne, bourse ARED.”
The authors have no conflicts of interest to disclose.
References
- 1.Fowkes FG, Rudan D, Rudan I, et al. Comparison of global estimates of prevalence and risk factors for peripheral artery disease in 2000 and 2010: a systematic review and analysis. Lancet 2013; 382:1329–1340. [DOI] [PubMed] [Google Scholar]
- 2.Aboyans V, Criqui MH, Abraham P, et al. Measurement and interpretation of the ankle-brachial index: a scientific statement from the American Heart Association. Circulation 2012; 126:2890–2909. [DOI] [PubMed] [Google Scholar]
- 3.Chaudru S, de Mullenheim PY, Le Faucheur A, et al. Training to perform ankle-brachial index: systematic review and perspectives to improve teaching and learning. Eur J Vasc Endovasc Surg 2016; 51:240–247. [DOI] [PubMed] [Google Scholar]
- 4.Rooke TW, Hirsch AT, Misra S, et al. Management of patients with peripheral artery disease (compilation of 2005 and 2011 ACCF/AHA Guideline Recommendations): a report of the American College of Cardiology Foundation/American Heart Association Task Force on Practice Guidelines. J Am Coll Cardiol 2013; 61:1555–1570. [DOI] [PMC free article] [PubMed] [Google Scholar]
- 5.Hirsch AT, Haskal ZJ, Hertzer NR, et al. ACC/AHA 2005 Practice Guidelines for the management of patients with peripheral arterial disease (lower extremity, renal, mesenteric, and abdominal aortic): a collaborative report from the American Association for Vascular Surgery/Society for Vascular Surgery, Society for Cardiovascular Angiography and Interventions, Society for Vascular Medicine and Biology, Society of Interventional Radiology, and the ACC/AHA Task Force on Practice Guidelines (Writing Committee to Develop Guidelines for the Management of Patients With Peripheral Arterial Disease): endorsed by the American Association of Cardiovascular and Pulmonary Rehabilitation; National Heart, Lung, and Blood Institute; Society for Vascular Nursing; TransAtlantic Inter-Society Consensus; and Vascular Disease Foundation. Circulation 2006; 113:e463–e654. [DOI] [PubMed] [Google Scholar]
- 6.Abraham P, Picquet J, Bouye P, et al. Transcutaneous oxygen pressure measurements (tcpO2) at ankle during exercise in arterial claudication. Int Angiol 2005; 24:80–88. [PubMed] [Google Scholar]
- 7.Abraham P, Picquet J, Vielle B, et al. Transcutaneous oxygen pressure measurements on the buttocks during exercise to detect proximal arterial ischemia: comparison with arteriography. Circulation 2003; 107:1896–1900. [DOI] [PubMed] [Google Scholar]
- 8.Liu O, Li JR, Gong M, et al. Genetic analysis of six SNPs in candidate genes associated with high cross-race risk of development of thoracic aortic aneurysms and dissections in Chinese Han population. Acta Pharmacol Sin 2010; 31:1376–1380. [DOI] [PMC free article] [PubMed] [Google Scholar]
- 9.Mahe G, Kaladji A, Le Faucheur A, et al. Internal iliac artery stenosis: diagnosis and how to manage it in 2015. Front Cardiovasc Med 2015; 2:33. [DOI] [PMC free article] [PubMed] [Google Scholar]
- 10.Mahe G, Kalra M, Abraham P, et al. Application of exercise transcutaneous oxygen pressure measurements for detection of proximal lower extremity arterial disease: a case report. Vasc Med 2015; 20:251–255. [DOI] [PubMed] [Google Scholar]
- 11.Hanley JA, McNeil BJ. The meaning and use of the area under a receiver operating characteristic (ROC) curve. Radiology 1982; 143:29–36. [DOI] [PubMed] [Google Scholar]
- 12.Bouye P, Jacquinandi V, Picquet J, et al. Near-infrared spectroscopy and transcutaneous oxygen pressure during exercise to detect arterial ischemia at the buttock level: comparison with arteriography. J Vasc Surg 2005; 41:994–999. [DOI] [PubMed] [Google Scholar]
- 13.Sugano N, Inoue Y, Iwai T. Evaluation of buttock claudication with hypogastric artery stump pressure measurement and near infrared spectroscopy after abdominal aortic aneurysm repair. Eur J Vasc Endovasc Surg 2003; 26:45–51. [DOI] [PubMed] [Google Scholar]
- 14.Mahe G, Kaladji A, Le Faucheur A, et al. Internal iliac artery disease management: still absent in the update to TASC II (Inter-Society Consensus for the Management of Peripheral Arterial Disease). J Endovasc Ther 2016; 23:233–234. [DOI] [PubMed] [Google Scholar]
- 15.Gernigon M, Marchand J, Ouedraogo N, et al. Proximal ischemia is a frequent cause of exercise-induced pain in patients with a normal ankle to brachial index at rest. Pain Physician 2013; 16:57–64. [PubMed] [Google Scholar]
- 16.de Smet AA, Ermers EJ, Kitslaar PJ. Duplex velocity characteristics of aortoiliac stenoses. J Vasc Surg 1996; 23:628–636. [DOI] [PubMed] [Google Scholar]
- 17.Ouedraogo N, Barbeau C, Legrand M, et al. “Routine” arterial echo-Doppler is not sufficient to exclude an arterial origin of exercise-induced proximal lower limb pain. Int J Cardiol 2013; 167:1053–1054. [DOI] [PubMed] [Google Scholar]
- 18.Mahe G, Pollak AW, Liedl DA, et al. Discordant diagnosis of lower extremity peripheral artery disease using American Heart Association Postexercise Guidelines. Medicine 2015; 94:e1277. [DOI] [PMC free article] [PubMed] [Google Scholar]
- 19.Bouye P, Picquet J, Jaquinandi V, et al. Reproducibility of proximal and distal transcutaneous oxygen pressure measurements during exercise in stage 2 arterial claudication. Int Angiol 2004; 23:114–121. [PubMed] [Google Scholar]
- 20.Mahe G, Ouedraogo N, Leftheriotis G, et al. Exercise treadmill testing in patients with claudication, with and without diabetes. Diabet Med 2011; 28:356–362. [DOI] [PubMed] [Google Scholar]