Abstract
Pregnancies complicated by gestational diabetes mellitus (GDM) are associated with increased risks of adverse maternal and fetal outcomes. The risks of adverse pregnancy outcomes differ depending on the glucose values among GDM patients. For accurate and effective prenatal counseling, it is necessary to understand the relationship between different maternal hyperglycemia values and the severity of adverse outcomes. With this objective, this study reexamines the relationship between maternal hyperglycemia versus maternal and perinatal outcomes in GDM patients. For this study, maternal hyperglycemia was diagnosed using the 2-step diagnostic approach.
Medical records of 3434 pregnant women, who received the 50-g glucose challenge test (GCT) between March 2001 and April 2013, were reviewed. As a result, 307 patients were diagnosed with GDM, and they were divided into 2 groups according to their fasting glucose levels. A total of 171 patients had normal fasting glucose level (<95 mg/dL), and 136 patients had abnormal fasting glucose level (≥95 mg/dL). The 50-g GCT results were subdivided by 20-unit increments (140–159, n = 123; 160–179, n = 84; 180–199, n = 50; and ≥200, n = 50), and the maternal and perinatal outcomes were compared against the normal 50-g GCT group (n = 307).
Maternal fasting blood glucose (FBG) level showed clear association with adverse perinatal outcomes. The odds ratio (OR) of macrosomia was 6.72 (95% CI: 2.59–17.49, P < 0.001) between the 2 groups. The ORs of large for gestational age (LGA) and neonatal hypoglycemia were 3.75 (95% CI: 1.97–7.12, P < 0.001) and 1.65 (95% CI: 0.79–3.43, P = 0.183), respectively. Also, the results of the 50-g GCT for each category showed strong association with increased risks of adverse perinatal outcomes compared to the normal 50-g GCT group. The OR of macrosomia (up to 20.31-fold), LGA (up to 6.15-fold), and neonatal hypoglycemia (up to 84.00-fold) increased with increasing 50-g GCT result.
Keywords: fasting blood glucose, gestational diabetes mellitus, 50-g glucose challenge test, oral glucose tolerance test, perinatal outcomes
1. Introduction
Gestational diabetes mellitus (GDM) is defined as glucose intolerance 1st recognized during pregnancy with a prevalence of 2% to 14% in all pregnant women.[1] GDM is associated with maternal, fetal, and neonatal adverse outcomes such as cesarean delivery, preeclampsia, shoulder dystocia, macrosomia, neonatal hypoglycemia, and perinatal death. Although yet to be proven, screening and treating GDM may contribute to prevent adverse outcomes.[2]
The most commonly used screening and diagnostic methods of GDM are flawed because they give relatively poor negative and positive predictive values. The 2-step diagnosis method, the 1-hour 50-g glucose challenge test (GCT), and the 3-hour 100-g oral glucose tolerance test (OGTT) are currently used in the United States, and the single-step 2-hour 75-g OGTT is used in European countries.[3,4] In Korea, the 2-step diagnosis approach has been used predominantly as in the United States, but several hospitals have adopted new guidelines for the diagnosis of GDM.
It is also necessary to change the current counseling and treatment approaches for GDM patients because perinatal outcomes tend to differ according to glucose levels. Previous studies have shown that rates of adverse outcomes increased with increasing GCT subgroups.[5] Patients with 50-g GCT within 140 to 199 mg/dL had 2.5-fold increasing risk of large for gestational age (LGA) and 2.9-fold increasing risk of macrosomia. Langer et al[6] demonstrated that every 10 mg/dL increment in fasting blood glucose (FBG) resulted in 15% increase in adverse composite outcomes.
The purpose of this study is to evaluate the association between perinatal outcomes and 50-g GCT values as well as FBG among GDM women.
2. Methods
A retrospective analysis of 3434 pregnant women who had 50-g GCT was carried out between March 2001 and April 2013 at Severance Hospital, Seoul, Korea. The approval was obtained from the Institutional Review Board of Yonsei University Health System. Informed consent was not required given the retrospective nature of the study.
Women with fetal anomalies, multiple gestations, overt diabetes mellitus (DM), and hypertension were excluded from the study. A total of 2631 pregnant women received the normal 50-g GCT and 803 received the100-g OGTT because their 50-g GCT value was greater than 140 mg/dL. As a result, 307 patients were diagnosed with GDM (GDM group) and 496 showed false-positive result (impaired glucose tolerance group).
A false-positive result was defined as showing positive in the 1-hour 50-g GCT but negative in the 3-hour 100-g OGTT. The Carpenter and Coustan criteria were used to diagnose GDM. GDM was defined as showing 2 or more abnormal duration (hours) of 100-g OGTT values: FBG of 95 mg/dL or more; 180 mg/dL or more for 1-hour; 155 mg/dL or more for 2-hours; and 140 mg/dL or more for 3-hours. GDM patients were divided into 2 groups according to their FBG. A total of 171 patients had normal FBG (<95 mg/dL) and 136 patients had abnormal FBG (≥95 mg/dL) (Fig. 1). The 1-hour 50-g GCT result was also divided into 20-unit increments, and these subgroups were used to evaluate maternal and perinatal outcomes. A total of 307 pregnant women (the same number as GDM patients) were randomly selected from the normal 1-hour 50-g GCT group (n = 2631) to be the control. The risks of adverse maternal and perinatal outcomes for subgroups of the GDM group were then analyzed and compared against the control group.
Figure 1.
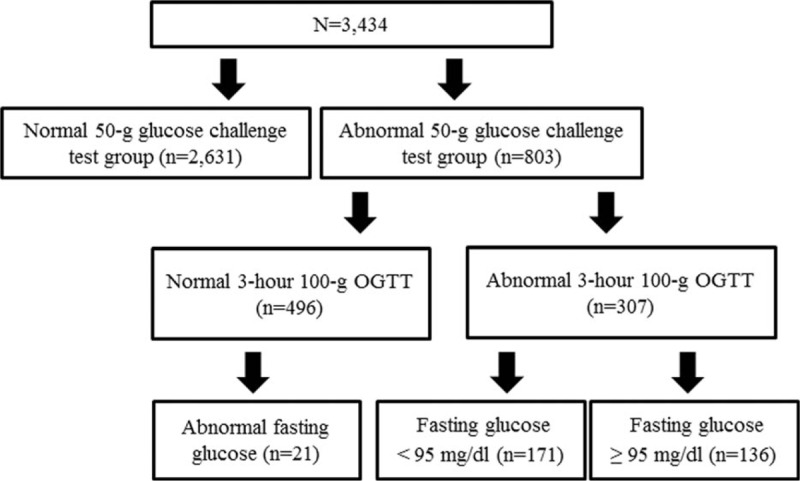
Distribution of the study population. OGTT = oral glucose tolerance test.
Maternal composite adverse outcomes included cesarean delivery and preeclampsia, while fetal composite adverse outcomes included LGA, APGAR score, intensive care unit admission, neonatal hypoglycemia, and hyperbilirubinemia. Preeclampsia was diagnosed according to the criteria of the ACOG Practice Bulletin: new onset of blood pressure of 140/90 mm Hg or more on 2 separate readings taken 6 hours apart after 20 gestational weeks; and proteinuria of 300 mg/24 hours or more. LGA was defined as birth weight greater than the 90th percentile compared with gestational age. Neonatal hypoglycemia was defined as blood glucose level of less than 40 mg/dL, and hyperbilirubinemia was defined as bilirubin level of more than 5 mg/dL.
For statistical processing, the Chi-square test or Fisher exact test was used for categorical variables and the 2-sample t test or the Wilcoxon rank sum test was used for continuous variables. Multiple logistic regression analysis was performed to estimate the odds ratios (ORs) of adverse outcomes with adjustment for confounders. Statistical analysis was performed using SAS version 9.2 (SAS Institute, Inc., Cary, NC) and statistical significance was considered for P-values <0.05.
3. Results
Based on the results of the 50-g GCT, the clinical characteristics and perinatal outcomes of the impaired glucose tolerance (IGT) group and the GDM group (Table 1) were compared. Significant differences were observed between the 2 groups in terms of their maternal age, body mass index (BMI) before pregnancy and at delivery, and family history of DM. For perinatal outcomes, the GDM group showed higher incidence of cesarean delivery, macrosomia, LGA, and neonatal hypoglycemia.
Table 1.
Comparison of characteristics of IGT and GDM groups.
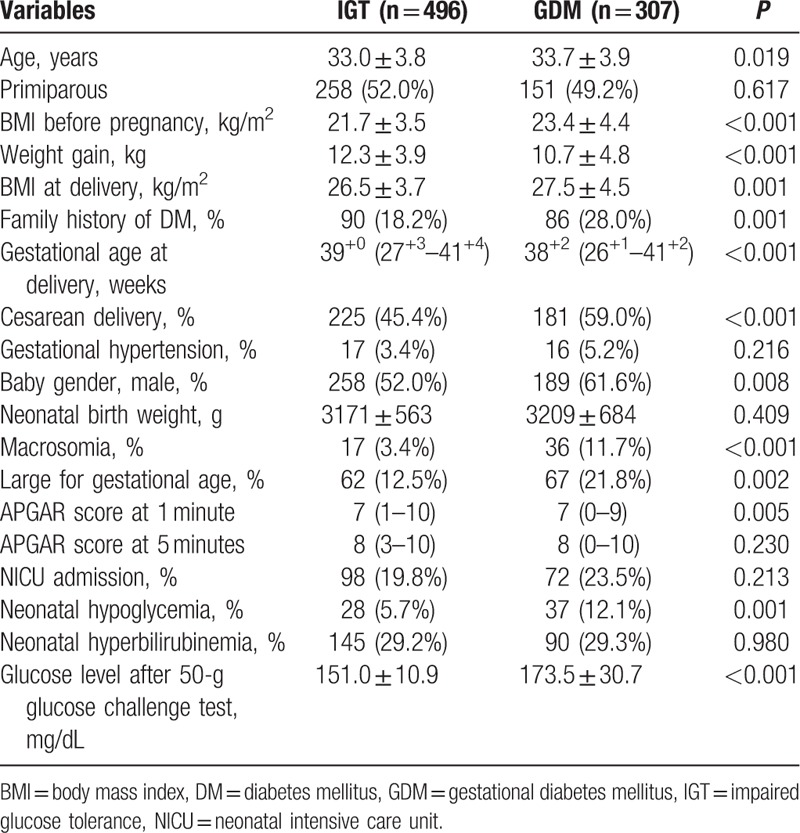
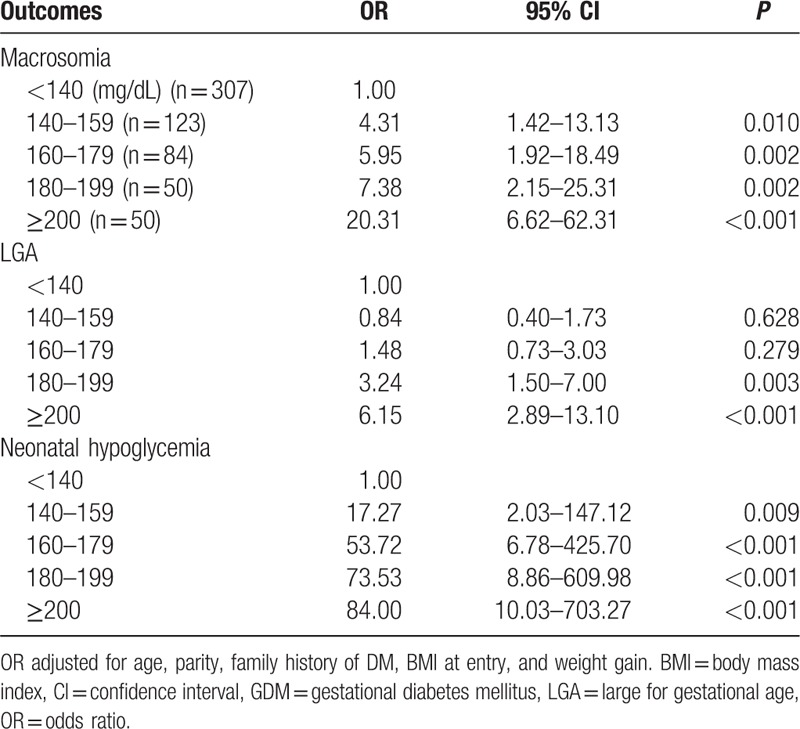
Among GDM patients, maternal characteristics and perinatal outcomes are presented according to FBG (Table 2). Study findings show statistical significance in BMI before pregnancy and at delivery, rate of cesarean section, prevalence of gestational hypertension, gestational insulin therapy, and HbA1c at diagnosis. Incidence of macrosomic newborn (3.5% for normal glycemic vs 22.1% hyperglycemic group, P < 0.001) and LGA newborn (10.5% for normal glycemic vs 36.0% hyperglycemic group, P < 0.001) was higher in the fasting hyperglycemic group, meeting the Carpenter and Coustan criteria. Moreover, the prevalence of neonatal hypoglycemia was 9.4%, and 15.4% in the normal glycemic and hyperglycemic groups, respectively (P < 0.001). To compare perinatal outcomes between the 2 groups, the odds ratio was calculated after controlling for confounding factors (Table 3). Fasting hyperglycemia showed strong association with adverse perinatal outcomes. The odds ratio for perinatal outcomes was 6.72 (95% CI: 2.59–17.49, P < 0.001) with macrosomia, 3.75 (95% CI: 1.97–7.12, P < 0.001) with LGA, and 1.65 (95% CI: 0.79–3.43, P = 0.183) with neonatal hypoglycemia. The maternal and perinatal outcomes of pregnant women with 50-g GCT result of over 140 mg/dL were further stratified into 20-unit increments (Table 4). The findings showed significant differences in BMI before pregnancy and at delivery, incidence of gestational hypertension and gestational insulin therapy, HbA1c at diagnosis of GDM, macrosomia, LGA, and neonatal hypoglycemia. The 50-g GCT results were categorized and the perinatal outcomes were compared with 50-g GCT normal group after adjusting for confounders (Table 5). Increased 50-g GCT values in subgroups showed relevance with higher risk of perinatal outcomes. The ORs of macrosomia (up to 20.31-fold), LGA (up to 6.15-fold), and neonatal hypoglycemia (up to 84.00-fold) were higher in subgroups with higher 50-g GCT values. Among GDM patients, the group with 50-g GCT level of 140 to 159 mg/dL was found to be associated with macrosomia (OR: 4.31, 95% CI: 1.42–13.13, P = 0.010) and neonatal hypoglycemia (OR: 17.27, 95% CI: 2.03–147.12, P = 0.009) when compared against the normal group. However, LGA (OR: 0.84, 95% CI: 0.40–1.73, P = 0.628) did not show statistical significance. The subgroup in the 160 to 179 mg/dL range showed significant OR for macrosomia (OR: 5.95, 95% CI: 1.92–18.49, P = 0.002) and neonatal hypoglycemia (OR: 53.72, 95% CI: 6.78–425.70, P < 0.001). LGA (OR: 1.48, 95% CI: 0.73–3.03, P = 0.279) showed the tendency to increase but there was no statistical significance. Also, the subgroups in the 180 to 199 mg/dL and the ≥200 mg/dL ranges showed a strong association with all adverse perinatal outcomes. Therefore, risks of adverse perinatal outcomes increased as the values of 50-g GCT results increased.
Table 2.
Maternal characteristics and perinatal outcomes according to fasting glucose values in GDM patients.
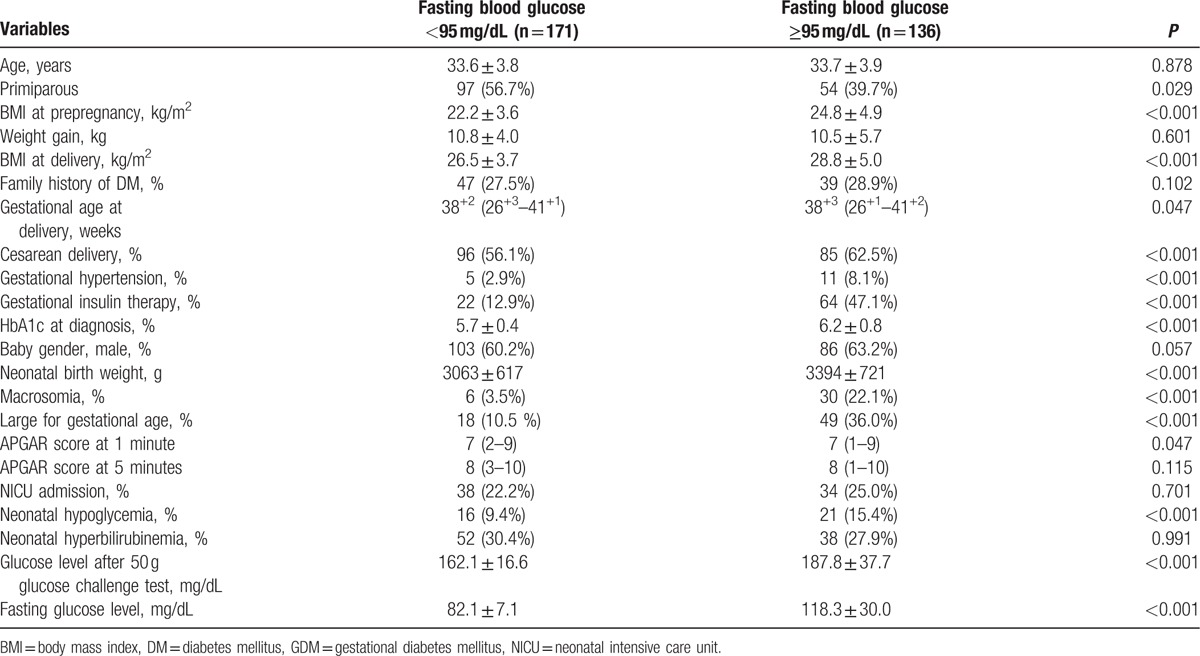
Table 3.
OR of perinatal outcomes for fasting glucose level ≥95 mg/dL in GDM group.

Table 4.
Maternal and perinatal outcomes according to 50-g glucose challenge test in GDM patients.
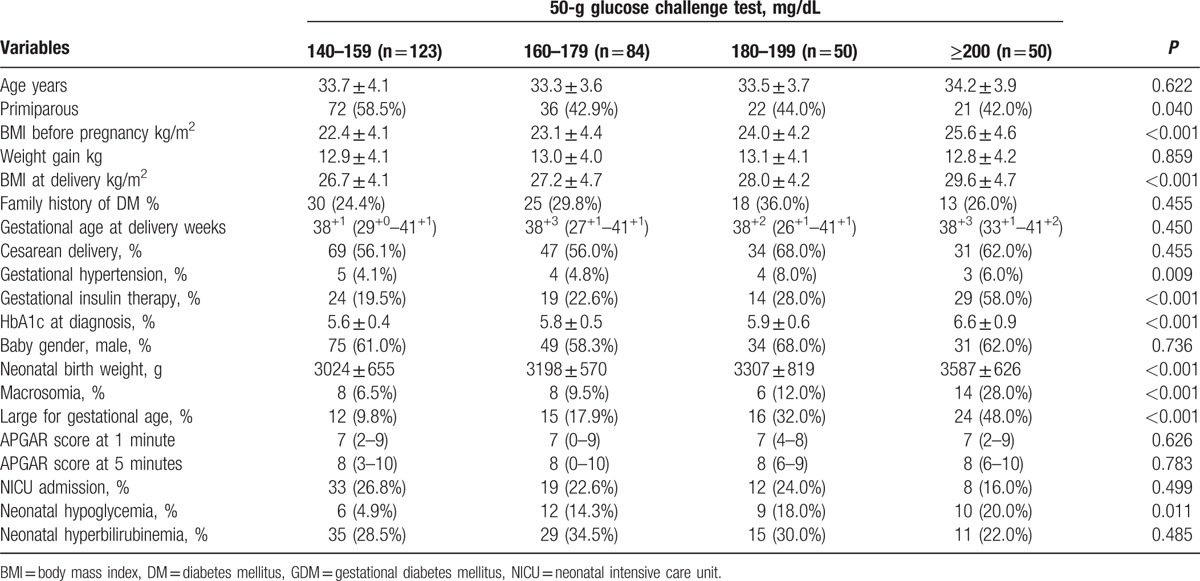
Table 5.
OR of perinatal outcomes according to 50-g glucose challenge test values in GDM patients.
4. Discussion
This study investigated the maternal and perinatal outcomes according to FBG and 50-g GCT values in GDM pregnant women. The risks of macrosomia, LGA, and neonatal hypoglycemia increased with fasting hyperglycemia and higher 50-g GCT values. Study findings also showed that the association between fasting hyperglycemia and adverse perinatal outcomes remain to be significant after adjustment for potential confounders.
Previous studies have found that postprandial hyperglycemia was associated with excessive fetal growth in GDM patients requiring insulin therapy or pregestational diabetes patients.[7,8] Other studies have indicated that meal-related glucose threshold measurement did not increase the risk of adverse fetal outcomes.[9] Recently, other researches have demonstrated significant association between fasting and 1-hour 75-g OGTT glucose values with LGA newborns among GDM women. It has been reported that strict glucose control in this risk group may be necessary in order to avoid LGA newborns.[10]
It has been emphasized in many studies that FBG is an important factor in GDM screening as well as in predicting neonatal adverse outcomes. Herrera et al[11] investigated the importance of FBG in screening for GDM. GDM women with an isolated abnormal FBG were more likely to need hypoglycemic agents to obtain good glycemic control. The significance and magnitude of this association was consistent with the results of this study. In the abnormal FBG group, 47.1% (64/136) of GDM patients needed gestational insulin therapy to control the blood glucose but in the normal FBG group (P < 0.001), only 12.9% (22/171) of pregnant women who were diagnosed with GDM required insulin treatment.
The HAPO studies[12,13] have demonstrated the continuously increasing relationship between maternal blood glucose levels and adverse perinatal outcomes such as frequency of LGA, neonatal hypoglycemia, cord blood serum C-peptide level above the 90th percentile, and primary cesarean section delivery. However, these studies are based on the single step 75-g OGTT, and GDM was diagnosed using the International Association of Diabetes and Pregnancy Study Groups (IADPSG) criteria. In the HAPO studies, the outcomes were compared after categorizing fasting, 1-hour, and 2-hour glucose values. In contrast, this study is based on the 2-step diagnosis of GDM, and the outcomes of the 50-g GCT values and the FBG of 100-g OGTT were compared against each other. The outcomes found in this study give a more accurate picture of the situation in Korea, where the 2-step diagnosis is predominantly used. In addition, without adjusting for confounding factors, such as prepregnancy BMI and gestational weight gain, adverse outcome risks may have been overestimated in other earlier studies. However, in this study, the relation between maternal hyperglycemia and adverse perinatal outcomes were analyzed after adjusting for BMI before pregnancy and gestational weight gain, because BMI is also related to maternal and perinatal outcomes in GDM patients.
FBG has been used as the most important indicator for the diagnosis of DM in nonpregnant adults because it reflects impaired insulin secretion and resistance.[14,15] FBG values tend to stay constant throughout the entire period of pregnancy and this is also true for nonpregnant patients. FBG values have less individual variation compared to other glucose values; therefore, abnormal FBG level is a significant indicator in diagnosing GDM. At present, FBG is a good screening test for GDM with advantages such as simple procedure, reasonable cost, reproducibility, easy access, and wide acceptance.[15] Recently, other studies have reported that abnormal FBG alone is capable of detecting 50% of pregnant women with GDM from a pool of women who had already been diagnosed with GDM with another screening method. If combined with the 2-hour plasma glucose level, another 25% of pregnant women with GDM can be detected.[16] In 2016, Park et al[17] developed a more practical and efficient screening tool using FBG and prepregnancy BMI for predicting adverse outcomes of GDM. This new screening tool focused on predicting the maternal and perinatal adverse outcomes of GDM patients.
The findings of this study show that BMI before pregnancy, BMI at delivery, HbA1c value at diagnosis, and the application of gestational insulin therapy were much higher in the abnormal FBG group. Several studies have indicated that maternal prepregnancy BMI was associated with the risk of GDM. Sacks et al[18] confirmed that maternal BMI had a powerful impact upon fetal birth weight. Therefore, GDM patients with both higher BMI and abnormal FBG values can have potentially worse perinatal outcomes. This study also showed that abnormal FBG values according to the Carpenter and Coustan criteria had significance association with higher incidence of LGA, macrosomia, and neonatal hypoglycemia.
In addition, adverse perinatal outcomes according to different 50-g GCT values among GDM patients were evaluated in this study. The risks of macrosomia, LGA, and neonatal hypoglycemia increased with increasing 50-g GCT values. Several studies have examined the relationship of 50-g GCT and perinatal outcomes. In 1987, Leikin et al[19] reported that the false-positive GCT group (GCT values of 135 mg/dL or more but normal OGTT values) had higher incidence of macrosomia compared with the normal GCT group (11.9% vs 6.4%, P = 0.009). Recently, other retrospective cohort studies also showed that false-positive GCT is an independent risk factor for adverse perinatal outcomes (OR: 5.96, 95% CI: 1.3–10.3).[20] The findings of this study suggest that the risks of the macrosomia (up to 20.31-fold), LGA (up to 6.15-fold), and neonatal hypoglycemia (up to 84.00-fold) increased with higher 50-g GCT values. More importantly, 50-g GCT values in the range of 140 to 159 mg/dL were not associated with LGA compared to the normal 50-g GCT group. The OR for neonatal hypoglycemia was exceptionally high. These results should be interpreted with caution since confidence intervals were very wide due to a limited number of cases in the 50-g GCT normal group.
In 2013, Figueroa et al[5] evaluated the relationship between 50-g GCT values and perinatal outcomes in mild GDM patients, and showed that GCT values of 140 mg/dL or more were associated with an increase of composite perinatal outcomes, LGA, and macrosomia. However, there was no evaluation for the group with GCT value of 200 mg/dL or more. They only included mild GDM group with fasting glucose value less than 95 mg/dL. The strength of this study is that a full spectrum of GDM patients were examined using the Carpenter and Coustan criteria, including the group with 50-g GCT higher than 200 mg/dL. Therefore, it was possible to evaluate the continuous 50-g GCT values in the lower or upper ranges. This study also included normal and abnormal fasting glucose groups and the abnormal FBG group tended to have a greater risk for adverse perinatal outcomes.
The limitation of this study is that it is a retrospective study. A randomized clinical trial of a larger scale, using prospectively collected data from a well-characterized trial cohort, is ideal and necessary to validate the findings of this study. The influence of GDM management on perinatal outcomes was not considered in this study. All GDM women were treated to achieve the recommended value of their glycemic profiles and 28.0% (86/307) of the pregnant women with GDM needed insulin therapy. Even without the influence of GDM management, maternal hyperglycemia was still associated with adverse perinatal outcomes. In addition, long-term health complications such as childhood obesity, impaired insulin sensitivity, or type 2 diabetes mellitus were not considered for in this study.[21]
In conclusion, fasting hyperglycemia is a strong predictor for poor perinatal outcomes in GDM patients. Also, composite perinatal outcomes such as macrosomia, LGA, and neonatal hypoglycemia are more frequent with increasing 50-g GCT values. Therefore, more attention and care should be given during prenatal counseling, as well as more active therapeutic intervention taken when necessary with closer fetal monitoring, with the objective to reduce adverse perinatal outcomes in GDM patients with abnormal FBG or high 50-g GCT values.
Footnotes
Abbreviations: BMI = body mass index, FBG = fasting blood glucose, GCT = glucose challenge test, GDM = gestational diabetes mellitus, LGA = large for gestational age, OGTT = oral glucose tolerance test.
The authors have no funding and conflicts of interest to disclose.
References
- 1.ACOG Practice Bulletin. Clinical management guidelines for obstetrician-gynecologists. Number 30, September 2001 (replaces Technical Bulletin Number 200, December 1994). Gestational diabetes. Obstet Gynecol 2001; 98:525–538. [PubMed] [Google Scholar]
- 2.Brody SC, Harris R, Lohr K. Screening for gestational diabetes: a summary of the evidence for the U.S. Preventive Services Task Force. Obstet Gynecol 2003; 101:380–392. [DOI] [PubMed] [Google Scholar]
- 3.The Guideline Development Group. Management of diabetes from preconception to the postnatal period: summary of NICE guidance. BMJ 2008; 336:714–717. [DOI] [PMC free article] [PubMed] [Google Scholar]
- 4.Kautzky-Willer A, Bancher-Todesca D, Birnbacher R. [Gestational diabetes mellitus]. Acta Med Austriaca 2004; 31:182–184. [PubMed] [Google Scholar]
- 5.Figueroa D, Landon MB, Mele L, et al. Relationship between 1-hour glucose challenge test results and perinatal outcomes. Obstet Gynecol 2013; 121:1241–1247. [DOI] [PMC free article] [PubMed] [Google Scholar]
- 6.Langer O, Yogev Y, Most O, et al. Gestational diabetes: the consequences of not treating. Am J Obstet Gynecol 2005; 192:989–997. [DOI] [PubMed] [Google Scholar]
- 7.Jovanovic-Peterson L, Peterson CM, Reed GF, et al. Maternal postprandial glucose levels and infant birth weight: the Diabetes in Early Pregnancy Study. The National Institute of Child Health and Human Development–Diabetes in Early Pregnancy Study. Am J Obstet Gynecol 1991; 164:103–111. [DOI] [PubMed] [Google Scholar]
- 8.de Veciana M, Major CA, Morgan MA, et al. Postprandial versus preprandial blood glucose monitoring in women with gestational diabetes mellitus requiring insulin therapy. N Engl J Med 1995; 333:1237–1241. [DOI] [PubMed] [Google Scholar]
- 9.Most O, Langer O. GDM women in good glycemic control: which meal-related measure enhances fetal well-being? J Perinat Med 2007; 35:481–485. [DOI] [PubMed] [Google Scholar]
- 10.Brankica K, Valentina VN, Slagjana SK, et al. Maternal 75-g OGTT glucose levels as predictive factors for large-for-gestational age newborns in women with gestational diabetes mellitus. Arch Endocrinol Metab 2016; 60:36–41. [DOI] [PMC free article] [PubMed] [Google Scholar]
- 11.Herrera K, Brustman L, Foroutan J, et al. The importance of fasting blood glucose in screening for gestational diabetes. J Matern Fetal Neonatal Med 2015; 28:825–828. [DOI] [PubMed] [Google Scholar]
- 12.Metzger BE, Lowe LP, Dyer AR, et al. Hyperglycemia and adverse pregnancy outcomes. N Engl J Med 2008; 358:1991–2002. [DOI] [PubMed] [Google Scholar]
- 13.The HAPO Study Cooperative Research Group. Hyperglycemia and Adverse Pregnancy Outcome (HAPO) Study: associations with neonatal anthropometrics. Diabetes 2009; 58:453–459. [DOI] [PMC free article] [PubMed] [Google Scholar]
- 14.Report of the expert committee on the diagnosis and classification of diabetes mellitus. Diabetes Care 1997; 20:1183–1197. [DOI] [PubMed] [Google Scholar]
- 15.Reichelt AJ, Spichler ER, Branchtein L, et al. Fasting plasma glucose is a useful test for the detection of gestational diabetes. Brazilian Study of Gestational Diabetes (EBDG) Working Group. Diabetes Care 1998; 21:1246–1249. [DOI] [PubMed] [Google Scholar]
- 16.Zawiejska A, Wender-Ozegowska E, Radzicka S, et al. Maternal hyperglycemia according to IADPSG criteria as a predictor of perinatal complications in women with gestational diabetes: a retrospective observational study. J Matern Fetal Neonatal Med 2014; 27:1526–1530. [DOI] [PubMed] [Google Scholar]
- 17.Park JS, Kim DW, Kwon JY, et al. Development of a screening tool for predicting adverse outcomes of gestational diabetes mellitus: a retrospective cohort study. Medicine (Baltimore) 2016; 95:e2204. [DOI] [PMC free article] [PubMed] [Google Scholar]
- 18.Sacks DA, Chen W, Wolde-Tsadik G, et al. Fasting plasma glucose test at the first prenatal visit as a screen for gestational diabetes. Obstet Gynecol 2003; 101:1197–1203. [DOI] [PubMed] [Google Scholar]
- 19.Leikin EL, Jenkins JH, Pomerantz GA, et al. Abnormal glucose screening tests in pregnancy: a risk factor for fetal macrosomia. Obstet Gynecol 1987; 69:570–573. [PubMed] [Google Scholar]
- 20.Stamilio DM, Olsen T, Ratcliffe S, et al. False-positive 1-hour glucose challenge test and adverse perinatal outcomes. Obstet Gynecol 2004; 103:148–156. [DOI] [PubMed] [Google Scholar]
- 21.Whitaker RC. Predicting preschooler obesity at birth: the role of maternal obesity in early pregnancy. Pediatrics 2004; 114:e29–e36. [DOI] [PubMed] [Google Scholar]


