Supplemental Digital Content is available in the text
Keywords: cardiovascular disease, central obesity, elderly, metabolic syndrome, principal component analysis, type 2 diabetes
Abstract
The prognostic value of the metabolic syndrome (MetS) is believed to vary with age. With an elderly population expecting to triple by 2060, it is important to evaluate the validity of MetS in this age group. We examined the association of MetS risk factors with later risk of type 2 diabetes (T2DM) and cardiovascular disease (CVD) in elderly Caucasian women. We further investigated if stratification of individuals not defined with MetS would add predictive power in defining future disease prevalence of individuals with MetS.
The Prospective Epidemiological Risk Factor Study, a community-based cohort study, followed 3905 Danish women since 2000 (age: 70.1 ± 6.5) with no previous diagnosis of T2DM or CVD, holding all measurements used for MetS definition; central obesity, hypertension, hyperlipidemia, and hyperglycemia combined with register-based follow-up information.
Elderly women with defined MetS presented a 6.3-fold increased risk of T2DM (95% confidence interval: [3.74–10.50]) and 1.7-fold increased risk of CVD (1.44–2.05) compared to women with no MetS risk factors. Subdividing the control group without defined MetS revealed that both centrally obese controls and controls holding other MetS risk factors also had increased risk of T2DM (hazard ratio (HR) = 2.21 [1.25–3.93] and HR = 1.75 [1.04–2.96]) and CVD (HR = 1.51 [1.25–1.83] and HR = 1.36 [1.15–1.60]) when compared to controls with no MetS risk factors.
MetS in elderly Caucasian women increased risk of future T2DM and CVD. While not defined with MetS, women holding only some risk factors for MetS were also at increased risk of T2DM or CVD compared to women with no MetS risk factors.
1. Introduction
The risk of developing type 2 diabetes mellitus (T2DM) and cardiovascular disease (CVD) increases with age,[1–3] and with a generally aging population,[4] definite measures of disease risk in elderly individuals are necessary. Such strategy would facilitate timely preventive approaches to reduce the disease burden, as well as medical costs in an aging population.[5,6] Metabolic syndrome (MetS) is widely used as a measure to predict the future risk of T2DM[7,8] and CVD,[9,10] and is founded on five metabolic risk markers: central obesity, elevated blood pressure (BP), dyslipidemia (involving both elevated serum triglycerides and lowered high-density lipoprotein (HDL) cholesterol), and elevated fasting glucose.[11,12] Insulin resistance, commonly believed to be originating from central obesity,[13] is considered the cornerstone in risk profiles describing both T2DM and CVD,[14] and central obesity has, therefore, with the 2005 International Diabetes Federation (IDF) definition, been set as the “entrance criteria” in defining MetS.[15,16] Many studies have described the association between MetS-based risk factors and subsequent disease risk; however, most studies are conducted on middle-aged populations.[10,17–19] There is, a need for studies on how the current MetS definition associates to disease risk specifically in elderly individuals. This study aimed to investigate the predictive value of MetS in relation to future risk of T2DM and CVD in a cohort of elderly Caucasian women by applying the MetS definition set by the IDF. This investigation would allow for an assessment of whether the MetS-based assessment criterion remains valid in the estimation of future increased risk of T2DM and CVD development also in an older population.
All present studies within the field of MetS report the risk estimate based on the use of a defined MetS-group compared to a reference group not defined with the syndrome. When applying this dichotomized definition, it is likely that the reference group will be heterogeneous and contain individuals who display variable metabolic profiles. Such reference group heterogeneity would be based on the inclusion of individuals who, while not meeting the central obesity entrance criterion, might still hold many other MetS risk factors, such as hypertension, dyslipidemia (elevated serum triglycerides and lowered HDL cholesterol), and hyperglycemia. We here hypothesized that a heterogeneous metabolic state of the reference group could potentially influence the syndrome's predictive power of disease. To test the influence of the reference group, we separated our study control group into three reference subgroups: centrally obese controls not defined with MetS, controls with no central obesity but other MetS risk factors, and controls with no MetS risk factors, and used principal component analysis (PCA) to visualize the differences between the MetS group and these reference subgroups. We further investigated whether the syndrome's predictive power of T2DM and CVD would increase when stratifying the reference group into the three subgroups of varying risk character. Finally, we also explored the disease risk profile of T2DM and CVD based solely on cumulating numbers of MetS risk factors.
2. Methods
2.1. Study population
The Prospective Epidemiological Risk Factor (PERF) study is an observational, prospective study of elderly Danish women (n = 5855) conducted in 1999 to 2001. The cohort consists of postmenopausal women who either had previously participated in clinical randomized placebo-controlled studies or were screened without being randomized for previous studies at the Center for Clinical and Basic Research (CCBR) in Copenhagen or Aalborg, Denmark. Prior studies run at CCBR, which ultimately lead to the study population in PERF, mainly focused on age-related diseases such as osteoporosis and osteoarthritis, and both screen failures and enrolled participants from these studies (n = 8875) were invited and included on equal terms in the PERF study. The study was carried out in accordance with ICH-GCP with study protocol approval from the local ethics committees; The Research Ethics Committee of Copenhagen County and the Research Ethics Committee of Viborg and North Jutland Counties, Denmark (approval reference: KA 99070gm). Written informed consent was obtained from all participants.
Baseline examination comprised a physical examination including a full-body dual-energy X-ray absorptiometry (DEXA) scan, blood sampling, and a self-reported questionnaire compiling information on smoking habits, alcohol intake, medical history, menopause age, physical activity level, and educational level.
2.2. Definition of the metabolic syndrome
MetS was defined using a modified version of the definition set by IDF.[15] Waist circumference was not directly measured in PERF, and therefore the definition of central obesity was based on a calculated central/peripheral fat mass ratio (C/P ratio) determined by DEXA scan. Central fat mass was defined as fat located at the torso and peripheral fat mass defined as fat located on arms, legs, and head as determined by DEXA scan. The cohort was divided into quartiles based on the C/P ratio, and only subjects in the fourth quartile were defined as centrally obese in the analysis. All subjects in this quartile had a C/P ratio >1.
The MetS inclusion criteria were defined as a C/P ratio >1 or a body mass index (BMI) >30 kg/m2, and 2 or more of the following risk factors: increased triglycerides (>1.7 mmol/L), decreased HDL cholesterol (<1.29 mmol/L), increased fasting plasma glucose (>5.6 mmol/L), and increased BP (systolic >130 mm Hg or diastolic >85 mm Hg or treatment of previously diagnosed hypertension).
The IDF criteria state that treatment for lipid abnormalities specifically targeting HDL cholesterol or triglycerides can be used as defining the risk factor, rather than the actual serum value itself. However, as specified hyperlipidemia treatment was not part of the questionnaire, we were not able to determine the specific lipid-lowering treatments; therefore, only the serum measurements for these 2 variables were part of the MetS-defining criteria of dyslipidemia in this study.
2.3. Study endpoints
The study endpoints were a T2DM diagnosis or a CVD event occurring after participation in PERF. Follow-up information on T2DM and CVD diagnosis was retrieved from The National Danish Diabetes Registry and The National Danish Patient Registry, respectively, using a unique personal identification number for each subject. Classification of CVD diagnoses was completed according to The International Classification of Diseases, 10th revision (version 2016). All diagnoses from Chapter IX (Diseases of the circulatory system) were included in the analysis as CVD events.
The dataset used for analysis was defined as subjects with no missing data for all MetS-defining variables and no T2DM or CVD diagnosis before PERF (n = 3905) as illustrated in Fig. 1.
Figure 1.
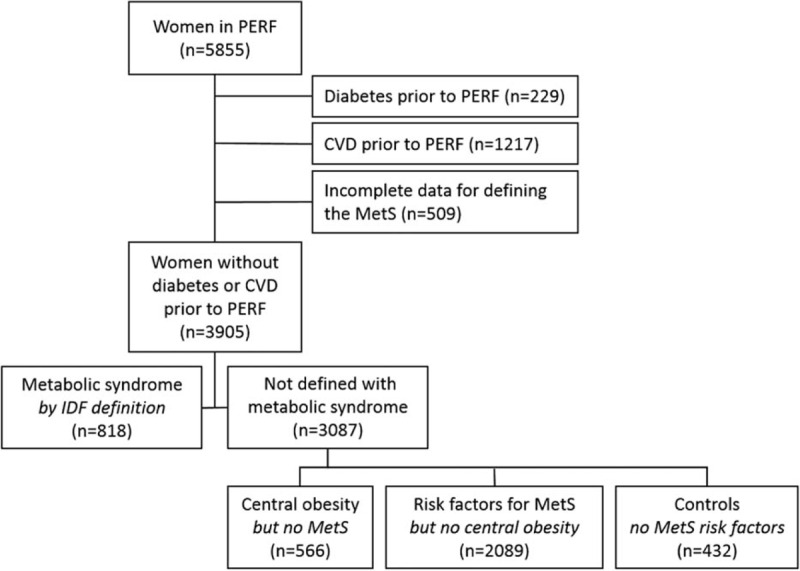
Definition of the study population. CVD = cardiovascular disease, MetS = metabolic syndrome, IDF = International Diabetes Federation, PERF = Prospective Epidemiological Risk Factor study.
The maximum follow-up period was 15.1 years (mean follow-up: 12.7 ± 3.0 years) starting on the day of study enrollment and ending at either occurrence of an event (register-based diagnosis) or on December 31, 2014 (registry data retrieval date), whichever came first. Of the entire study population, a total of 762 diabetics were identified, whereof 229 subjects were excluded from the analysis due to diagnosis before study enrollment. CVD diagnosis was identified in 3744 subjects, whereof 1313 subjects were excluded for having a CVD event before study enrollment. Of these 1313 subjects, 69 were also diagnosed with diabetes before enrollment, leaving 1217 unique subjects excluded based solely on CVD event history.
One or several data points for defining MetS were missing for 446 subjects. Sixty-three subjects were underweight (BMI ≤ 18.5 kg/m2), and thus, the DEXA scan may not be suitable for the definition of a relevant C/P ratio in this subgroup. In total, 509 subjects had either missing or inconclusive data points to permit definition of MetS. Altogether, 3905 subjects were included for further analysis.
In addition to the stratification based on identified MetS, data were analyzed based on a cumulative number of MetS risk factors (0–5) in order to investigate the cumulative effect of risk factors. In this regard, risk factors were dichotomized based on the cutoff for the MetS criteria.
2.4. Statistical analysis
Statistical analysis was conducted using MedCalc Statistical Software v. 14.8.1 (MedCalc Software, Ostend, Belgium), GraphPad Prism v.6 (GraphPad Software, La Jolla, CA), and SAS software, Version 9.4 (SAS Institute Inc., Cary, NC). PCA was performed in R v. 2.15.3 (R Development Core Team, Vienna, Austria) using the ggbiplot package.
Baseline characteristics of subjects with defined MetS compared to subjects with no risk factors for MetS (Table 1) were analyzed using Mann–Whitney U test (numerical variables) or chi-square test (categorical variables).
Table 1.
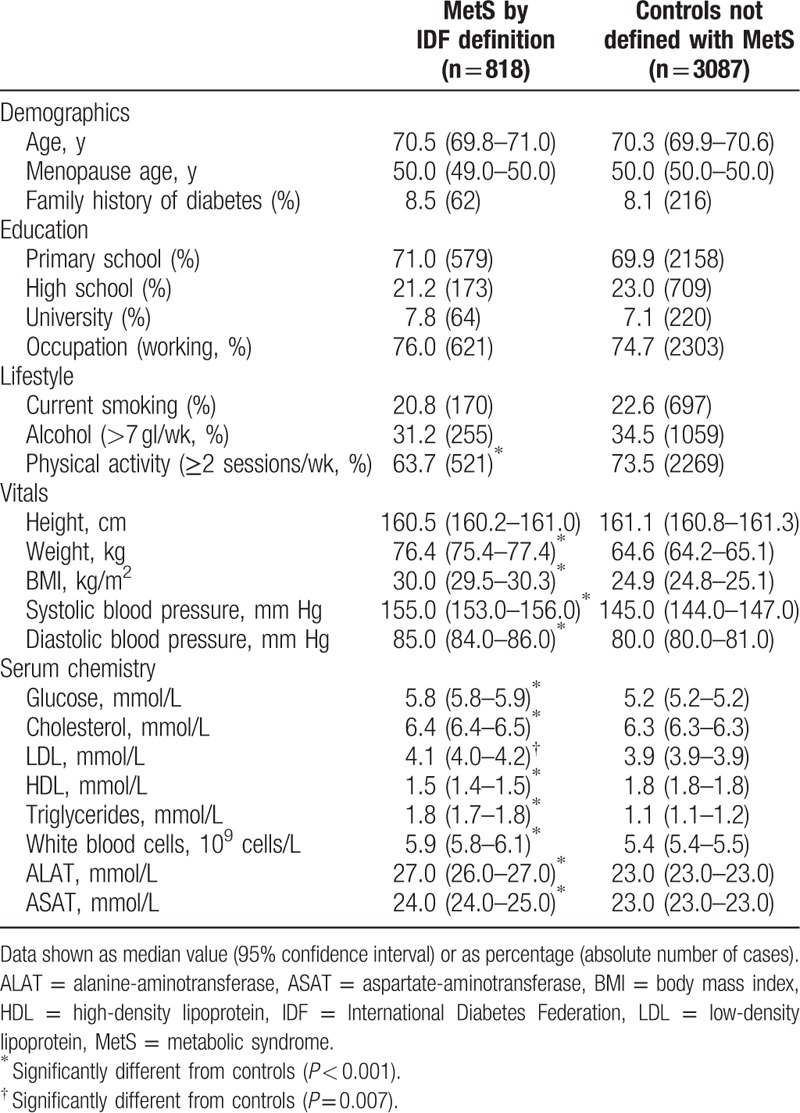
Cohort characteristics of elderly women with and without defined MetS.
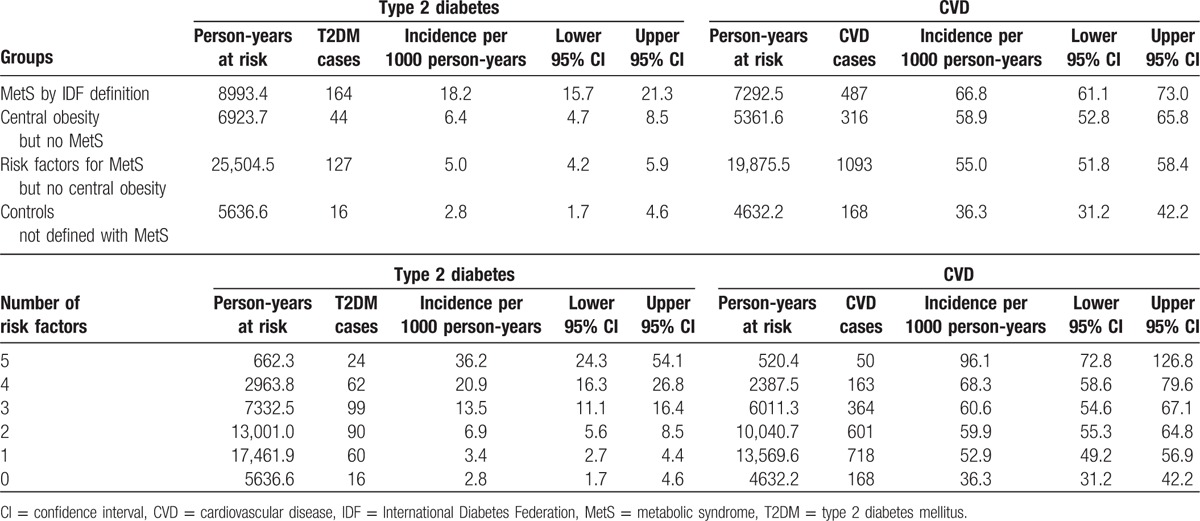
Multivariate Cox proportional hazards regression model with age as time scale was used to assess three aspects of the MetS: risk of developing T2DM and CVD in women defined with MetS compared to women not defined with the syndrome; risk associated with the individual MetS risk factors and subsequent T2DM or CVD (Fig. 2); risk of developing T2DM and CVD in women with defined MetS, in women with central obesity, and up to one additional MetS risk factor, but not defined with MetS, and in women with other risk factors for MetS than central obesity. Women holding no risk factors for MetS were used as the reference group (Fig. 4A). Categorical variables included in all multivariate Cox proportional hazard regression models were current smoking (yes/no), current alcohol consumption (<7 vs ≥7 drinks/wk), and physical activity other than walking (<2 vs ≥2 sessions/wk). The Cox proportional hazard regression model was further used to assess the risk of T2DM and CVD based on the cumulative number of metabolic risk factors (1–5), where subjects with no MetS risk factors were used as reference group (Fig. 4B). Incidence rates were calculated for all groups (Table 2) as incidence per 1000 person-years.
Figure 2.
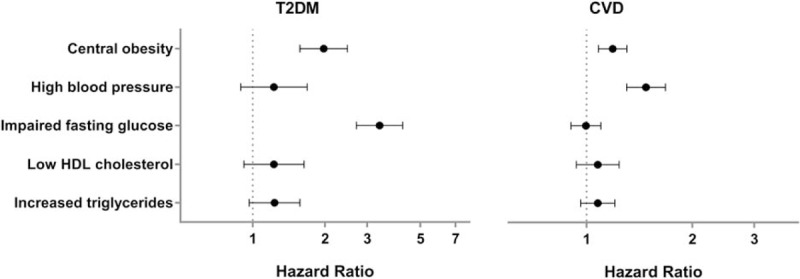
Risk associated with the 5 metabolic risk factors used to define the metabolic syndrome showed central obesity to be the only risk factor contributing to increased risk of both T2DM and CVD outcome. Multivariate Cox regression analysis for the risk of developing T2DM and CVD based on individual metabolic risk factors; central obesity, high blood pressure, elevated fasting glucose, decreased HDL cholesterol, and increased triglyceride levels. Values were adjusted for age, smoking, alcohol consumption, and physical activity. CVD = cardiovascular disease, T2DM = type 2 diabetes mellitus. Data represent hazard ratio with 95% confidence interval.
Figure 4.
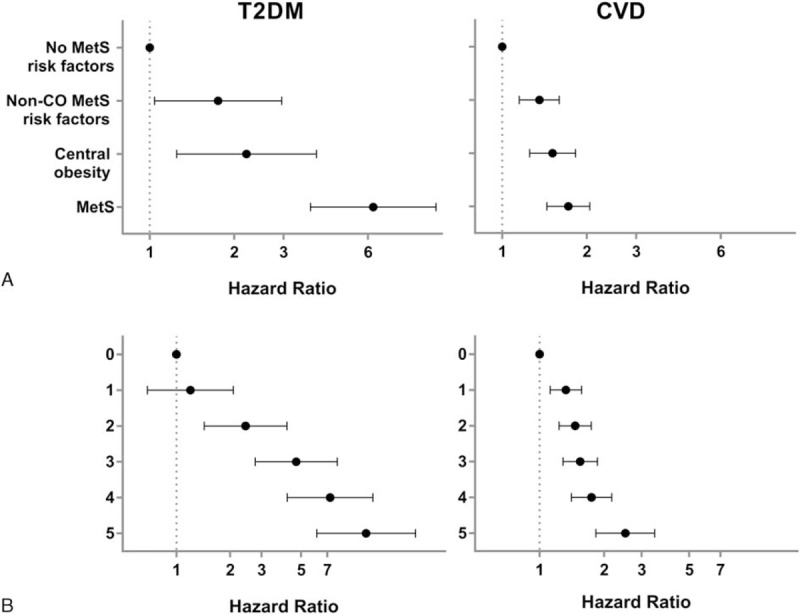
Stratification of the heterogeneous control group in identified intermediate subgroups with increased risk for later T2DM and CVD. (A) Multivariate Cox regression analysis for the risk of developing T2DM and CVD based on control group stratification. Subgroups represent reference group with no risk factors for MetS, subjects with risk factors for MetS but no central obesity, subjects with central obesity and up to one additional MetS risk factor, and subjects with defined MetS. Values are adjusted for age, smoking, alcohol consumption, and physical activity. CVD = cardiovascular disease, MetS = metabolic syndrome, non-CO = non-central obesity, T2DM = type 2 diabetes mellitus. (B) Risk of developing T2DM and CVD for subjects with 1 to 5 risk factors for MetS as compared to the reference group with no MetS risk factors. 0: n = 432; 1: n = 1404; 2: n = 1083; 3: n = 647; 4: n = 271; and 5: n = 68. Values are adjusted for age, smoking, alcohol, and physical activity. Data represent hazard ratio with 95% confidence interval.
Table 2.
Incidence rates of T2DM and CVD within elderly women in the PERF cohort stratified based on metabolic definitions or based on number of risk factors.
PCA (Fig. 3A) was computed from C/P ratio, BMI, triglycerides, HDL cholesterol, fasting glucose, systolic BP, diastolic BP, smoking status, alcohol consumption, physical activity, low-density lipoprotein (LDL) cholesterol, total cholesterol, white blood cell count (WBC), alanine-aminotransferase (ALAT), and aspartate-aminotransferase (ASAT). All variables were assessed for normality, and C/P ratio, BMI, and triglyceride levels were log-transformed to ensure normality in the data distribution. Subjects with a WBC serum levels >109 cells/L, or ALAT or ASAT levels >50 mmol/L, were excluded from the PCA (n = 161) to secure a representative presentation of the metabolic risk factor distribution in the cohort, so that subjects with extreme WBC, ALAT, and ASAT values would not distort the analysis. After centering and scaling the data, we obtained the principal components (PCs) describing the systematic variation in data across the 15 variables, hence revealing the metabolic profiles in the dataset. The differences between the PC1 components of the four groups were compared using one-way analysis of variance with 95% confidence limits. Tukey's test was applied as post hoc analysis to determine pairwise differences between groups (Fig. 3B). The relationship between subjects defined with MetS compared to the 3 non-MetS subgroups was also analyzed using a Kruskal–Wallis test (Supplemental Digital Content 1). For P values less than 0.05, a post hoc test for pairwise comparison of subgroups, according to Conover,[20] was performed.
Figure 3.
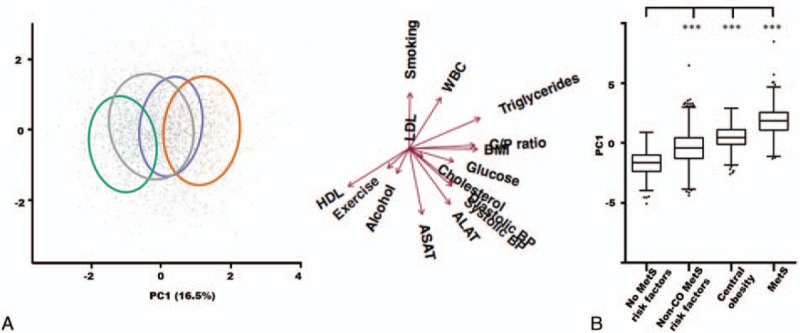
A heterogeneous metabolic risk profile within the control group. (A) Principal component analysis score plot colored by group: reference group subjects with no metabolic risk factors (green), subjects with risk factors for MetS but no central obesity (gray), subjects with central obesity and up to 1 other MetS risk factor (purple), and subjects with defined MetS (orange). The ellipses cover 68% of the subjects belonging to a given subgroup. Loadings for the included parameters are shown with arrows. ALAT = alanine-aminotransferase, ASAT = aspartate-aminotransferase, C/P ratio = central/peripheral fat mass ratio, cholesterol = total cholesterol, glucose = fasting glucose, WBC = white blood cell count. Exercise: physical activity. (B) Distribution of the principal component 1 scores for the 4 subgroups. Boxes represent the upper quartile, the mean, and the lower quartile of the data. Whiskers designate the Tukey interval with outliers shown as staggered dots. ∗∗∗P < 0.001. MetS = metabolic syndrome, non-CO = non-central obese.
3. Results
3.1. Metabolic syndrome in elderly women
Among the elderly women in the PERF cohort, we found that 20.9% were defined having MetS (n = 818) (Table 1). The demographic characteristics, education level, and lifestyle did not vary among subjects with MetS and controls except for physical activity level, which was greater in the control group (P < 0.001).
Serum LDL and total cholesterol, which are lipid parameters not used in the MetS definition, varied significantly between the two groups (P < 0.001 and P = 0.007, respectively). This was also the case for WBC and the liver function markers ALAT and ASAT (P < 0.001 for all three variables).
We found a 3.6-fold increased risk of developing T2DM (hazard ratio (HR) = 3.63, 95% confidence interval: [2.93–4.48]) and a 1.3-fold increased risk of a CVD event (HR = 1.29 [1.16–1.43]) after 12.7 ± 3.0 years of follow-up for subjects with MetS compared to controls without defined MetS. Given the strong effects of MetS on disease risk, we further investigated the relationship between the individual MetS risk factors and subsequent T2DM or CVD events (Fig. 2).
Central obesity was the only MetS risk factor contributing to increased risk of both outcomes with a 2-fold increased risk of T2DM (HR = 1.98 [1.57–2.48]) and a 1.5-fold increased risk of a CVD event (HR = 1.48 [1.30–1.68]) (Fig. 2). Elevated fasting glucose was only related to the development of T2DM (HR = 3.38 [2.71–4.22]) and did not contribute to an increased risk of CVD. Conversely, high blood pressure was a contributor to the development of CVD events (HR = 1.19 [1.09–1.30]) but did not contribute to an increased risk of T2DM. Neither HDL cholesterol nor triglyceride levels contributed to an increased risk of T2DM and CVD in this cohort of elderly Caucasian women.
3.2. Subgrouping the control group consisting of subjects with heterogeneous MetS risk factor profiles
Since central obesity alone contributed to increased risk of both T2DM and CVD, we speculated if the subjects with central obesity in the control group would take part in reducing the prediction of future disease prevalence within defined MetS subjects. To examine this question, we divided the heterogeneous control group into 3 subgroups: subjects with central obesity, and up to 1 additional MetS risk factor, but not defined with MetS; subjects without central obesity, but with other risk factors for the MetS; and subjects with no MetS risk factors.
To capture the multivariate features of the dataset, we used PCA to visualize the differences between the MetS group and the three control subgroups (Fig. 3A). We observed a distinct separation between subjects with defined MetS (orange) and the control group comprising subjects with no risk factors for MetS (green), while the non-MetS subjects with central obesity (purple) and subjects with other MetS risk factors (gray) cut in between the non-MetS risk factor controls and MetS subjects in the PCA score plot. Based on the group distributions, the multivariate analysis indicated that subjects with central obesity and up to 1 MetS risk factor are metabolically more similar to MetS subjects, while subjects with other MetS risk factors than central obesity are more similar to the reference group with no MetS risk factors. The 4 subgroups were found to statistically separate in PC1 (Fig. 3B), meaning that all subgroups differed in the parameters pulling in the PC1 direction within the loading plot. The parameters driving this separation are mainly MetS classification parameters such as C/P ratio, BMI, fasting glucose, HDL cholesterol, triglycerides, and blood pressure. Smoking, LDL cholesterol, and ASAT had no influence on the separation of the subjects in PC1.
Since the PCA indicated that the three subgroups from the former control group showed differentiated metabolic profiles, we used Cox regression analysis to investigate whether these subjects also showed different risk profiles for T2DM and CVD. We found that controls with central obesity without MetS had a 2.2-fold increased risk of T2DM (HR = 2.21 [1.25–3.93]) and a 1.5-fold increased risk of CVD (HR = 1.51 [1.25–1.83]) compared to the reference group with no risk factors for MetS (Fig. 4A). Likewise, controls with other MetS risk factors than central obesity had a 1.8-fold increased risk of T2DM (HR = 1.75 [1.04–2.96]) and a 1.4-fold increased risk of CVD (HR = 1.36 [1.15–1.60]). Moreover, the stratification of the former control group also affected the disease risk in MetS subjects, as subjects with defined MetS showed a 6.3-fold increased risk of developing T2DM (HR = 6.29 [3.74–10.50]) and a 1.7-fold increased risk of a CVD event (HR = 1.72 [1.44–2.05]), when specifically compared to the reference group without MetS risk factors.
Further, we explored the effect of the risk factor distribution further by analyzing the relationship between the cumulated sum of risk factors and subsequent disease events. The average number of MetS risk factors for all subjects in the analytical sample was 1.8 ± 1.2. T2DM risk was increased for subjects with ≥2 MetS risk factors compared to subjects with no risk factors; 1 risk factor: HR = 1.20 (0.69–2.09), 2 risk factors: HR = 2.44 (1.43–4.17), 3 risk factors: HR = 4.70 (2.77–7.98), 4 risk factors: HR = 7.27 (4.19–12.61), and 5 risk factors: HR = 11.57 (6.12–21.88), respectively (Fig. 4B). An increased risk of a CVD event was found with ≥1 risk factor for MetS: HR = 1.33 (1.12–1.58), HR = 1.47 (1.24–1.75), HR = 1.55 (1.29–1.86), HR = 1.75 (1.41–2.18), and HR = 2.52 (1.83–3.46), respectively, as illustrated in Fig. 4B. The incidence rates shown in Table 2 further manifested the differentiated risk within the metabolic subgroups when stratified either based on metabolic definitions or based on number of risk factors. The lowest incidence was found in the control group holding no risk factors for MetS, with an incidence of 2.8 (1.7–4.6) per 1000 person-years for T2DM and an incidence of 36.3 (31.2–42.2) per 1000 person-years for CVD. The highest incidence was found in the group holding 5 risk factors for MetS, with an incidence of 36.2 (24.3–54.1) per 1000 person-years for T2DM and an incidence of 96.1 (72.8–126.8) per 1000 person-years for CVD.
4. Discussion
Elderly women with MetS proved to have an increased risk of developing T2DM and CVD when compared to women not defined with the syndrome. The increased risk of 3.6-fold for T2DM and 1.3-fold for CVD found in this study correlated well with findings reported in previous studies using a heterogeneous control group, although these results mostly originate from cohorts of middle-aged men and women.[10,17–19] We further refined these results by highlighting how a control group with heterogeneous MetS risk profiles in women without defined MetS can lead to a distortion of the hazard estimations associated with the MetS. We showed how specifically comparing subjects with defined MetS to subjects with no risk factors for MetS increased the risk estimate of future T2DM from 3.6 to 6.3-fold and the risk of a future CVD event from 1.3 to 1.7-fold. This clearly suggests that the risk of developing T2DM and CVD in women with defined MetS is much greater than previously proposed and further, that the risk of T2DM and CVD also was greater in women not defined with the syndrome but still holding some risk factors for MetS. To our knowledge, this type of risk assessment of the MetS has not previously been reported. In addition, the analysis of cumulating MetS risk factors showed increasing risk of later disease with increasing number of risk factors; with 5 MetS risk factors resulting in 11.6-fold increased the risk of T2DM development and 2.5-fold risk of CVD. This underlines the value of identifying subjects with MetS risk factors in the elderly population as well.
Central obesity was the only MetS risk factor that independently contributed to the risk of both future T2DM and CVD (2- and 1.5-fold, respectively). As central obesity is consistently highlighted as a key contributor to risk in any definition of the MetS,[16] our finding is congruent with this prominent role of central obesity in the MetS definition. By partitioning the control group of non-MetS subjects into 3 subgroups, we repeated our finding of a 2-fold increased risk of T2DM and 1.5-fold for CVD outcomes in subjects with central obesity without MetS. Furthermore, the PCA revealed that subjects with central obesity displayed a higher degree of similarity to MetS subjects than the 2 other subgroups without this risk factor, emphasizing the role of central obesity as a key driver of both T2DM and CVD. While we clearly demonstrated the predictive value of the MetS in relation to later risk of T2DM and CVD in elderly Caucasian women, we also showed that women not fulfilling the full MetS criteria likewise have a higher risk of developing T2DM and CVD later in life, if they have one or more of the MetS risk factors at baseline. This was further illustrated in the differentiated incidence rates found within the subdivided reference group. Further, the calculated incidence rates also underlined how the incidence of both T2DM and CVD increased with increasing numbers of risk factors.
The prognostic importance of the MetS compared to the prognostic capability of the sum of the individual MetS risk factors has previously been challenged by others.[21–23] With the PCA and risk estimates presented in this study, we add to this debate by assessing the risk of the individual components, highlighting the heterogeneity in the metabolic profiles of subjects not defined with MetS, and determining the predictive ability of the cumulating sum of risk factors constituting the MetS. Other studies have compared the predictive ability for CVD using both the MetS definition and the Framingham Risk Score[24–26] finding similar results for the two scoring systems, and further found the Diabetes Prediction Model to be superior to the MetS definition in predicting the risk of diabetes development.[25] Similarly, the findings in our study indicated that defining the MetS does not supersede the risk estimated when summing the risk of the individual risk factors. Consequently, our findings add to the questioning of applying a MetS definition to commonly cooccurring risk factors will provide auxiliary value in the general practice. Thus, it might be more practical to focus on developing a classification scheme that reflects both the degree and sum of risk factor abnormalities instead of using the current MetS definition. This suggestion is founded on the assumption that cooccurring factors indeed enhance the risk of adverse outcomes, as was also the result of our current cumulating risk factor analysis.
Regardless of focusing on MetS as a joined definition or on the sum of risk factors, it is known that the prevalence of the risk factors for MetS increases with age, reaching a prevalence of 40% in people aged >60 years.[2] The initial indicator of a high-risk metabolic profile is central obesity, and our present study coherently points to the high priority of this risk factor in the elderly segment of the population, when focusing on preventing T2DM and CVD and in advancing efforts to regulate the obesity epidemic.
The strengths of this study include its longitudinal design, detailed assessment of metabolic risk factors, and exclusion of subjects with T2DM and CVD at baseline. The study's follow-up information was derived from Danish registry data, which is of high quality based on the use of a unique personal identifier and nationwide electronic patient records, and thus results in limited loss of data from baseline to follow-up. The cohort consists of a large group of women in Denmark, where the homogenous population with equal access to primary care (tax-paid, not individually paid) may limit extrapolations to other populations. However, the hazard ratios found in this study are comparable to associations found in similar cohorts, though with different age distributions, which indicates that such generalizations are indeed plausible. By applying PCA as a multivariate tool to assess risk profiles, we introduce a possible confounder, as we subdivide the study population before PCA based on central obesity. With this common denominator being present in both the MetS group and the non-MetS group with central obesity, we potentially skew these 2 subgroups toward each other compared to the non-MetS group holding other risk factors for MetS, as this subgroup may be regarded as being more heterogeneous (by not having obesity as a common denominator). However, based on the MetS definition, it is not possible to circumvent this type of limitation. In this study, central obesity was determined by DEXA scan rather than waist circumference originally proposed by IDF. However, IDF does highlight that DEXA scan can be used as an additional factor in research of the MetS, which can allow further modification of the definition if necessary.
Elderly Caucasian women fulfilling the MetS criteria set by the IDF showed increased risk of future T2DM or CVD diagnosis; however, subjects who did not fulfill the criteria for MetS but presented one or more of the components of MetS were also at increased risk. A further subdivision of the reference group proved to increase the risk of T2DM to 6.3-fold (from 3.6-fold) and 1.7-fold for CVD (from 1.3-fold) for MetS subjects when compared to a reference group only including subjects with no MetS risk factors. In clinical practice, employment of the MetS in elderly women should be focused as a tool for identifying subjects with metabolic high-risk profiles. However, the sum of risk factors are proposed to be equally considered, as subjects not fitting the MetS-criterion, but still holding one or more risk factors for MetS, were here identified also to be at increased risk of T2DM and CVD.
Acknowledgements
We acknowledge the Danish Research Foundation (Den Danske Forskningsfond) for funding the PERF study. The foundation had no role in study design, data interpretation, or submission of this manuscript.
CC serves as a board member and stock owner in Nordic Bioscience. MAK and KH hold stocks in Nordic Bioscience.
Supplementary Material
Footnotes
Abbreviations: ALAT = alanine-aminotransferase, ASAT = aspartate-aminotransferase, BMI = body mass index, C/P ratio = central/peripheral fat mass ratio, CCBR = Center for Clinical and Basic Research, CVD = cardiovascular disease, DEXA = dual-energy X-ray absorption, HDL = high-density lipoprotein, IDF = International Diabetes Federation, LDL = low-density lipoprotein, MetS = metabolic syndrome, PCA = principal component analysis, PERF = Prospective Epidemiological Risk Factor Study, T2DM = type 2 diabetes mellitus, WBC = white blood cell count.
Study funding: This work was supported by The Danish Research Foundation (Den Danske Forskningsfond) as they funded the PERF study in 2000. The foundation had no role in the study design, data interpretation, or submission of this manuscript.
Author contributions: KD—literature search, statistical analysis, figures, data interpretation, and writing; JSN—data interpretation and writing; JML—statistical analysis, data interpretation, and writing; HBH—study design and data interpretation; CC—study design and scientific advice; HB-N—data interpretation and scientific advice; MAK—data interpretation and scientific advice; SB—statistical analysis, data interpretation, writing, and scientific advice; KH—data interpretation, writing, and scientific advice.
The authors have no conflicts of interest to disclose.
Supplemental Digital Content is available for this article.
References
- 1.Wilson PWF. Obesity, diabetes, and risk of cardiovascular disease in the elderly. Am J Geriatr Cardiol 2002; 11:119–124. [DOI] [PubMed] [Google Scholar]
- 2.Ford ES, Giles WH, Dietz WH. Prevalence of the metabolic syndrome among US adults. JAMA 2002; 287:356–359. [DOI] [PubMed] [Google Scholar]
- 3.Selvin E, Coresh J, Brancati FL. The burden and treatment of diabetes in elderly individuals in the U.S. Diabetes Care 2006; 29:2415–2419. [DOI] [PubMed] [Google Scholar]
- 4.WHO. World Report on Ageing and Health. Geneva, Switzerland: World Health Organization; 2015. [Google Scholar]
- 5.Mensah GA, Brown DW. An overview of cardiovascular disease burden in the United States. Health Aff 2007; 26:38–48. [DOI] [PubMed] [Google Scholar]
- 6.Health and Consumer Protection Directorate-General. EU Discussion Paper: Healthy Ageing: Keystone for a Sustainable Europe. EU Health Policy in the Context of Demographic Change. Brussels: 2007. [Google Scholar]
- 7.Hanson RL, Imperatore G, Bennett PH, et al. Components of the ‘Metabolic Syndrome’ and incidence of type 2 diabetes. Diabetes 2002; 51:3120–3127. [DOI] [PubMed] [Google Scholar]
- 8.Laaksonen DE. Metabolic syndrome and development of diabetes mellitus: application and validation of recently suggested definitions of the metabolic syndrome in a prospective cohort study. Am J Epidemiol 2002; 156:1070–1077. [DOI] [PubMed] [Google Scholar]
- 9.Lakka H-M. The metabolic syndrome and total and cardiovascular disease mortality in middle-aged men. JAMA 2002; 288:2709–2716. [DOI] [PubMed] [Google Scholar]
- 10.Galassi A, Reynolds K, He J. Metabolic syndrome and risk of cardiovascular disease: a meta-analysis. Am J Med 2006; 119:812–819. [DOI] [PubMed] [Google Scholar]
- 11.Alberti KG, Zimmet PZ. Definition, diagnosis and classification of diabetes mellitus and its complications. Part 1: Diagnosis and classification of diabetes mellitus provisional report of a WHO consultation. Diabet Med 1998; 15:539–553. [DOI] [PubMed] [Google Scholar]
- 12.Third Report of the National Cholesterol Education Program (NCEP) Expert Panel on Detection, Evaluation, and Treatment of High Blood Cholesterol in Adults (Adult Treatment Panel III) final report. Circulation 2002;106:3143–3421. [PubMed] [Google Scholar]
- 13.Després J-P, Lemieux I. Abdominal obesity and metabolic syndrome. Nature 2006; 444:881–887. [DOI] [PubMed] [Google Scholar]
- 14.DeFronzo RA. Insulin resistance: a multifaceted syndrome responsible for NIDDM, obesity, hypertension, dyslipidaemia and atherosclerosis. Neth J Med 1997; 50:191–197. [DOI] [PubMed] [Google Scholar]
- 15.Alberti KGMM, Zimmet P, Shaw J. Metabolic syndrome—a new world-wide definition. A Consensus Statement from the International Diabetes Federation. Diabet Med 2006; 23:469–480. [DOI] [PubMed] [Google Scholar]
- 16.Alberti KGMM, Eckel RH, Grundy SM, et al. Harmonizing the metabolic syndrome: a joint interim statement of the International Diabetes Federation Task Force on Epidemiology and Prevention; National Heart, Lung, and Blood Institute; American Heart Association; World Heart Federation; International. Circulation 2009; 120:1640–1645. [DOI] [PubMed] [Google Scholar]
- 17.Gami AS, Witt BJ, Howard DE, et al. Metabolic syndrome and risk of incident cardiovascular events and death: a systematic review and meta-analysis of longitudinal studies. J Am Coll Cardiol 2007; 49:403–414. [DOI] [PubMed] [Google Scholar]
- 18.Mottillo S, Filion KB, Genest J, et al. The metabolic syndrome and cardiovascular risk a systematic review and meta-analysis. J Am Coll Cardiol 2010; 56:1113–1132. [DOI] [PubMed] [Google Scholar]
- 19.Ford ES. Risks for all-cause mortality, cardiovascular disease, and diabetes associated with the metabolic syndrome: a summary of the evidence. Diabetes Care 2005; 28:1769–1778. [DOI] [PubMed] [Google Scholar]
- 20.Conover W. Practical Nonparametric Statistics. 3rd ed.New York: John Wiley & Sons; 1999. [Google Scholar]
- 21.Kahn R, Buse J, Ferrannini E, et al. The metabolic syndrome: time for a critical appraisal: joint statement from the American Diabetes Association and the European Association for the Study of Diabetes. Diabetes Care 2005; 28:2289–2304. [DOI] [PubMed] [Google Scholar]
- 22.Grundy SM. Metabolic syndrome: a multiplex cardiovascular risk factor. J Clin Endocrinol Metab 2007; 92:399–404. [DOI] [PubMed] [Google Scholar]
- 23.Nichols GA, Moler EJ. Diabetes incidence for all possible combinations of metabolic syndrome components. Diabetes Res Clin Pract 2010; 90:115–121. [DOI] [PubMed] [Google Scholar]
- 24.McNeill AM, Rosamond WD, Girman CJ, et al. The metabolic syndrome and 11-year risk of incident cardiovascular disease in the atherosclerosis risk in communities study. Diabetes Care 2005; 28:385–390. [DOI] [PubMed] [Google Scholar]
- 25.Stern MP, Williams K, González-Villalpando C, et al. Does the metabolic syndrome improve identification of individuals at risk of type 2 diabetes and/or cardiovascular disease? Diabetes Care 2004; 27:2676–2681. [DOI] [PubMed] [Google Scholar]
- 26.Wannamethee SG, Shaper AG, Lennon L, et al. Metabolic syndrome vs Framingham Risk Score for prediction of coronary heart disease, stroke, and type 2 diabetes mellitus. Arch Intern Med 2005; 165:2644–2650. [DOI] [PubMed] [Google Scholar]
Associated Data
This section collects any data citations, data availability statements, or supplementary materials included in this article.


