

Short abstract
The authors describe the drug–drug interaction profile of the he patitis C direct‐acting antiviral agents ABT‐450, ombitasvir, and dasabuvir with cyclosporine A and tacrolimus, and use pha rmacokinetic simulations to develop recommendations for reduced doses of cyclosporine A and tacrolimus in posttransplant patients with recurrent hepatitis C infection.
Keywords: clinical research/practice, infectious disease, liver transplantation/hepatology, pharmacology, immunosuppressant, calcineurin inhibitor: cyclosporine A (CsA), immunosuppressant, calcineurin inhibitor: tacrolimus, infection and infectious agents, viral: hepatitis C, pharmacokinetics/pharmacodynamics
Abstract
ABT‐450, ombitasvir, and dasabuvir are direct‐acting antiviral agents (DAAs) that have been developed for combination treatment of chronic hepatitis C virus (HCV) infection. Because these DAAs have metabolic and transporter profiles that overlap with cyclosporine and tacrolimus disposition, there is potential for drug interactions. Two Phase 1 studies assessed effects of ABT–450 (150 mg coadministered with ritonavir 100 mg once daily), ombitasvir (25 mg once daily), and dasabuvir (400 mg twice daily) on the pharmacokinetics, safety, and tolerability of a single dose of cyclosporine (30 mg) or tacrolimus (2 mg) in healthy volunteers (N = 12 per study). In the presence of steady‐state concentrations of all 3 DAAs, dose‐normalized cyclosporine concentration at 24 hours (C24), and area under the concentration‐time curve from time 0 to infinity (AUC∞) were 15.8‐fold and 5.8‐fold, respectively, and dose‐normalized tacrolimus C24 and AUC∞ were 17‐fold and 57‐fold, respectively, of either agent alone. Cyclosporine and tacrolimus half‐lives increased from 7 to 25 h and 32 to 232 h, respectively. There were no major safety or tolerability issues in these studies. The results suggest that cyclosporine and tacrolimus doses and dosing frequency should be reduced in HCV‐infected posttransplant patients being treated with this 3‐DAA regimen.
Abbreviations
- 3D regimen
ABT‐450/ritonavir, ombitasvir, and dasabuvir
- ABT‐450/r
ABT‐450 administered with ritonavir
- AUC
area under the concentration‐time curve
- AUC∞
area under the concentration‐time curve from time 0 to infinity
- BMI
body mass index
- C12 or C24
concentration at 12 or 24 h
- CI
confidence interval
- Cmax
maximal concentration
- Ctrough
trough concentration
- CV
coefficient of variation
- CYP
cytochrome P450
- DAA
direct‐acting antiviral agent
- HCV
hepatitis C virus
- LLOQ
lower limit of quantitation
- NS
nonstructural protein
- OATP1B1
organic anion transporting polypeptide 1B1
- P‐gp
P‐glycoprotein
- SVR12
sustained virologic response 12 weeks post‐treatment
- Tmax
time to maximum observed concentration (Cmax)
- t1/2
terminal phase elimination half‐life
Introduction
Hepatitis C virus (HCV) infection affects approximately 170 million individuals worldwide 1. Chronic HCV infection can result in cirrhosis or hepatocellular carcinoma, both of which are leading causes of liver transplantation 2. Recurrence of HCV infection after liver transplantation is universal, and may lead to allograft loss 3. The course of HCV infection after liver transplantation is accelerated compared with that in the pretransplant setting, with 10% to 30% of patients developing cirrhosis only 5 years posttransplantation 4. Thus, safe and effective treatment of HCV in the posttransplant setting, in which patients receive immunosuppressive agents to prevent allograft rejection, is an important consideration in the development of new HCV therapies.
ABT‐450, ombitasvir (ABT‐267), and dasabuvir (ABT‐333) are direct‐acting antiviral agents (DAAs) developed for interferon‐free, all‐oral combination treatment of chronic HCV infection. These DAAs have distinct, nonoverlapping mechanisms of action against HCV. ABT‐450 is a nonstructural (NS) protein 3/4A protease inhibitor identified by AbbVie and Enanta as a lead compound for clinical development. ABT‐450 is metabolized primarily by cytochrome P450 (CYP) 3A and is administered with a low dose of the CYP3A inhibitor ritonavir as a pharmacokinetic enhancer (coadministration denoted ABT‐450/r) to allow for once daily administration and lower ABT‐450 doses. Ombitasvir is an NS5A inhibitor and dasabuvir is an NS5B nonnucleoside polymerase inhibitor. Results from Phase 3 trials in over 2000 HCV genotype 1‐infected subjects demonstrated that treatment with this combination of 3 DAAs (3D regimen) with ribavirin produced sustained virologic response 12 weeks after the end of treatment (SVR12) in 92% of patients with cirrhosis and 96% of patients without cirrhosis 5, 6. In addition, in the CORAL I study in liver transplant recipients with recurrent HCV genotype 1 infection and no cirrhosis (Metavir ≤ F2) at least 12 months after transplantation, 33 of 34 patients (97.1%; 95% confidence interval [CI], 91.4% to 100%) who were treated with the 3D regimen plus ribavirin for 24 weeks achieved SVR12 and no graft rejection events occurred 7. The calcineurin inhibitors cyclosporine A (cyclosporine) and tacrolimus are key immunosuppressants administered to liver transplant recipients. The dosing recommendations for cyclosporine and tacrolimus in the CORAL I study were derived from pharmacokinetic simulations based on drug interaction data described in the current report.
The metabolic and transporter profiles of the DAAs and cyclosporine and tacrolimus show considerable overlap. Cyclosporine and tacrolimus are metabolized by CYP3A and transported by the transmembrane protein P‐glycoprotein (P‐gp) and both agents are inhibitors of organic anion transporting polypeptide 1B1 (OATP1B1), an uptake transporter in the liver 8, 9, 10, 11. CYP3A, P‐gp, and OATP1B1 are all involved in ABT‐450 disposition and CYP3A is involved in dasabuvir metabolism. Ritonavir is a substrate and inhibitor of CYP3A 12 and it affects multiple drug transporters 13. Additionally, P‐gp is involved in ombitasvir and dasabuvir disposition and OATP1B1 is involved in dasabuvir metabolite (M1) disposition 14. Thus, interactions between the 3D regimen and cyclosporine or tacrolimus might be expected to alter drug exposures for all of these agents.
Two studies were conducted to evaluate the pharmacokinetics of coadministration of the 3D regimen with cyclosporine or tacrolimus in healthy volunteers to inform dosing recommendations prior to initiation of trials in transplant patients. Using data from these studies, pharmacokinetic simulations were performed to compare the time‐concentration profiles of cyclosporine and tacrolimus alone or in the presence of the 3D regimen to further inform dosing recommendations in transplant recipients.
Subjects and Methods
Two Phase 1 studies evaluated the pharmacokinetics of the DAAs administered with cyclosporine or tacrolimus. Both studies were conducted at the same site (PPD Development, Austin, TX) in accordance with Good Clinical Practice guidelines and ethical principles that have their origin in the Declaration of Helsinki. The protocols for the cyclosporine and tacrolimus studies (Protocols M13‐103 and M13‐491, respectively) were approved by the institutional review board (RCRC, now known as Salus IRB, Austin, TX; registration numbers IRB00006834 and IRB00006833) and written informed consent was obtained from each subject before any study‐related procedures were performed.
Subjects
Enrollment criteria were similar for both studies. Males and females between the ages of 18 and 55 years with body mass index (BMI) between 18 and 30 kg/m2 and in general good health were enrolled. Subjects must not have used any of the following prior to study drug administration: tobacco or nicotine‐containing products within 6 months; known inhibitors or inducers of CYP3A or OATP1B1 within 1 month; or alcohol within 72 h.
Study design
The studies were open‐label, sequential, multiple‐dose designed to evaluate the safety, tolerability, and pharmacokinetic interactions of coadministration of the 3D regimen (ABT‐450/r, ombitasvir, and dasabuvir) or 2‐DAA regimens (ABT‐450/r plus dasabuvir or ABT‐450/r plus ombitasvir) and cyclosporine or tacrolimus. In each study, eligible subjects were enrolled into one of three groups (N = 12 per group), each consisting of two periods (Fig. 1). The 3D regimen is the proposed regimen for treatment of HCV genotype 1; therefore, pharmacokinetic results from subjects who received the 3D regimen plus cyclosporine or tacrolimus are the focus of this report.
Figure 1.
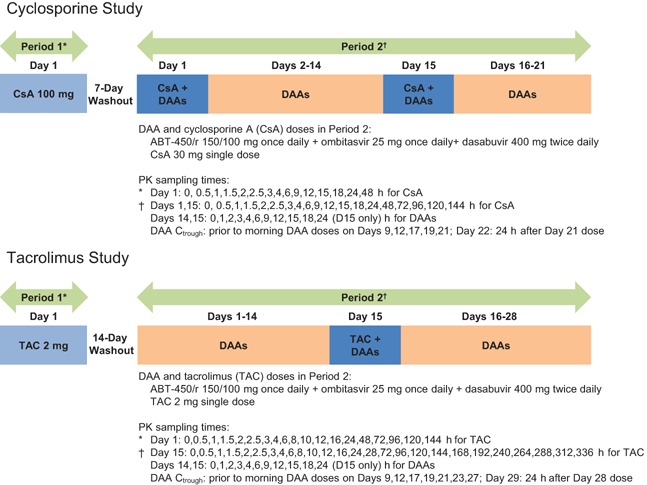
Cyclosporine and tacrolimus study designs.
Cyclosporine study
In Period 1, subjects received a single 100 mg dose of cyclosporine capsule (Neoral®, Novartis Pharmaceuticals Corporation, East Hanover, NJ) in the morning. In Period 2, subjects received the following oral regimens: a single 30 mg dose of cyclosporine solution (Neoral®, Novartis Pharmaceuticals Corporation, East Hanover, NJ) in the morning on Day 1 and Day 15, and ABT‐450/r 150/100 mg once daily, ombitasvir 25 mg once daily, and dasabuvir 400 mg twice daily on Days 1 through 21. The 30 mg dose of cyclosporine was chosen based on the magnitude of interaction observed in the two groups that received the 2‐DAA regimens and cyclosporine. The 400 mg dasabuvir formulation is bioequivalent to the 250 mg tablet (administered twice daily) evaluated in Phase 3 studies of the 3D regimen. Cyclosporine and the DAAs were coadministered at the same time in the morning. This study design permitted evaluation of the effect of single‐dose and steady‐state 3D regimen on a single dose of cyclosporine and the effect of a single dose of cyclosporine on steady‐state 3D regimen.
Tacrolimus study
In Period 1, subjects received a single 2 mg dose of tacrolimus capsule (Prograf®, Astellas Pharma US, Inc., Deerfield, IL) in the morning. In Period 2, subjects received the following oral regimens: a single 2 mg dose of tacrolimus capsule in the morning on Day 15, and ABT–450/r 150/100 mg once daily, ombitasvir 25 mg once daily, and dasabuvir 400 mg twice daily on Days 1 through 28. Tacrolimus and the DAAs were coadministered at the same time in the morning. This study design permitted evaluation of the effect of steady‐state 3D regimen on a single dose of tacrolimus and the effect of a single dose of tacrolimus on steady‐state 3D regimen.
Cyclosporine and tacrolimus are administered without food to maximize absorption 8, 9; therefore, on Study Day 1, cyclosporine and tacrolimus were administered after a minimum 10‐h fast to mimic typical dosing. However, the 3D regimen is administered with food. In the current studies, cyclosporine and tacrolimus were coadministered with the 3D regimen in the presence of food to enable dose recommendations for further clinical development of the 3D regimen in HCV‐infected patients receiving these agents.
Sample collection and bioanalytical methods
Blood samples for the determination of drug concentrations were collected by venipuncture at multiple timepoints throughout each study (Fig. 1).
Plasma concentrations of ABT‐450, ritonavir, ombitasvir, dasabuvir, and dasabuvir M1 (dasabuvir metabolite) and whole blood concentrations of cyclosporine and tacrolimus were determined using a validated liquid chromatography and tandem mass spectrometric detection method. The lower limits of quantitation (LLOQ) for ABT‐450, ritonavir, ombitasvir, dasabuvir, dasabuvir M1, cyclosporine, and tacrolimus were 0.595 ng/mL, 4.91 ng/mL, 0.424 ng/mL, 4.53 ng/mL, 4.72 ng/mL, 5.0 ng/mL, and 0.250 ng/mL, respectively.
Pharmacokinetic evaluations
Noncompartmental methods were used to estimate the maximum observed concentration (Cmax) and time to Cmax (peak time, Tmax), predose trough concentration (Ctrough) (C12 for dasabuvir and dasabuvir M1 and C24 for all others), apparent terminal phase elimination rate constant (β), terminal phase elimination half‐life (t1/2), and area under the concentration‐time curve from time 0 to 12 h (dasabuvir and dasabuvir M1), 24 h (all others) (AUC12 or AUC24), or infinite time (AUC∞). Dose‐normalized pharmacokinetic parameters were calculated by dividing parameters by the administered dose.
Safety and tolerability
Safety and tolerability were evaluated based on adverse event monitoring, vital signs measurements, physical examinations, 12‐lead electrocardiogram assessments, and laboratory tests.
Statistical analysis
To assess the effect of the 3D regimen on cyclosporine or tacrolimus, a repeated measures analysis was performed for the natural logarithms of dose‐normalized cyclosporine or tacrolimus Cmax, AUC, and C24. Similarly, to assess the effect of cyclosporine or tacrolimus on the 3D regimen, a repeated measures analysis was performed for the natural logarithms of ABT‐450, ritonavir, ombitasvir, dasabuvir, and dasabuvir M1 Cmax, AUC, and C24 (C12 for dasabuvir and dasabuvir M1). The 90% CIs for ratio estimates were obtained by taking the antilogarithm of the upper and lower limits of the CIs for the difference of the least squares means on the logarithmic scale obtained within the framework of the repeated measures analysis model.
In each study, complete data from 12 subjects per group would have provided at least 81.5% power for the test on ABT‐450 AUC if the ratio of the central values was twofold (assuming the error term variance of 0.2929 for the natural logarithm of AUC). Based on previous studies, the variability in other drugs is lower than that of ABT‐450.
Pharmacokinetic simulations
Mean concentration‐time profiles for 3D plus cyclosporine or tacrolimus were used to simulate concentration‐time profiles for different regimens (cyclosporine 100 mg once daily plus 3D, and tacrolimus 0.5 mg every 7 days, 0.5 mg every 14 days, or 0.2 mg every 72 h plus 3D) using nonparametric super‐positioning (Phoenix™ WinNonlin®, Version 6.3, Pharsight Corporation, St. Louis, MO). Simulated concentration‐time profiles for 3D plus cyclosporine or tacrolimus were compared with the simulated concentration‐time profiles for cyclosporine alone (250 mg twice daily) or tacrolimus alone (2 mg twice daily) to provide dosing recommendations for coadministration of cyclosporine or tacrolimus with the 3D regimen.
Results
Subjects and baseline demographics
In each study, 12 subjects were enrolled in the group that evaluated interaction of cyclosporine or tacrolimus with the 3D regimen. Two subjects in the cyclosporine study were excluded from statistical analyses of pharmacokinetic parameters for Period 2 Day 15; one who withdrew due to a family emergency and one who had no measurable blood cyclosporine concentrations.
In each study, the mean age of subjects was 33 years and the mean BMI was 26 kg/m2. All subjects but one were male and the majority (75%) was white.
Effect of the 3D regimen on cyclosporine and tacrolimus pharmacokinetics
Cyclosporine
The dose‐normalized mean blood concentration‐time profiles for cyclosporine administered alone (Period 1, Day 1) or with the 3D regimen (Period 2, Days 1 and 15) are presented in Fig. 2. The mean (% coefficient of variation, CV) pharmacokinetic parameters of cyclosporine, with and without dose normalization, and dose‐normalized geometric mean ratios and 90% CIs are presented in Table 1. The effect of 3D on cyclosporine exposures was greater when the DAAs were at steady state than after 1 day of dosing. In the presence of a single dose of the 3D regimen, dose‐normalized cyclosporine C24 and AUC∞ were 7.0‐fold and 3.0‐fold of the cyclosporine values when administered alone, respectively, whereas cyclosporine dose‐normalized Cmax was 36% lower. Cyclosporine half‐life increased from 7.3 to 16 h and Tmax was delayed by 2.2 h. In the presence of the 3D regimen at steady state, dose‐normalized cyclosporine C24 and AUC∞ were 16‐fold and 5.8‐fold of the cyclosporine values when administered alone, respectively, whereas cyclosporine dose‐normalized Cmax was similar. Cyclosporine half‐life increased from 7.3 to 25 h and Tmax was delayed by 3.1 h.
Figure 2.

Mean dose‐normalized concentration‐time profile (log‐linear scale) of a single dose of cyclosporine with or without coadministration of the 3D regimen. Note: 3D, ABT‐450/ritonavir 150/100 mg once daily, ombitasvir 25 mg once daily, and dasabuvir 400 mg twice daily.
Table 1.
Cyclosporine pharmacokinetic parameters
| CsA 100 mg | CsA 30 mg + 3D | CsA 30 mg + 3D | |||
|---|---|---|---|---|---|
| Period 1, Day 1 (N = 12) | Period 2, Day 1 (N = 12) | Period 2, Day 15 (N = 10) | |||
| Parameter | Mean (%CV) | Mean (%CV) | Geometric Mean Ratio (90% CI) | Mean (%CV) | Geometric Mean Ratio (90% CI) |
| Cmax/D (ng/mL/mg) | 6.4 (22) | 4.3 (44) | 0.64 (0.54–0.75) | 6.5 (25) | 1.0 (0.85–1.2) |
| AUC∞/D (ng·h/mL/mg) | 21 (21) | 72 (60) | 3.0 (2.5–3.7) | 125 (25) | 5.8 (4.7–7.1) |
| C24/D (ng/mL/mg) | 0.08 (29) | 0.61 (42) | 7.0 (6.2–7.9) | 1.4 (23) | 16 (14–18) |
| C12/D (ng/mL/mg) | 0.27 (32) | 1.8 (39) | – | 3.3 (23) | – |
| Cmax (ng/mL) | 635 (22) | 128 (44) | – | 194 (25) | – |
| Tmax (h) | 1.8 (33) | 4.0 (41) | – | 4.9 (24) | – |
| AUC∞ (ng·h/mL) | 2110 (21) | 2170 (60) | – | 3750 (25) | – |
| t1/2 (h) 1 | 7.3 (22) | 16 (78) | – | 25 (43) | – |
| C24 (ng/mL) | 8.5 (29) | 18 (42) | – | 41 (23) | – |
| C12 (ng/mL) | 27 (32) | 53 (39) | – | 98 (23) | – |
CsA, cyclosporine A; 3D, ABT‐450/ritonavir 150/100 mg once daily, ombitasvir 25 mg daily, and dasabuvir 400 mg twice daily; D, dose.
Harmonic mean ± pseudo‐CV%.
Tacrolimus
The dose‐normalized mean blood concentration‐time profiles for tacrolimus administered alone (Period 1, Day 1) or with the 3D regimen (Period 2, Day 15) are presented in Fig. 3. The mean (%CV) pharmacokinetic parameters of tacrolimus, with and without dose normalization, and dose‐normalized geometric mean ratios and 90% CIs are presented in Table 2. In the presence of the 3D regimen at steady state, dose‐normalized tacrolimus Cmax, C24, and AUC∞ were 4.0‐, 17‐, and 57‐fold of the tacrolimus values when administered alone, respectively. Tacrolimus half‐life increased from 32 to 232 h and Tmax was delayed by 3.2 h.
Figure 3.

Mean dose‐normalized concentration‐time profile (log‐linear scale) of a single dose of tacrolimus with or without coadministration of the 3D regimen. Note: 3D = ABT‐450/ritonavir 150/100 mg once daily, ombitasvir 25 mg once daily, and dasabuvir 400 mg twice daily.
Table 2.
Tacrolimus pharmacokinetic parameters
| Tacrolimus 2 mg | Tacrolimus 2 mg + 3D | ||
|---|---|---|---|
| Period 1, Day 1 (N = 12) | Period 2, Day 15 (N = 12) | ||
| Parameter | Mean (%CV) | Mean (%CV) | Geometric Mean Ratio (90% CI) |
| Cmax/D (ng/mL/mg) | 5.7 (39) | 22 (23) | 4.0 (3.2–5.0) |
| AUC∞/D (ng·h/mL/mg) | 59 (34) | 3290 (25) | 57 (46–72) |
| C24/D (ng/mL/mg) | 0.53 (32) | 8.5 (23) | 17 (13–21) |
| C12/D (ng/mL/mg) | 0.78 (31) | 11 (29) | – |
| Cmax (ng/mL) | 11 (39) | 43 (23) | – |
| Tmax (h) | 1.8 (37) | 5.0 (38) | – |
| AUC∞ (ng·h/mL) | 118 (34) | 6590 (25) | – |
| t1/2 (h) 1 | 32 (26) | 232 (30) | – |
| C24 (ng/mL) | 1.1 (32) | 17 (23) | – |
| C12 (ng/mL) | 1.6 (31) | 23 (29) | – |
3D, ABT‐450/ritonavir 150/100 mg once daily, ombitasvir 25 mg once daily, and dasabuvir 400 mg twice daily; D, dose.
Harmonic mean ± pseudo‐CV%.
Projected cyclosporine and tacrolimus Ctrough values for reduced dosing regimens
Illustrations of timelines from the time a patient undergoes transplant through the first several days of 3D treatment, and comparisons of the pharmacokinetic simulations of expected cyclosporine and tacrolimus concentration‐time profiles before and after 3D treatment are shown in Fig. 4 and Fig. 5. The expected Ctrough values in posttransplant patients who initiate 3D treatment are provided in Table 3. A reduction in cyclosporine dose and dosing frequency from 250 mg twice daily (total daily dose of 500 mg) to 100 mg once daily (fivefold reduction in total daily dose) is projected to maintain Ctrough values similar to values observed before 3D treatment. Similarly, a reduction in tacrolimus dose and dosing frequency from 2 mg twice daily to 0.5 mg every 7 days is expected to maintain Ctrough levels within the range observed before initiation of 3D treatment at 12 months after transplantation. Administration of 0.2 mg strength of tacrolimus, available in some countries, every 72 h is also expected to maintain acceptable Ctrough levels (Table 3).
Figure 4.

Simulated concentration‐time profile for coadministration of cyclosporine 100 mg once daily with the 3D regimen. QD, once daily; BID, twice daily. Note: The plot illustrates the timeline from the time a patient undergoes transplant through the first several days of 3D (ABT‐450/ritonavir 150/100 mg once daily, ombitasvir 25 mg once daily, and dasabuvir 400 mg twice daily) treatment. The mean concentration‐time profile for cyclosporine is shown (black and blue lines). The grey lines illustrate the cyclosporine profile in the absence of 3D treatment. Subjects were assumed to have a stable cyclosporine Ctrough of 100 ng/mL when initiating 3D treatment. Further modifications in cyclosporine dose or dosing frequency should be guided by trough levels measured during coadministration with the 3D regimen.
Figure 5.

Simulated concentration‐time profile for coadministration of tacrolimus 0.5 mg every 7 days with the 3D regimen. QD, once daily; BID, twice daily. Note: The plot illustrates the timeline from the time a patient undergoes transplant through the first 2 weeks of 3D (ABT‐450/ritonavir 150/100 mg once daily, ombitasvir 25 mg once daily, and dasabuvir 400 mg twice daily) treatment. The mean concentration‐time profile for tacrolimus is shown (black and blue lines). The grey lines illustrate the tacrolimus profile in the absence of 3D treatment. Subjects were assumed to have a stable tacrolimus Ctrough of 5 ng/mL when initiating 3D treatment. Further modifications in tacrolimus dose or dosing frequency should be guided by trough levels measured during coadministration with the 3D regimen.
Table 3.
Projected cyclosporine (CsA) and tacrolimus Ctrough (C24) values for posttransplant patients who initiate 3D treatment
| Ctrough before 3D treatment1 (ng/mL) | Ctrough during 3D treatment (ng/mL) | |
|---|---|---|
| CsA dose | 250 mg BID (500 mg daily) | 100 mg QD (1/5th total daily dose) |
| 70–90 | 90–120 | |
| 100–120 | 100–120 | |
| Tacrolimus dose | 2 mg (BID) | 0.5 mg every 7 days |
| 5–7 | 6–12 | |
| 8–10 | 8–12 | |
| 2 mg (BID) | 0.5 mg every 14 days | |
| 5–7 | 3–4 | |
| 8–10 | 3–6 | |
| 2 mg (BID) | 0.2 mg 2 every 72 h | |
| 5–7 | 5–8 | |
| 8–10 | 8–9 |
3D, ABT‐450/ritonavir 150/100 mg once daily, ombitasvir 25 mg once daily, and dasabuvir 400 mg twice daily; Ctrough, predose morning concentration; QD, once daily; BID, twice daily.
1Assumes the Ctrough concentration is stable.
2Strength approved in some countries.
Effect of cyclosporine and tacrolimus on DAA steady‐state pharmacokinetics
The geometric mean ratios and 90% CIs of DAA steady‐state pharmacokinetic parameters in the presence of cyclosporine or tacrolimus compared to those of the DAAs alone are presented in Fig. 6. In the presence of cyclosporine or tacrolimus, steady‐state ombitasvir exposures (Cmax and AUC) were generally similar (≤15% change) to those in the absence of cyclosporine or tacrolimus, whereas ABT‐450 exposures (Cmax and AUC) were 44% to 72% higher, respectively, in the presence of cyclosporine and 34% to 43% lower, respectively, in the presence of tacrolimus. Ritonavir, dasabuvir, and dasabuvir M1 pharmacokinetic parameters were only slightly affected (≤34% change) by cyclosporine and tacrolimus.
Figure 6.

Geometric mean ratios and 90% confidence intervals for DAA pharmacokinetic parameters in the presence of a single dose of cyclosporine or tacrolimus compared to those of the DAAs alone. Note: Ctrough (C24) and AUC24 for ABT‐450, ritonavir, and ombitasvir; Ctrough (C12) and AUC12 for dasabuvir and dasabuvir M1.
Safety and tolerability
Coadministration of the 3D regimen with cyclosporine was well tolerated in the 12 subjects in the study. Adverse events were infrequent and were mild in severity except for one moderate event of syncope assessed as unrelated to the DAAs or cyclosporine in the opinion of the investigator. Coadministration of the 3D regimen with tacrolimus was also well tolerated in the 12 subjects in the study. Adverse events were mild in severity except for moderate nausea in one subject and vomiting in two subjects. One of the adverse events of vomiting was assessed by the investigator as possibly related to tacrolimus, but not to the 3D regimen.
No deaths, serious adverse events, adverse events that led to discontinuation, or clinically meaningful abnormal laboratory values were reported in either study. No clinically significant electrocardiogram abnormalities were observed.
Discussion
Effects of the 3D regimen of ABT‐450/r, ombitasvir, and dasabuvir on cyclosporine and tacrolimus pharmacokinetics were evaluated in healthy volunteers to inform dosing recommendations for studies in posttransplant patients receiving immunosuppressive therapy. Because the immunosuppressants have metabolic and transporter profiles that overlap with those of DAAs, particularly for CYP3A, coadministration may cause drug interactions that affect drug exposures 15. Results from the current studies suggest that the dose and dosing frequency of these agents should be reduced upon initiation of 3D therapy.
Cyclosporine total exposure (AUC) and C24 values increased significantly, but peak exposure (Cmax) did not, suggesting the drug interaction was mediated by reduced clearance rather than increased oral bioavailability. Reduced clearance was also reflected in the longer cyclosporine elimination half‐life, which increased from 7 to 25 h in the presence of the 3D regimen. This result is consistent with the known effect of ritonavir on CYP3A substrates 12 and the inhibitory effect of ABT‐450 on OATP1B1. This result is also consistent with effects of other CYP3A inhibitors on cyclosporine 8, 16, 17, 18.
Cyclosporine dose‐normalized C24 values in the presence of single and multiple doses of the 3D regimen were sevenfold to 16‐fold of the dose‐normalized C24 values when cyclosporine was administered alone. In addition, cyclosporine dose‐normalized C24 values in the presence of the 3D regimen were approximately twofold to fivefold of the dose‐normalized C12 values when cyclosporine was administered alone. Higher cyclosporine exposure following multiple doses of the 3D regimen is likely due to higher ritonavir exposures at steady state compared to those after a single dose 19. These results suggest that a typical cyclosporine twice‐daily dose should not be used in posttransplant patients. Pharmacokinetic simulations indicate that after initiation of 3D therapy, posttransplant patients should receive a once‐daily cyclosporine dose that is one‐fifth of the pre‐3D treatment total daily dose to achieve cyclosporine trough levels comparable to those observed prior to administration of the 3D regimen. The one‐fifth dose is consistent with the fivefold to 20‐fold dose reduction required when cyclosporine is given with lopinavir/ritonavir 20. Subsequent cyclosporine dose and dosing frequency modifications during 3D therapy should be informed by the individual's cyclosporine trough concentrations. Upon completion of 3D treatment, the pre‐3D dose of cyclosporine may be resumed the following day and the dose modified thereafter based on cyclosporine trough levels.
Coadministration of the 3D regimen with tacrolimus caused an increase in tacrolimus exposures that was greater than the increase in cyclosporine exposures. Similar to cyclosporine, effects of the 3D regimen on tacrolimus AUC and C24 were greater than the effect on Cmax, indicating the primary mechanism of interaction is through inhibition of elimination and reduced clearance rather than increased bioavailability. The reduction in tacrolimus clearance resulted in an increase in tacrolimus elimination half‐life from 32 h (1.3 days) to 232 h (approximately 10 days). Because tacrolimus is a CYP3A and OATP1B substrate, the drug interaction is likely mediated by CYP3A inhibition by ritonavir and OATP1B inhibition by ABT‐450. The effect of the 3D regimen on tacrolimus is similar to the effect of other CYP3A inhibitors on tacrolimus 9, 17, 18, 21.
The tacrolimus dose‐normalized C24 value in the presence of steady‐state 3D regimen was 17‐fold of the dose‐normalized C24 value when tacrolimus was administered alone. In addition, the dose‐normalized C24 value in the presence of steady‐state 3D regimen was 11‐fold of the dose‐normalized C12 value when tacrolimus was administered alone. These results suggest that a typical twice‐daily dose of tacrolimus should not be used in posttransplant patients. Pharmacokinetic simulations indicate that posttransplant patients should receive a tacrolimus dose of 0.5 mg (lowest strength available in the U.S.) every 7 days upon initiation of 3D therapy. This dose is consistent with the expected tacrolimus dose for patients being treated with lopinavir/ritonavir (22). Subsequent tacrolimus dose and dosing frequency modifications during 3D therapy should be informed by the individual's tacrolimus trough concentrations. Upon completion of 3D treatment, the pre‐3D dose of tacrolimus may be resumed 2 days later (due to the greater effect of the 3D regimen on tacrolimus pharmacokinetics and assuming acceptable tacrolimus trough levels determined on that day) and the dose modified thereafter based on further testing of tacrolimus trough levels.
Dosing recommendations for cyclosporine and tacrolimus are based on the assumption that the typical target trough concentration is a reasonable surrogate for total exposure, which is directly related to clinical outcome 20, 23. This strategy has been used in posttransplant patients on boceprevir, telaprevir, or HIV protease inhibitors without a marked increase in hepatic rejection events 22, 24, 25, and in the CORAL I study, in which there were no episodes of rejection 7.
It should be noted that a lower dose of cyclosporine was administered in Period 2 based on anticipated interaction. Hence, dose‐normalized parameters were compared to estimate the drug interaction. Additionally, the C24 value following a single dose of cyclosporine and tacrolimus is not the same as the Ctrough level following steady‐state dosing of cyclosporine and tacrolimus. However, the increase in C24 values following coadministration of a single dose of cyclosporine and tacrolimus with the 3D regimen provides an approximation of the anticipated increase in Ctrough at steady state. For this reason, pharmacokinetic simulations were performed to guide‐dosing recommendations.
Figures 4 and 5 illustrate the timeline from the time a patient undergoes transplant through the first several days of 3D treatment. A fivefold reduction in the total cyclosporine dose administered once daily with the 3D regimen is projected to maintain Ctrough values similar to values observed before 3D treatment, while blunting peak‐to‐trough fluctuations due to increased cyclosporine half‐life. Similarly, a tacrolimus dose of 0.5 mg every 7 days is expected to maintain Ctrough levels within the range observed before initiation of the 3D regimen. If lower Ctrough levels are desired, a tacrolimus dose of 0.5 mg every 14 days could be considered.
Ombitasvir, dasabuvir, dasabuvir M1, and ritonavir exposures were not affected by cyclosporine or tacrolimus to a clinically meaningful extent. Steady‐state ABT‐450 exposures (Cmax and AUC) increased by 44% to 72% in the presence of 30 mg cyclosporine, but this increase is not likely to affect the safety of the 3D regimen in transplant recipients. This is supported by results from a Phase 2 study in HCV‐infected patients in which ABT‐450 doses of 200 mg and 250 mg administered for 12 to 24 weeks, which resulted in ABT‐450 exposures at least twofold greater than those observed in the current studies, were safe and well tolerated 26, 27. Likewise, the ≤ 43% decreases in steady‐state ABT‐450 exposures in the presence of tacrolimus are not expected to affect the safety or efficacy of the 3D regimen in transplant recipients. The effect of tacrolimus on ABT–450 appears to be absorption‐related because the effect is observed after a single dose; however, confirmation of this hypothesis requires further testing. Tacrolimus has also been shown to reduce telaprevir concentrations during coadministration in a limited number of patients 28. Overall, coadministration of cyclosporine or tacrolimus with the 3D regimen was well tolerated in the healthy volunteers in these studies.
In conclusion, the results suggest that initiation of 3D therapy in posttransplant patients should be accompanied by reduced doses and dosing frequencies of cyclosporine or tacrolimus. On average, posttransplant patients who initiate 3D treatment should reduce their total daily cyclosporine dose to one‐fifth of the pre‐3D dose and administer it once daily to achieve cyclosporine Ctrough levels comparable to pre‐3D treatment levels. Similarly, the tacrolimus dose should be reduced to 0.5 mg every 7 days or 0.2 mg every 72 h in posttransplant patients who initiate 3D treatment. Subsequent dose and dosing frequency modifications for cyclosporine or tacrolimus while receiving 3D treatment should be further informed by individual drug level data. These dosing recommendations for cyclosporine and tacrolimus have been successfully employed in the CORAL I study in HCV genotype 1‐infected posttransplant subjects treated with the 3D regimen plus ribavirin for 24 weeks, in which 97.1% of subjects achieved SVR12 and no graft rejections occurred 7.
Disclosure
The authors of this manuscript have conflicts of interest to disclose as described by the American Journal of Transplantation. All authors are AbbVie, Inc. employees and may hold AbbVie stock or options. This manuscript contains information on the investigational products ABT‐450/r, ombitasvir, and dasabuvir.
Acknowledgments
This work was funded by AbbVie, Inc. Interpretation of data and review and approval of the manuscript were performed by AbbVie. The authors would like to thank Leimin Fan, Jun Zhang, and Jill Polzin of AbbVie for analytical support and Lisa Hernandez and Pam Watson of AbbVie and Allison Kitten (freelance writer under contract with AbbVie) for medical writing support. The authors would also like to thank Theresa Brouillard and Jeffrey Arnold for the clinical operations support.
References
- 1. World Health Organization (WHO) . Hepatitis C Wkly Epidemiol Rec. 2011; 86: 445–447. [PubMed] [Google Scholar]
- 2. Pawlotsky JM. Pathophysiology of hepatitis C virus infection and related liver disease. Trends Microbiol. 2004; 12: 96–102. [DOI] [PubMed] [Google Scholar]
- 3. Terrault NA. Treatment of recurrent hepatitis C in liver transplant recipients. Clin Gastroenterol Hepatol. 2005; 3: S125–131. [DOI] [PubMed] [Google Scholar]
- 4. Berenguer M. Natural history of recurrent hepatitis C. Liver Transpl. 2002; 8: S14–18. [DOI] [PubMed] [Google Scholar]
- 5. Feld JJ, Kowdley KV, Coakley E, et al. Treatment of HCV with ABT‐450/r‐ombitasvir and dasabuvir with ribavirin. N Engl J Med. 2014; 370: 1594–1603. [DOI] [PubMed] [Google Scholar]
- 6. Poordad F, Hezode C, Trinh R, et al. ABT–450/r‐ombitasvir and dasabuvir with ribavirin for hepatitis C with cirrhosis. N Engl J Med. 2014; 370: 1973–1982. [DOI] [PubMed] [Google Scholar]
- 7. Mantry P, Kwo P, Coakley E, et al. M12‐999: ABT–450/r/ABT‐267 + ABT‐333 + ribavirin in liver transplant recipients with recurrent HCV genotype 1 infection [abstract 1325]. Am J Transplant. 2014; 14: 3. [Google Scholar]
- 8.Neoral® (cyclosporine) [US package insert]. East Hanover, NJ; Novartis, May 2013. Available at: https://www.pharma.us.novartis.com/product/pi/pdf/neoral.pdf. Accessed September 9, 2014.
- 9.Prograf® (tacrolimus) [US package insert]. Northbrook, IL; Astellas Pharma US, Inc., September 2013. Available at: http://www.astellas.us/docs/prograf.pdf. Accessed September 9, 2014.
- 10. Krishna R, Bergman A, Larson P, et al. Effect of a single cyclosporine dose on the single‐dose pharmacokinetics of sitagliptin (MK‐0431), a dipeptidyl peptidase‐4 inhibitor, in healthy male subjects. J Clin Pharmacol. 2007; 47: 165–174. [DOI] [PubMed] [Google Scholar]
- 11. Kalliokoski A, Niemi M. Impact of OATP transporters on pharmacokinetics. Br J Pharmacol. 2009; 158: 693–705. [DOI] [PMC free article] [PubMed] [Google Scholar]
- 12.Norvir® (ritonavir) [US package insert]. North Chicago, IL; AbbVie Inc., November 2013. Available at: http://www.rxabbvie.com/pdf/norvirtab_pi.pdf. Accessed September 09, 2014.
- 13. Zhang L, Strong JM, Qiu W, Lesko LJ, Huang S‐M. Scientific perspectives on drug transporters and their role in drug interactions. Mol. Pharm. 2006; 3: 62–66. [DOI] [PubMed] [Google Scholar]
- 14. Bow DAJ, Liu J, Kavetskaia O, et al. A mechanistic non‐clinical assessment of drug‐drug interactions (metabolism and transporters) with the hepatitis C virus (HCV) regimen: ABT‐450/r, ombitasvir and dasabuvir. Poster presented at: 2014 American Association for the Study of Liver Diseases/European Association for the Study of the Liver Special Conference on Hepatitis C; 2014; Sept. 12—13; New York, NY.
- 15. Berenguer M. Management of hepatitis C virus in the transplant patient. Clin Liver Dis. 2007; 11: 355–376. [DOI] [PubMed] [Google Scholar]
- 16. Campana C, Regazzi MB, Buggia I, Molinaro M. Clinically significant drug interactions with cyclosporin. An update. Clin Pharmacokinet. 1996; 30: 141–179. [DOI] [PubMed] [Google Scholar]
- 17. Amundsen R, Åsberg A, Ohm IK, Christensen H. Cyclosporine A‐ and tacrolimus‐mediated inhibition of CYP3A4 and CYP3A5 in vitro. Drug Metab Dispos. 2012; 40: 655–661. [DOI] [PubMed] [Google Scholar]
- 18. Nara M, Takahashi N, Miura M, et al. Effect of itraconazole on the concentrations of tacrolimus and cyclosporine in the blood of patients receiving allogeneic hematopoietic stem cell transplants. Eur J Clin Pharmacol. 2013; 69: 1321–1329. [DOI] [PubMed] [Google Scholar]
- 19. Bernstein B, Menon R, Klein CE, et al. Pharmacokinetics, safety and tolerability of the HCV protease inhibitor ABT‐450 with ritonavir following multiple ascending doses in healthy adult volunteers [abstract 58]. Global Antiviral J. 2009; 5; 53 Available at: http://www.informedhorizons.com/hepdart2009/pdf/AbstractBook_HEPDART09_sent.pdf. Accessed September 17, 2014. [Google Scholar]
- 20. Vogel M, Voigt E, Michaelis HC, et al. Management of drug‐to‐drug interactions between cyclosporine A and the protease‐inhibitor lopinavir/ritonavir in liver‐transplanted HIV‐infected patients. Liver Transpl. 2004; 10: 939–944. [DOI] [PubMed] [Google Scholar]
- 21. Christians U, Jacobsen W, Benet LZ, Lampen A. Mechanisms of clinically relevant drug interactions associated with tacrolimus. Clin Pharmacokinet. 2002; 41: 813–851. [DOI] [PubMed] [Google Scholar]
- 22. Jain AB, Venkataramanan R, Eghtesad B, et al. Effect of coadministered lopinavir and ritonavir (Kaletra) on tacrolimus blood concentration in liver transplantation patients. Liver Transpl. 2003; 9: 954–960. [DOI] [PubMed] [Google Scholar]
- 23. Undre NA. Pharmacokinetics of tacrolimus‐based combination therapies. Nephrol Dial Transplant. 2003; 18: i12–15. [DOI] [PubMed] [Google Scholar]
- 24. Coilly A, Roche B, Dumortier J, et al. Safety and efficacy of protease inhibitors to treat hepatitis C after liver transplantation: a multicenter experience. J Hepatol. 2014; 60: 78–86. [DOI] [PubMed] [Google Scholar]
- 25. Kwo PY, Ghabril M, Lacerda MA, Joseph Tector A, Fridell JA, Vianna R. Telaprevir with peginterferon/ribavirin for retreatment of null responders with advanced fibrosis post‐orthotopic liver transplant. Clin Transplant. 2014; 28: 722–727. [DOI] [PubMed] [Google Scholar]
- 26. Kowdley KV, Lawitz E, Poordad F, et al. Safety and efficacy of interferon‐free regimens of ABT‐450/r, ABT‐267, ABT‐333 +/− ribavirin in patients with chronic HCV GT1 infection: results from the AVIATOR study [abstract 3]. J Hepatol. 2013; 58: S2. [Google Scholar]
- 27. Poordad F, Lawitz E, Kowdley KV, et al. Exploratory study of oral combination antiviral therapy for hepatitis C. N Engl J Med. 2013; 368: 45–53. [DOI] [PubMed] [Google Scholar]
- 28. Farnik H, Zimmermann T, Herrmann E, et al. Telaprevir drug monitoring during antiviral therapy of hepatitis C graft infection after liver transplantation. Liver Int. 2014; Mar 20. doi: 10.1111/liv.12532. [Epub ahead of print]. [DOI] [PubMed] [Google Scholar]