

Abstract
Purpose
Hyporesponsiveness to erythropoiesis‐stimulating agents (ESAs) is clinically and economically important in the treatment of anaemia in chronic kidney disease (CKD) patients. Previous studies focused on baseline predictors of ESA hyporesponsiveness, rather than factors associated with the transition to this state. Reversibility of ESA hyporesponsiveness has also not been studied previously.
Methods
Case‐crossover methodology was applied to a cohort of 6645 European CKD patients undergoing haemodialysis and prescribed ESAs. Ninety‐day ESA exposure periods were defined, haemoglobin (Hb) response was calculated using the last 30 days of one period and the first 30 days of the next, and periods were classified based on a median ESA dose (80.8 IU/kg/week) and a 10 g/dL Hb threshold. Clinical, dialysis and laboratory data from patients' first hyporesponsive ‘case’ period was compared with the preceding responsive ‘control’ period using conditional logistic regression. A similar approach was applied to hyporesponsiveness reversal.
Results
Of the patients, 672 experienced hyporesponsiveness periods with preceding responsive periods; 711 reversed to normality from hyporesponsiveness periods. Transition to hyporesponsiveness was associated with hospitalization, vascular access changes or worsening inflammation, with these factors accounting for over two‐thirds of transitions. Findings were largely insensitive to alternative ESA doses and Hb thresholds. Continued hospitalization, catheter insertion and uncontrolled secondary hyperparathyroidism were associated with a lack of regain of responsiveness.
Conclusions
Transition to hyporesponsiveness is linked to the development of conditions such as hospitalization events, vascular access issues or episodes of systemic inflammation. However, a third of hyporesponsive episodes remain unexplained. © 2015 The Authors. Pharmacoepidemiology and Drug Safety published by John Wiley & Sons Ltd.
Keywords: anaemia, CKD, erythropoietin, Europe, haemodialysis, hyporesponsiveness, pharmacoepidemiology
Introduction
Mammalian kidneys fulfill a major endocrine function in producing erythropoietin to maintain a stable haemoglobin (Hb)‐dependent oxygen transport capacity and red blood cell (RBC) mass, compensating, through erythropoiesis, for the daily ongoing loss of erythrocytes (normally ~1% per day1); the hormonal secretion is inversely proportional to oxygen availability to the renal cortex, so that an effective feedback loop is established.2 Erythropoietin production decreases with declining kidney function,3, 4 meaning that severe anaemia is a frequent complication in chronic kidney disease patients, where insufficient compensatory erythropoiesis occurs in the face of increased erythrocytes loss5 and a shortened RBC half‐life.6, 7 Prior to the mid‐1980s, renal anaemia was managed with regular blood transfusions, which increased patients' infection risk, induced progressive iron overload and decreased their chances of a successful kidney transplant due to allosensitization; advances in recombinant DNA technology following the isolation and cloning of the gene for human erythropoietin in 1983 mean that erythropoiesis‐stimulating agents (ESAs), along with iron, now form the cornerstone of the treatment of anaemia in chronic kidney disease (CKD) patients.8
The lack of response to ESA therapy (ESA hyporesponsiveness), which occurs in a small, but important minority of CKD patients, has important clinical and economic implications. ESA doses are titrated according to changes in Hb level, and specific Hb targets encourage progressive increases in ESA dosing in patients with poor response below‐target haemoglobin concentrations, leading to a skewed distribution of ESA doses in dialysis patients and hence costs: approximately 50% of total ESA costs are spent on the 15% of patients requiring the highest dosage.9 Observational studies showed that patients requiring the highest doses of ESA therapy relative to haemoglobin response experience poorer outcomes.10 Post hoc analyses of clinical trial data11, 12, 13 demonstrated a positive correlation between hyporesponsiveness and adverse outcomes, with the most hyporesponsive patients experiencing the highest rate of death and/or cardiovascular events. Several smaller studies have provided additional evidence of the clinical importance of ESA hyporesponsiveness in haemodialysis patients.14, 15, 16, 17 Many of these studies were cross‐sectional and examined the relationship between ESA hyporesponsiveness and outcomes at a particular point in time. Common to all these studies, it was impossible to discriminate between a causal link between higher ESA doses and poorer outcomes or whether the effect was simply due to confounding‐by‐indication.
Risk factors for ESA hyporesponsiveness have been well described over the last two decades and include iron insufficiency,18, 19 vascular access changes,15, 20 hospitalization,15, 21 inflammation,22, 23, 24, 25, 26 malnutrition,23, 27 along with a number of less frequent causes such as blood loss, haemolysis, bone marrow disorders, haemoglobinopathies and neutralizing antibodies to ESAs.28, 29, 30, 31 These studies have focused on baseline predictors for hyporesponsiveness and hence have been unable to distinguish between factors stably associated with certain patients and risk factors immediately preceding the development of hyporesponsiveness. In fact, given the life‐time of RBCs7 and the time‐lag between a change in ESA dose and haemoglobin response,32 there are relevant time intervals that published analyses have not accounted for to date.
The present study aimed to gain a fresh perspective on factors driving ESA hyporesponsiveness by applying case‐crossover methodology33 to examine transient factors associated with patients becoming hyporesponsive to ESA therapy in a large European haemodialysis cohort. We hypothesized that pathophysiological changes within the patients gave rise to periods of ESA hyporesponsiveness; the case‐crossover methodology, which has been used extensively in the field of pharmacoepidemiology34, 35, 36 and seeks to address the ‘why now?’ rather than the ‘why me?’ questions,37 is best suited to examine the effect of such transient exposures on outcomes of interest. Furthermore, we introduced a time‐lag approach to account for changes in ESA dose and subsequent haemoglobin response.32 Finally, we examined factors associated with recovering from periods of hyporesponsiveness.
Subjects and Methods
Study population
The Analyzing Data, Recognizing Excellence, and Optimizing Outcome (ARO) research initiative has been described previously.38 Briefly, 8963 haemodialysis patients in 134 Fresenius Medical Care facilities in 2005 and 2006 were selected randomly from nine European countries and from Turkey. AROi was designed as an open cohort to recruit a heterogeneous mix of incident and prevalent dialysis patients and to maintain a fixed period of follow‐up (approximately 15 000 person‐years); patients leaving the study through death or censoring were replaced with randomly selected patients from the same facility. Patients' demographic characteristics and clinical history were captured on admission, whilst detailed information on dialysis, laboratory testing, medications and clinical outcomes were captured throughout follow‐up.
Data preparation
Data preparation, conducted in SAS for Unix (version 9.1.3; SAS, Cary, NC, USA) and reproduced independently by a second programmer, was restricted to non‐United Kingdom patients (medication data were unavailable for this country) prescribed ESAs. Darbepoetin alfa doses were converted to epoetin alfa equivalents using a 1:200 dose conversion ratio.39 Patients' follow‐up times (defined as study start [cohort entry] until censoring by transplantation, loss to follow‐up or death) were divided into consecutive 90‐day periods of weight‐adjusted weekly exposure to ESAs (henceforth ‘ESA exposure periods'; Figure 1). For each ESA exposure period, summary data on hospitalization, dialysis and laboratory parameters were captured for each patient (Supporting Information, Table S1). Response to ESA, operationally defined by mean haemoglobin levels, was evaluated for the last 30 days of one ESA exposure and the first 30 days of the next (henceforth the ‘haemoglobin observation periods'). This time frame was chosen according to the observed time‐lag to elicit a response in Hb concentration to ESAs and the reduced RBC half‐life in haemodialysis patients.7, 32, 40 Together, these data were used to define response to ESAs according to a coding algorithm (Box 1). In the final step of data generation, each patient's follow‐up time was considered sequentially. Where patients' first period of ESA hyporesponsiveness was immediately preceded by an ESA response period, these time periods were coded as the ‘case’ and ‘control’ periods, respectively, and subsequent follow‐up was ignored. Similarly, for the reversibility analyses, patients' first period of ESA response was coded as the case period if it was preceded by a period of ESA hyporesponsiveness.
Figure 1.
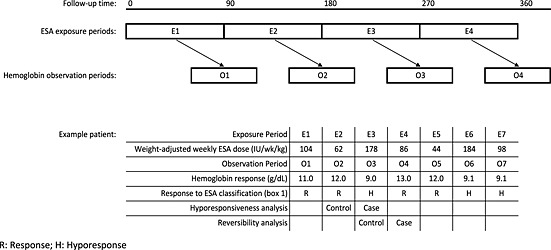
Schematic diagram of ESA exposure (E) and haemoglobin observation (O) periods for a hypothetical patient, with subsequent classification of ESA response in the main analysis
Box 1 Classification of patients' ESA response
❖ Haemoglobin value available in observation period:
➢ Haemoglobin above threshold under investigation:
▪ Define as ‘Responsive’ regardless of the ESA value
➢ Haemoglobin below threshold under investigation:
▪ ESA value available:
• Define as ‘Hyporesponsive’ if ESA dose > threshold under investigation
• Define as ‘Undertreated’ if ESA < threshold under investigation
▪ ESA value unavailable:
• Define period as ‘Undefined responsiveness—missing ESA’
❖ Haemoglobin value unavailable in observation period:
➢ ESA value available :
▪ Define as ‘Undefined responsiveness—missing haemoglobin’
➢ ESA value unavailable:
▪ Define as ‘Undefined responsiveness—missing both’
❖ ESA exposure period less than 90 days:
▪ Define as ‘Short period’
Statistical analyses
All statistical analyses were performed in SAS for Windows (version 9.2; SAS, Cary, NC, USA) and were reproduced independently by a second statistician. Initially, case and control periods were compared by univariate analyses, with conditional odds ratios and 95% confidence intervals (CIs) calculated for each explanatory variable. Stepwise conditional logistic regression was then applied to obtain maximum likelihood estimates of the effect of exposures on the outcome whilst controlling for potential confounding. Variables significant at the 10% level on univariate analysis were considered for entry into the multivariate model, whereas a likelihood ratio test significance level of 5% was required for retention. Population Attributable Risk Fractions – in this study, the proportion of transitions to hyporesponsiveness that would not have occurred in the absence of a particular risk factor – were calculated for factors independently associated with transition to hyporesponsiveness, as described for case‐crossover studies by Spurling and Vinson.41 Missing values, coded as such in the explanatory data, were excluded from the univariate analysis but included in the multivariate analysis. Where required, correlations between explanatory variables were assessed visually and by calculating Pearson's correlation coefficients.
Sensitivity analyses
For the main analysis, an ESA cut‐off based on the median weight‐adjusted weekly ESA dose (80.8 IU/kg/week) was applied and compared with a haemoglobin threshold of 10 g/dL. To test the robustness of the findings to variations in hyporesponsiveness definition, additional analyses were conducted examining combinations of the above criteria with an upper quartile of weight‐adjusted weekly ESA dose (140.4 IU/kg/week) and a haemoglobin threshold of 9 g/dL. Furthermore, due to known associations between ESA hyporesponsiveness and gender,42, 43 the main analyses (median ESA cut‐off; haemoglobin 10 g/dL) were performed separately for male and female patients. All sensitivity analyses were limited to univariate analysis.
Results
Study population
Between 01 January 2005 and 31 December 2006, 11 153 patients were recruited from 134 Fresenius Medical Care facilities in nine European countries. Patients recruited from centers where the majority of data on key dialysis parameters (i.e. actual blood flow or dialysis adequacy [Kt/V]) were missing were excluded (N = 1352), and patients from the UK (N = 838) were also excluded as information on medication was unavailable, leaving 8963 patients. Data were sequentially limited further to patients prescribed ESAs (N = 8393; 93.6%), where the standardized weekly dose was greater than zero (8271; 98.5%) and where follow‐up was ≥90 days duration (n = 6645; 80.3%). The baseline characteristics of this population are shown in Table S2 in the Supporting Information.
These patients contributed 45 027 ESA exposure periods (range two to nine periods, median 8), with 9964 person‐years of exposure accrued. The final ESA exposure period was excluded for 6600 patients as it was less than 90 days in length (range 1–89 days; median 10 days), leaving 38 427 observation periods. Applying a median ESA dose cut‐off (80.8 IU/kg/wk) and a haemoglobin threshold of 10 g/dL, over three quarters of ESA exposure periods were followed by periods of haemoglobin response (29,076; 75.7%). Almost five percent resulted in periods of hyporesponsiveness (1795; 4.7%), whilst slightly fewer periods of undertreatment were observed (1582; 4.1%). It was not possible to assign a responsiveness status for over 15% of periods (missing haemoglobin 2264 (5.9%); missing ESA 605 (1.6%); missing both 3105 (8.1%)) and the proportion of patients with at least one unassigned responsiveness status increased with follow‐up length (Supporting Information, Figure S1). Accordingly, whilst 2656 (40.0%) and 69 (1.0%) patients were responsive and hyporesponsive, respectively, throughout their follow‐up, these patients tended to have shorter follow‐up periods. Six hundred and seventy‐two patients experienced periods of hyporesponsiveness with preceding periods of response, 711 experienced periods of response with preceding periods of hyporesponsiveness and 471 patients experienced both.
Risk factors for hyporesponsiveness
In the univariate analysis, periods of hyporesponsiveness were more likely to occur following periods of hospitalization or changes in vascular access (Table 1). Where the type of vascular access change was considered, a change from an arteriovenous (AV) fistula or a graft to a catheter was associated with an increased risk, whereas a change in the opposite direction had no effect on the likelihood of hyporesponsiveness. Increasing levels of ferritin and C‐reactive protein and decreasing levels of serum albumin increased the likelihood of hyporesponsiveness. During ‘case’ hyporesponsive periods, ferritin was not correlated with CRP, and only weakly correlated with serum albumin (Figure 2). Overall, interdialytic weight gain appeared to reduce the risk, but only a single strata was significant. When considered in a multivariate analysis, vascular access change, hospitalization, CRP and ferritin were associated with a transition to ESA hyporesponsiveness. Of these factors, high ferritin levels made the greatest overall contribution to transitioning to hyporesponsiveness, with Population Attributable Risk Fractions for the 500–799 and ≥800 µg/L strata of 13.4% and 17.0%, respectively. High CRP levels (upper quartile) also contributed greatly (17.7%), as did hospitalization (16.3%), whilst a vascular access change from a graft or fistula to a catheter made a small contribution (3.5%). Combined, these factors accounted for 67.9% of all transitions to hyporesponsiveness in this study.
Table 1.
Risk factors for development of ESA hyporesponsiveness in a cohort of European Haemodialysis patients (N = 672) [univariate and multivariate analysis]
| Parameters | Period | Univariate | Multivariate | |||
|---|---|---|---|---|---|---|
| Case | Control | OR* [95%CI†] | p‐value | OR [95%CI] | p‐value | |
| Vascular access change (vs. none) | ||||||
| No change | 630 (93.8) | 657 (97.8) | 1 | —‡ | ||
| Any change | 42 (6.3) | 15 (2.2) | 3.08 [1.65, 5.75] | <0.001 | — | |
| No change | 655 (97.5) | 664 (98.8) | 1 | — | ||
| Catheter to fistula or graft | 17 (2.5) | 8 (1.2) | 2.12 [0.92, 4.92] | 0.079 | — | |
| No change | 637 (94.8) | 663 (98.7) | 1 | — | ||
| Fistula or graft to catheter | 35 (5.2) | 9 (1.3) | 3.89 [1.87, 8.09] | <0.001 | — | |
| Vascular access category (vs. no change)§ | ||||||
| No change | 630 (93.8) | 657 (97.8) | —‡ | 1 | ||
| Catheter to fistula or graft | 17 (2.5) | 8 (1.2) | — | 1.50 [0.45, 4.99] | 0.021 | |
| Fistula or graft to catheter | 35 (5.2) | 9 (1.3) | — | 2.96 [1.36, 6.46] | ||
| Dialysis adequacy (Kt/V) | ||||||
| Q1 (low) | 115 (18.0) | 110 (17.4) | 1 | |||
| Q2 | 171 (26.8) | 154 (24.4) | 1.09 [0.71, 1.65] | 0.122 | ||
| Q3 | 147 (23.0) | 175 (27.7) | 0.74 [0.46, 1.20] | |||
| Q4 (high) | 205 (32.1) | 192 (30.4) | 1.09 [0.65, 1.84] | |||
| Interdialytic weight change [kg] | ||||||
| <0 (i.e. weight loss) | 33 (6.1) | 20 (3.6) | 1.49 [0.75, 2.98] | 0.013 | ||
| 0–1 | 126 (23.3) | 121 (21.9) | 1 | |||
| 2–3 | 184 (34.0) | 168 (30.4) | 1.02 [0.69, 1.51] | |||
| 3–4 | 130 (24.0) | 167 (30.2) | 0.60 [0.39, 0.92] | |||
| ≥4 (high weight gain) | 68 (12.6) | 77 (13.9) | 0.63 [0.37, 1.09] | |||
| Hospitalization (vs. none) | ||||||
| None | 506 (75.3) | 584 (86.9) | 1 | 1 | ||
| Any | 166 (24.7) | 88 (13.1) | 3.17 [2.18, 4.61] | <0.001 | 2.95 [1.99, 4.36] | <0.001 |
| C‐Reactive Protein [mg/L] | ||||||
| Q1 (low) | 95 (20.9) | 104 (24.1) | 1 | 1 | ||
| Q2 | 98 (21.6) | 91 (21.1) | 1.20 [0.74, 1.95] | 0.004 | 1.31 [0.84, 2.05] | 0.012 |
| Q3 | 102 (22.5) | 126 (29.2) | 1.01 [0.57, 1.80] | 1.10 [0.67, 1.80] | ||
| Q4 (high) | 159 (35.0) | 110 (25.5) | 2.44 [1.30, 4.57] | 2.02 [1.20, 3.38] | ||
| Ferritin [µg/L] | ||||||
| <100 | 40 (6.6) | 52 (8.8) | 1 | 1 | ||
| 100–<500 | 271 (44.9) | 295 (49.8) | 1.26 [0.67, 2.37] | 0.005 | 1.52 [0.84, 2.76] | 0.006 |
| 500–799 | 148 (24.5) | 133 (22.5) | 2.19 [1.07, 4.49] | 2.21 [1.14, 4.31] | ||
| ≥800 | 144 (23.9) | 112 (18.9) | 3.05 [1.36, 6.85] | 3.46 [1.64, 7.27] | ||
| TSAT [%] | ||||||
| <20 | 297 (67.5) | 300 (69.9) | 1.19 [0.81, 1.74] | 0.38 | ||
| ≥20 | 143 (32.5) | 129 (30.1) | 1 | |||
| Serum albumin [g/dL] | ||||||
| Q1 (high) | 71 (12.7) | 95 (17.0) | 1 | |||
| Q2 | 156 (27.9) | 164 (29.4) | 1.63 [0.93, 2.85] | 0.026 | ||
| Q3 | 139 (24.9) | 126 (22.6) | 2.26 [1.20, 4.24] | |||
| Q4 (low) | 193 (34.5) | 173 (31.0) | 2.78 [1.40, 5.52] | |||
| Cholesterol [mmol/L] | ||||||
| Q1 (low) | 167 (32.8) | 153 (30.4) | 1.57 [0.85, 2.88] | 0.031 | ||
| Q2 | 126 (24.8) | 114 (22.6) | 1 | |||
| Q3 | 115 (22.6) | 134 (26.6) | 0.56 [0.34, 0.93] | |||
| Q4 (high) | 101 (19.8) | 103 (20.4) | 0.62 [0.32, 1.20] | |||
| Calcium [mg/dL] | ||||||
| <8.4 | 103 (15.7) | 109 (17.0) | 0.77 [0.50, 1.18] | 0.177 | ||
| 8.4–9.5 | 374 (56.8) | 342 (53.4) | 1 | |||
| >9.5 | 181 (27.5) | 190 (29.6) | 0.76 [0.53, 1.08] | |||
| Phosphate [mg/dL] | ||||||
| <3.5 | 130 (20.2) | 114 (18.0) | 1.44 [0.96, 2.18] | 0.071 | ||
| 3.5–5.5 | 354 (55.0) | 346 (54.6) | 1 | |||
| >5.5 | 160 (24.8) | 174 (27.4) | 0.78 [0.55, 1.11] | |||
| PTH [pg/mL] | ||||||
| <75 | 99 (21.2) | 93 (20.1) | 1.34 [0.68, 2.64] | 0.028 | ||
| 75–<150 | 115 (24.6) | 103 (22.2) | 1.54 [0.90, 2.64] | |||
| 150–300 | 112 (23.9) | 108 (23.3) | 1 | |||
| 300–<600 | 78 (16.7) | 96 (20.7) | 0.82 [0.50, 1.37] | |||
| 600–<800 | 24 (5.1) | 15 (3.2) | 2.59 [0.76, 8.81] | |||
| >800 | 40 (8.5) | 48 (10.4) | 0.33 [0.10, 1.11] | |||
Conditional odds ratio.
Confidence interval.
Not estimated in this analysis.
Where patients experienced both changes ‘graft/fistula to catheter' takes precedence over ‘catheter to graft/fistula’; quartiles thresholds are provided in Table S1 in the Supporting Information.
Figure 2.
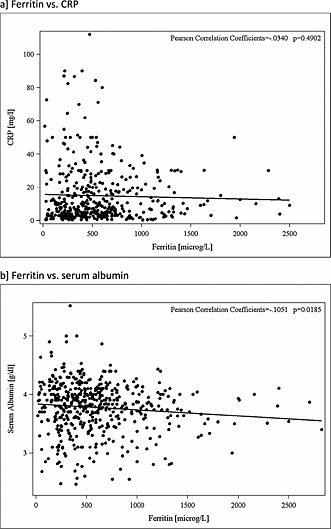
Relationship between (a) ferritin and CRP and (b) ferritin and serum albumin in ‘case’ ESA hyporesponsive periods in a cohort of European haemodialysis patients. Data trimmed at the 1% and 99% levels
Predictive factors for reversal of hyporesponsive status
The analyses examining factors predictive of reversal of hyporesponsive status mirrored the hyporesponsiveness analysis to an extent, in that hospitalization was inversely associated with transitioning from hyporesponsive to responsive (i.e. remaining in hospital increased the likelihood of remaining hyporesponsive; Table 2). Similarly, a change in vascular access from an AV fistula or a graft to a catheter was associated with remaining hyporesponsive. Conversely, no association was observed with levels of ferritin or serum albumin. Instead, reversibility was weakly associated with cholesterol concentrations and strongly associated with levels of parathyroid hormone. Of these factors, only hospitalization, cholesterol and parathyroid hormone were independently associated with a lack of reversibility from a hyporesponsive state.
Table 2.
Risk factors for ESA hyporesponsiveness reversibility in a cohort of European Haemodialysis patients (N = 711) [univariate and multivariate analysis]
| Parameters | Periods | Univariate | Multivariate | |||
|---|---|---|---|---|---|---|
| Case | Control | OR* [95%CI†] | p‐value | OR [95%CI] | p‐value | |
| Vascular access change (vs. none) | ||||||
| No change | 686 (96.5) | 669 (94.1) | 1 | —‡ | ||
| Any change | 25 (3.5) | 42 (5.9) | 0.45 [0.24, 0.85] | 0.014 | — | |
| No change | 693 (97.5) | 689 (96.9) | 1 | — | ||
| Catheter to fistula or graft | 18 (2.5) | 22 (3.1) | 0.81 [0.43, 1.53] | 0.517 | — | |
| No change | 699 (98.3) | 682 (95.9) | 1 | — | ||
| Fistula or graft to catheter | 12 (1.7) | 29 (4.1) | 0.39 [0.20, 0.79] | 0.009 | — | |
| Dialysis adequacy (Kt/V) | ||||||
| Q1 (low) | 125 (18.3) | 133 (19.6) | 1 | |||
| Q2 | 181 (26.5) | 161 (23.8) | 1.30 [0.86, 1.94] | 0.317 | ||
| Q3 | 181 (26.5) | 176 (26.0) | 1.14 [0.71, 1.82] | |||
| Q4 (high) | 197 (28.8) | 207 (30.6) | 0.89 [0.51, 1.53] | |||
| Interdialytic weight change [kg] | ||||||
| <0 (i.e. weight loss) | 30 (5.2) | 33 (5.8) | 0.83 [0.44, 1.56] | 0.329 | ||
| 0–1 | 145 (25.0) | 132 (23.0) | 1 | |||
| 2–3 | 173 (29.8) | 198 (34.6) | 0.78 [0.54, 1.12] | |||
| 3–4 | 141 (24.3) | 132 (23.0) | 1.03 [0.68, 1.58] | |||
| ≥4 (high weight gain) | 92 (15.8) | 78 (13.6) | 1.18 [0.70, 1.98] | |||
| Hospitalization (vs. none) | ||||||
| None | 592 (83.3) | 529 (74.4) | 1 | 1 | ||
| Any | 119 (16.7) | 182 (25.6) | 0.45 [0.32, 0.62] | <0.001 | 0.45 [0.32, 0.63] | <0.001 |
| C‐Reactive Protein [mg/L] | ||||||
| Q1 (low) | 87 (18.6) | 91 (19.7) | 1 | |||
| Q2 | 87 (18.6) | 98 (21.3) | 0.93 [0.54, 1.60] | 0.434 | ||
| Q3 | 132 (28.2) | 113 (24.5) | 1.41 [0.78, 2.52] | |||
| Q4 (high) | 162 (34.6) | 159 (34.5) | 1.21 [0.66, 2.21] | |||
| Ferritin [µg/L] | ||||||
| <100 | 72 (11.2) | 62 (10.0) | 1 | |||
| 100–<500 | 278 (43.2) | 273 (44.1) | 0.80 [0.45, 1.45] | 0.841 | ||
| 500–799 | 140 (21.7) | 144 (23.3) | 0.76 [0.38, 1.52] | |||
| ≥800 | 154 (23.9) | 140 (22.6) | 0.86 [0.39, 1.90] | |||
| Transferrin Saturation (TSAT) [%] | ||||||
| <20 | 283 (57.6) | 273 (60.3) | 1.15 [0.81, 1.63] | 0.425 | ||
| ≥20 | 208 (42.4) | 180 (39.7) | 1 | |||
| Serum albumin [g/dL] | ||||||
| Q1 (high) | 87 (14.0) | 82 (13.8) | 1 | |||
| Q2 | 164 (26.4) | 154 (25.8) | 0.97 [0.61, 1.54] | 0.337 | ||
| Q3 | 150 (24.2) | 133 (22.3) | 0.91 [0.53, 1.58] | |||
| Q4 (low) | 220 (35.4) | 227 (38.1) | 0.67 [0.38, 1.20] | |||
| Cholesterol [mmol/L] | ||||||
| Q1 (low) | 222 (40.1) | 172 (33.1) | 1.46 [0.89, 2.40] | 0.099 | 1.78 [1.19, 2.67] | 0.013 |
| Q2 | 125 (22.6) | 133 (25.6) | 1 | 1 | ||
| Q3 | 118 (21.3) | 119 (22.9) | 0.77 [0.47, 1.25] | 1.02 [0.67, 1.54] | ||
| Q4 (high] | 89 (16.1) | 96 (18.5) | 0.60 [0.32, 1.14] | 0.93 [0.55, 1.58] | ||
| Calcium [mg/dL] | ||||||
| <8.4 | 109 (16.0) | 128 (18.7) | 0.74 [0.50, 1.10] | 0.115 | ||
| 8.4–9.5 | 377 (55.2) | 375 (54.7) | 1 | |||
| >9.5 | 197 (28.8) | 183 (26.7) | 1.29 [0.90, 1.85] | |||
| Phosphate [mg/dL] | ||||||
| <3.5 | 142 (20.8) | 151 (22.1) | 0.88 [0.60, 1.28] | 0.281 | ||
| 3.5–5.5 | 360 (52.6) | 369 (54.0) | 1 | |||
| >5.5 | 182 (26.6) | 163 (23.9) | 1.27 [0.91, 1.78] | |||
| PTH [pg/mL] | ||||||
| <75 | 115 (23.2) | 100 (20.8) | 1.21 [0.64, 2.29] | 0.032 | 0.96 [0.58, 1.61] | 0.044 |
| 75–<150 | 106 (21.4) | 111 (23.1) | 0.98 [0.60, 1.61] | 0.80 [0.52, 1.24] | ||
| 150–<300 | 124 (25.0) | 106 (22.1) | 1 | 1 | ||
| 300–<600 | 96 (19.4) | 85 (17.7) | 0.76 [0.43, 1.34] | 0.81 [0.50, 1.30] | ||
| 600–<800 | 24 (4.8) | 30 (6.3) | 0.26 [0.10, 0.71] | 0.46 [0.22, 0.95] | ||
| >800 | 31 (6.3) | 48 (10.0) | 0.16 [0.05, 0.51] | 0.26 [0.12, 0.58] | ||
Odds ratio.
Confidence interval.
Not estimated in this analysis; quartiles thresholds are provided in Table S1 of the Supporting Information.
Sensitivity analyses
Varying the definition of ESA response with different combinations of ESA exposure cut‐off and/or haemoglobin thresholds had little effect on the findings (Table 3). Results were generally consistent across the different analyses in terms of the magnitude and direction of the conditional odds ratios generated, but it is possible that the smaller sample size in the final analysis (upper quartile of ESA dose; 10 g/dL haemoglobin response) may have reduced precision. Findings did not differ by gender (data not shown).
Table 3.
Risk factors for ESA hyporesponsiveness in a cohort of European haemodialysis patients when applying different cut‐offs for ESA dose and haemoglobin (univariate analysis]
| Conditional odds ratio [95% confidence intervals] | ||||
|---|---|---|---|---|
| ESA cut‐off [UI/kg/week]: | Median [80.8] | Upper quartile [140.4] | ||
| Hb cut‐off [g/dL]: | 10 | 9 | 10 | 9 |
| N | 672 | 301 | 359 | 181 |
| Vascular access change (vs. none] | ||||
| No change | 1 | 1 | 1 | 1 |
| Any change | 3.08 [1.65, 5.75] | 3.40 [1.25, 9.22] | 2.20 [1.04, 4.65] | 2.25 [0.69, 7.31] |
| No change | 1 | 1 | 1 | 1 |
| Catheter to fistula or graft | 2.12 [0.92, 4.92] | 1.75 [0.51, 5.98] | 1.57 [0.61, 4.05] | 2.00 [0.50, 8.00] |
| No change | 1 | 1 | 1 | 1 |
| Fistula or graft to catheter | 3.89 [1.87, 8.09] | 3.75 [1.24, 11.30] | 2.71 [1.14, 6.46] | 1.75 [0.51, 5.98] |
| Dialysis adequacy (Kt/V] | ||||
| Q1 (low] | 1 | 1 | 1 | 1 |
| Q2 | 1.09 [0.71, 1.65] | 0.65 [0.34, 1.23] | 1.04 [0.56, 1.91] | 0.63 [0.26, 1.55] |
| Q3 | 0.74 [0.46, 1.20] | 0.58 [0.28, 1.21] | 0.67 [0.33, 1.34] | 0.69 [0.26, 1.84] |
| Q4 (high] | 1.09 [0.65, 1.84] | 0.78 [0.35, 1.76] | 0.84 [0.39, 1.80] | 0.63 [0.22, 1.85] |
| Interdialytic weight change [kg] | ||||
| <0 (i.e. weight loss] | 1.49 [0.75, 2.98] | 0.92 [0.37, 2.30] | 0.54 [0.19, 1.55] | 1.42 [0.42, 4.75] |
| 0–1 | 1 | 1 | 1 | 1 |
| 2–3 | 1.02 [0.69, 1.51] | 0.52 [0.28, 0.97] | 0.84 [0.49, 1.44] | 0.85 [0.38, 1.87] |
| 3–4 | 0.60 [0.39, 0.92] | 0.89 [0.45, 1.77] | 0.77 [0.43, 1.40] | 1.20 [0.50, 2.90] |
| ≥4 (high weight gain) | 0.63 [0.37, 1.09] | 0.78 [0.35, 1.76] | 0.85 [0.40, 1.80] | 1.26 [0.46, 3.46] |
| Hospitalization (vs. none] | ||||
| None | 1 | 1 | 1 | 1 |
| Any | 3.17 [2.18, 4.61] | 2.41 [1.47, 3.96] | 2.81 [1.71, 4.62] | 2.62 [1.38, 4.96] |
| C‐Reactive Protein [mg/L] | ||||
| Q1 (low] | 1 | 1 | 1 | 1 |
| Q2 | 1.20 [0.74, 1.95] | 1.68 [0.69, 4.11] | 1.53 [0.75, 3.15] | 1.57 [0.46, 5.33] |
| Q3 | 1.01 [0.57, 1.80] | 2.34 [0.87, 6.24] | 0.94 [0.40, 2.20] | 1.43 [0.42, 4.90] |
| Q4 (high] | 2.44 [1.30, 4.57] | 4.13 [1.35, 12.61] | 2.04 [0.81, 5.14] | 2.93 [0.75, 11.38] |
| Ferritin [µg/L] | ||||
| <100 | 1 | 1 | 1 | 1 |
| 100–<500 | 1.26 [0.67, 2.37] | 1.54 [0.60, 3.96] | 1.38 [0.64, 2.98] | 1.30 [0.45, 3.73] |
| 500–799 | 2.19 [1.07, 4.49] | 2.86 [0.95, 8.64] | 1.92 [0.77, 4.78] | 3.15 [0.80, 12.39] |
| ≥800 | 3.05 [1.36, 6.85] | 4.36 [1.24, 15.29] | 3.66 [1.25, 10.67] | 8.55 [1.57, 46.53] |
| TSAT [%] | ||||
| <20 | 1.19 [0.81, 1.74] | 1.71 [0.89, 3.31] | 1.60 [0.92, 2.80] | 2.12 [0.92, 4.92] |
| ≥20 | 1 | 1 | 1 | 1 |
| Serum albumin [g/dL] | ||||
| Q1 (high] | 1 | 1 | 1 | 1 |
| Q2 | 1.63 [0.93, 2.85] | 1.20 [0.53, 2.73] | 1.62 [0.70, 3.75] | 0.33 [0.09, 1.18] |
| Q3 | 2.26 [1.20, 4.24] | 1.26 [0.51, 3.12] | 2.00 [0.78, 5.15] | 0.44 [0.12, 1.66] |
| Q4 (low] | 2.78 [1.40, 5.52] | 1.61 [0.62, 4.18] | 2.36 [0.89, 6.26] | 0.81 [0.22, 3.07] |
| Cholesterol [mmol/L] | ||||
| Q1 (low] | 1.57 [0.85, 2.88] | 2.23 [0.91, 5.46] | 1.55 [0.67, 3.59] | 2.50 [0.79, 7.95] |
| Q2 | 1 | 1 | 1 | 1 |
| Q3 | 0.56 [0.34, 0.93] | 0.60 [0.27, 1.32] | 0.55 [0.27, 1.15] | 0.42 [0.14, 1.21] |
| Q4 (high] | 0.62 [0.32, 1.20] | 0.42 [0.14, 1.27] | 0.88 [0.34, 2.31] | 0.43 [0.10, 1.86] |
| Calcium [mg/dL] | ||||
| <8.4 | 0.77 [0.50, 1.18] | 1.06 [0.59, 1.93] | 0.75 [0.42, 1.35] | 1.64 [0.77, 3.45] |
| 8.4–9.5 | 1 | 1 | 1 | 1 |
| >9.5 | 0.76 [0.53, 1.08] | 0.65 [0.37, 1.14] | 0.79 [0.48, 1.29] | 0.55 [0.26, 1.19] |
| Phosphate [mg/dL] | ||||
| <3.5 | 1.44 [0.96, 2.18] | 2.35 [1.20, 4.61] | 1.13 [0.60, 2.13] | 1.88 [0.70, 5.03] |
| 3.5–5.5 | 1 | 1 | 1 | 1 |
| >5.5 | 0.78 [0.55, 1.11] | 0.50 [0.27, 0.93] | 0.83 [0.50, 1.38] | 0.52 [0.23, 1.16] |
| PTH [pg/mL] | ||||
| <75 | 1.34 [0.68, 2.64] | 1.73 [0.67, 4.43] | 2.63 [0.89, 7.78] | 2.95 [0.81, 10.82] |
| 75–<150 | 1.54 [0.90, 2.64] | 1.23 [0.55, 2.73] | 3.03 [1.32, 6.98] | 1.42 [0.51, 3.92] |
| 150–300 | 1 | 1 | 1 | 1 |
| 300–<600 | 0.82 [0.50, 1.37] | 1.43 [0.62, 3.26] | 0.92 [0.46, 1.85] | 1.49 [0.56, 3.95] |
| 600‐–<800 | 2.59 [0.76, 8.81] | 1.67 [0.38, 7.39] | 0.83 [0.18, 3.91] | 1.10 [0.19, 6.37] |
| >800 | 0.33 [0.10, 1.11] | 0.39 [0.06, 2.40] | 0.20 [0.05, 0.88] | 0.36 [0.05, 2.72] |
Quartiles thresholds are provided in Table S1 in the Supporting Information.
Discussion
Although there have been previous studies investigating ESA hyporesponsiveness in haemodialysis patients, to our knowledge, this is the first time that case‐crossover methodology has been applied to identify factors associated with transition to this status and also the first time that a time‐lag model has been applied to account for the inevitable delay between changes in ESA dose and subsequent haemoglobin response. Furthermore, no previous studies have examined hyporesponsiveness reversibility in detail. Finally, this study is the first attempt to calculate Population Attributable Risk Fractions in a European haemodialysis cohort, examining factors independently associated with transition to hyporesponsiveness.
The findings from previous studies on ESA hyporesponsiveness, which focused on between‐patient comparisons, have the potential to be influenced by underlying prognostic differences that exist between comparison groups. In case‐crossover studies, however, patients act as their own control, and the subsequent within‐patient comparisons afford a unique opportunity to investigate factors associated with the transition to/from a hyporesponsive state whilst largely eliminating confounding‐by‐indication. The fact that risk factors for hyporesponsiveness identified in this study concur with previous studies (vascular access changes,15, 20 hospitalization,15, 21 inflammation,22, 23, 24, 25, 26 malnutrition23, 27) strengthens the consistency of our analysis. The fact that these are independent risk factors for poorer outcomes is indicative of a worsening clinical state, suggesting that ESA hyporesponsiveness is a risk marker rather than a risk factor.
The association between high CRP, low serum albumin values and ESA hyporesponsiveness in the current study confirms the major role of inflammation in hyporesponsiveness.23, 24, 27, 44 Conversely, iron deficiency—a long‐recognized ESA hyporesponsiveness determinant18, 19—was not identified as a risk factor. Instead, higher ferritin values were associated with hyporesponsiveness, and no relationship with TSAT was apparent. Ferritin and TSAT are highly modified by inflammation,45 however, potentially diminishing their roles as markers of iron metabolism and/or predictors of ESA responsiveness.46, 47 Thus, high ferritin values in our study are more likely to be indicative of inflammation, rather than as a marker of iron load and/or availability for erythropoiesis. Alternatively, the medium‐ to long‐term characteristics of iron deficiency may not be captured by the shorter term case‐crossover study design employed. The total contribution of recognized risk factors amounted to 68%, meaning that approximately one‐third of factors are unexplained.
In the same patient cohort, factors predicting reversibility of ESA hyporesponsiveness were also examined. On univariate analysis, vascular access change, changing vascular access from a fistula or graft to a dialysis catheter, and any hospitalization all predicted an approximately 60% reduction in the chances of achieving reversibility. On multivariate analysis, only the association with hospitalization remained independent. Because such an approach has to our knowledge not previously been conducted, we cannot compare these findings with those of others. However, because they largely mirror those from the hyporesponsiveness analysis, they provided additional methodological validation for the observed links.
We applied a novel method of defining ESA responsiveness based on the median dose threshold, despite the existence of a number of methods for defining this disease status.13, 48 Previous methods13, 48 were not applicable in the current study as the case‐crossover methodology necessitates a dynamic method of defining response over time and hence cannot rely on baseline measurements. A definition based on the ratio of ESA dose to haemoglobin levels was not considered, as such metrics do not consider the magnitude of the haemoglobin response. The sensitivity analyses using different cut‐offs for ESA dose (median dose 80.8 IU/kg per week; upper quartile dose 140.4 IU/kg per week) and haemoglobin response (cut‐offs 9 and 10 g/dL) confirmed the robustness of the approach and did not alter the overall results and conclusions. The time‐lag employed in our definition may be impractical in routine clinical practice. It advocates, however, for monitoring ESA responsiveness in a time‐dependent manner through available methods including measurement of the reticulocyte count, new reticulocyte indices49 or ESA responsiveness index.14
There were, however, a number of limitations inherent in these analyses. We considered only patients' first observed period of hyporesponsiveness, despite the fact that several had multiple periods of hyporesponsiveness. Similarly, only a single preceding ‘control’ period of response was considered even though many patients experienced multiple preceding response periods. The inclusion of additional periods may have facilitated the analyses as additional statistical power provided may have improved precision. Alternatively, a single hyporesponsiveness period might increase the risk of further periods of hyporesponsiveness, and this could confound any such analyses. Furthermore, the inclusion of multiple control periods would assume that each was independent of the next, which may not be the case. Earlier analyses (data not shown), considering multiple periods of hyporesponsiveness and utilizing all available control periods, gave similar findings to those in the current study but with attenuated effect estimates, suggesting one or both of the above scenarios was the case. On a related matter, we cannot establish in this mixed incident/prevalent cohort if those patient on ESA therapy at study start had not experienced periods of ESA hyporesponsiveness prior to entering the cohort and, hence, whether their characteristics would differ from those patients experiencing a hyporesponsive event for the first time. A study focusing on ESA‐naive patients would be able to rule out such left censoring but might be less feasible in the haemodialysis setting as renal anaemia commences in CKD before the need for renal replacement therapy.
Study outcomes were defined on the basis of contiguous periods of ESA exposure and haemoglobin response data, and therefore, the reported prevalence of hyporesponsiveness in this cohort will undoubtedly represent an underestimation due to missing data. Such misclassification may have affected the findings if the availability of data for either parameter is related to the condition under investigation. For example, if a patient is hospitalized elsewhere due to factors precipitating hyporesponsiveness, then results of laboratory testing undertaken at this time might not be captured at a tertiary dialysis center. Data on both ESA dosing and haemoglobin levels were missing for over half the periods with missing data, suggesting an association between lack of capture for these variables. Missingness increased with length of follow‐up, however, and therefore by capturing and investigating the first period of hyporesponsiveness as described above, we may have minimized the potential for bias. Explanatory variables, whilst comprehensive, were not exhaustive, and therefore, other unmeasured factors may contribute to hyporesponsiveness but were not assessed in the current study.
The effect of commonly prescribed medications was not included in the final analysis. Initial investigations revealed a near‐universal ‘protective effect’, in that medication use appeared to be associated with a decreased risk of ESA hyporesponsiveness. It was hypothesized that this reflected the withdrawal of long‐term medication in those patients who experienced the acute conditions that precipitated ESA hyporesponsiveness. Subsequent comparisons of hyporesponsive periods (medications coded ‘0’) with preceding periods of responsiveness (medications coded ‘1’) revealed an inverse association with their use. Similarly, this was the rationale for not introducing prescribed dialysis parameters (session frequency, dialysis dose, etc.) in the analysis.
In summary, we have applied a novel methodology to investigate factors predicting hyporesponsiveness to ESA therapy, as well as reversibility of a hyporesponsiveness episode, and have identified a number of factors using this approach. The major factors identified were vascular access changes, hospitalizations and underlying inflammation and malnutrition. Because vascular access changes and hospital admissions are usually unavoidable and causes of inflammation are unpredictable, it would appear, therefore, that clinicians are fairly powerless to prevent the major causes of hyporesponsiveness to ESA therapy. Clearly, hematinic deficiencies and some causes of blood loss are indeed reversible and should continue to be excluded in any patients becoming hyporesponsive to ESA therapy. Chronic inflammation remains a major cause of hyporesponsiveness to ESA therapy, and investigation for an underlying reversible cause should be mandatory in any patient developing ESA resistance. Treatment of infectious causes is obvious when identifiable; whether strategies to reduce inflammatory mediators are beneficial in the absence of infection remain unproven.50 Finally, one‐third of hyporesponsive events cannot be explained by the risk factors assessed in this study, and thus, a means of assessing ESA hyporesponsiveness in a time‐dependent manner may be helpful.
Conflict of Interest
I. M. D. has received speakers' fees, honoraria and consultancy fees from several ESA and IV iron manufacturers, including Affymax, AMAG, Amgen, Ortho Biotech, Pharmacosmos, Roche, Takeda and Vifor Pharma. He has received consultancy fees and reimbursements for travel and accommodation expenses from Amgen related to the ARO initiative. K. U. E. has received speaker's fees and consultancy fees from several ESA and IV iron manufacturers, including Affymax, Amgen, Bayer, Johnson & Johnson, Roche and Vifor Pharma and a research grant from Amgen. He has received consultancy fees and reimbursements for travel and accommodation expenses from Amgen related to the ARO initiative. I. A. G., M. F. and S. R. are full‐time Amgen employees. V. J. is a contractor to Amgen.
Key Points.
Hyporesponsiveness to erythropoiesis‐stimulating agents (ESAs) has important clinical and economic consequences for the treatment of renal anaemia. Previous research has focused on baseline predictors of ESA hyporesponsiveness.
Case‐crossover methodology was applied for the first time to identify factors associated with transition to an ESA hyporesponsive state and its reverse.
The factors associated with transitioning to ESA hyporesponsiveness are similar to those identified through baseline analyses, suggesting that ESA hyporesponsiveness is an indicative marker of a worsening clinical state. Response to ESA therapy should be monitored in a continuous time‐dependent manner.
Ethics Statement
All ethical and regulatory obligations concerning the use of patient data were met at each participating FMC site.
Study Collaborators
ARO Steering Committee members:
P. Aljama, Reina Sofia University Hospital, Cordoba, Spain; S. Anker, University Medical Centre Göttingen, Göttingen, Germany; B. Canaud, Lapeyronie University Hospital, Montpellier, France; T. B. Drueke, Inserm Unit 1088, Université de Picardie, Amiens, France; K.‐U. Eckardt (co‐chair), University of Erlangen‐Nuremberg, Germany; J. Floege (chair), RWTH University of Aachen, Aachen, Germany; A. de Francisco, Hospital Universitario Valdecilla, Universidad de Cantabria, Santander, Spain; F. Kronenberg, Medical University of Innsbruck, Innsbruck, Austria; I. C. Macdougall, King's College Hospital, London, UK; G. Schernthaner, Rudolfstiftung Hospital, Vienna, Austria; P. Stenvinkel, Karolinska University Hospital Huddinge, Stockholm, Sweden; D. C. Wheeler, University College London, London, UK.
ARO project collaborators:
B Fouqueray, Amgen Europe GmbH, Zug, Switzerland; B Molemans, Amgen Europe GmbH, Zug, Switzerland; AW Roddam, Amgen Ltd, UK.
Supporting information
Supporting info item
Acknowledgements
The authors wish to thank the participating FME centers for collecting the data. This study was funded by Amgen Europe GmbH, Zug, Switzerland.
Gillespie, I. A. , Macdougall, I. C. , Richards, S. , Jones, V. , Marcelli, D. , Froissart, M. and Eckardt, K.‐U. (2015), Factors precipitating erythropoiesis‐stimulating agent responsiveness in a European haemodialysis cohort: case‐crossover study. Pharmacoepidemiol Drug Saf, 24: 414–426. doi: 10.1002/pds.3755.
Prior postings and presentations: This work was presented in part as a poster at the American Society of Nephrology, San Diego 30 October to 04 November 2012 (FR‐PO244).
The copyright line for this article was changed on 19 August 2016 after original online publication.
References
- 1. Macdougall IC, Eckardt KU. Novel strategies for stimulating erythropoiesis and potential new treatments for anaemia. Lancet 2006; 368: 947–953. [DOI] [PubMed] [Google Scholar]
- 2. Koury MJ. Erythropoietin: the story of hypoxia and a finely regulated hematopoietic hormone. Exp Hematol 2005; 33: 1263–1270. [DOI] [PubMed] [Google Scholar]
- 3. Astor BC, Muntner P, Levin A, Eustace JA, Coresh J. Association of kidney function with anemia: the Third National Health and Nutrition Examination Survey (1988–1994). Arch Intern Med 2002; 162: 1401–1408. [DOI] [PubMed] [Google Scholar]
- 4. Mercadal L, Metzger M, Casadevall N, et al. Timing and determinants of erythropoietin deficiency in chronic kidney disease. Clin J Am Soc Nephrol 2012; 7: 35–42. [DOI] [PMC free article] [PubMed] [Google Scholar]
- 5. Akmal M, Sawelson S, Karubian F, Gadallah M. The prevalence and significance of occult blood loss in patients with predialysis advanced chronic renal failure (CRF), or receiving dialytic therapy. Clin Nephrol 1994; 42: 198–202. [PubMed] [Google Scholar]
- 6. Eschbach JW, Jr , Funk D, Adamson J, Kuhn I, Scribner BH, Finch CA. Erythropoiesis in patients with renal failure undergoing chronic dialysis. N Engl J Med 1967; 276: 653–658. [DOI] [PubMed] [Google Scholar]
- 7. Ly J, Marticorena R, Donnelly S. Red blood cell survival in chronic renal failure. Am J Kidney Dis 2004; 44: 715–719. [PubMed] [Google Scholar]
- 8. Kovesdy CP, Kalantar‐Zadeh K. Iron therapy in chronic kidney disease: current controversies. J Ren Care 2009; 35(Suppl 2): 14–24. [DOI] [PubMed] [Google Scholar]
- 9. Besarab A, Yee J. Candidate biomarkers for erythropoietin response in end‐stage renal disease. Kidney Int 2011; 79: 488–490. [DOI] [PubMed] [Google Scholar]
- 10. Bradbury BD, Danese MD, Gleeson M, Critchlow CW. Effect of Epoetin alfa dose changes on hemoglobin and mortality in hemodialysis patients with hemoglobin levels persistently below 11 g/dL. Clin J Am Soc Nephrol 2009; 4: 630–637. [DOI] [PMC free article] [PubMed] [Google Scholar]
- 11. Kilpatrick RD, Critchlow CW, Fishbane S, et al. Greater epoetin alfa responsiveness is associated with improved survival in hemodialysis patients. Clin J Am Soc Nephrol 2008; 3: 1077–1083. [DOI] [PMC free article] [PubMed] [Google Scholar]
- 12. Szczech LA, Barnhart HX, Sapp S, et al. A secondary analysis of the CHOIR trial shows that comorbid conditions differentially affect outcomes during anemia treatment. Kidney Int 2010; 77: 239–246. [DOI] [PMC free article] [PubMed] [Google Scholar]
- 13. Solomon SD, Uno H, Lewis EF, et al. Erythropoietic response and outcomes in kidney disease and type 2 diabetes. N Engl J Med 2010; 363: 1146–1155. [DOI] [PubMed] [Google Scholar]
- 14. Kaysen GA, Muller HG, Ding J, Chertow GM. Challenging the validity of the EPO index. Am J Kidney Dis 2006; 47: 166. [DOI] [PubMed] [Google Scholar]
- 15. Lopez‐Gomez JM, Portoles JM, Aljama P. Factors that condition the response to erythropoietin in patients on hemodialysis and their relation to mortality. Kidney Int Suppl 2008: S75–S81. doi:10.1038/ki.2008.523. [DOI] [PubMed] [Google Scholar]
- 16. Panichi V, Rosati A, Bigazzi R, et al. Anaemia and resistance to erythropoiesis‐stimulating agents as prognostic factors in haemodialysis patients: results from the RISCAVID study. Nephrol Dial Transplant 2011; 26: 2641–2648. [DOI] [PubMed] [Google Scholar]
- 17. Fukuma S, Yamaguchi T, Hashimoto S, et al. Erythropoiesis‐stimulating agent responsiveness and mortality in hemodialysis patients: results from a cohort study from the dialysis registry in Japan. Am J Kidney Dis 2012; 59: 108–116. [DOI] [PubMed] [Google Scholar]
- 18. Besarab A, Amin N, Ahsan M, et al. Optimization of epoetin therapy with intravenous iron therapy in hemodialysis patients. J Am Soc Nephrol 2000; 11: 530–538. [DOI] [PubMed] [Google Scholar]
- 19. Tessitore N, Solero GP, Lippi G, et al. The role of iron status markers in predicting response to intravenous iron in haemodialysis patients on maintenance erythropoietin. Nephrol Dial Transplant 2001; 16: 1416–1423. [DOI] [PubMed] [Google Scholar]
- 20. Goicoechea M, Caramelo C, Rodriguez P, et al. Role of type of vascular access in erythropoietin and intravenous iron requirements in haemodialysis. Nephrol Dial Transplant 2001; 16: 2188–2193. [DOI] [PubMed] [Google Scholar]
- 21. Richardson D. Clinical factors influencing sensitivity and response to epoetin. Nephrol Dial Transplant 2002; 17(Suppl 1): 53–59. [DOI] [PubMed] [Google Scholar]
- 22. Bradbury BD, Critchlow CW, Weir MR, Stewart R, Krishnan M, Hakim RH. Impact of elevated C‐reactive protein levels on erythropoiesis‐stimulating agent (ESA) dose and responsiveness in hemodialysis patients. Nephrol Dial Transplant 2009; 24: 919–925. [DOI] [PubMed] [Google Scholar]
- 23. Kalantar‐Zadeh K, McAllister CJ, Lehn RS, Lee GH, Nissenson AR, Kopple JD. Effect of malnutrition‐inflammation complex syndrome on EPO hyporesponsiveness in maintenance hemodialysis patients. Am J Kidney Dis 2003; 42: 761–773. [DOI] [PubMed] [Google Scholar]
- 24. Kaysen GA. The microinflammatory state in uremia: causes and potential consequences. J Am Soc Nephrol 2001; 12: 1549–1557. [DOI] [PubMed] [Google Scholar]
- 25. Macdougall IC, Cooper A. The inflammatory response and epoetin sensitivity. Nephrol Dial Transplant 2002; 17(Suppl 1): 48–52. [DOI] [PubMed] [Google Scholar]
- 26. Stenvinkel P, Alvestrand A. Inflammation in end‐stage renal disease: sources, consequences, and therapy. Semin Dial 2002; 15: 329–337. [DOI] [PubMed] [Google Scholar]
- 27. Agarwal R, Davis JL, Smith L. Serum albumin is strongly associated with erythropoietin sensitivity in hemodialysis patients. Clin J Am Soc Nephrol 2008; 3: 98–104. [DOI] [PMC free article] [PubMed] [Google Scholar]
- 28. Pollock C, Johnson DW, Horl WH, et al. Pure red cell aplasia induced by erythropoiesis‐stimulating agents. Clin J Am Soc Nephrol 2008; 3: 193–199. [DOI] [PubMed] [Google Scholar]
- 29. Macdougall IC. An overview of the efficacy and safety of novel erythropoiesis stimulating protein (NESP). Nephrol Dial Transplant 2001; 16(Suppl 3): 14–21. [DOI] [PubMed] [Google Scholar]
- 30. Drueke T. Hyporesponsiveness to recombinant human erythropoietin. Nephrol Dial Transplant 2001; 16(Suppl 7): 25–28. [DOI] [PubMed] [Google Scholar]
- 31. Macdougall IC, Rossert J, Casadevall N, et al. A peptide‐based erythropoietin‐receptor agonist for pure red‐cell aplasia. N Engl J Med 2009; 361: 1848–1855. [DOI] [PubMed] [Google Scholar]
- 32. Eschbach JW, Egrie JC, Downing MR, Browne JK, Adamson JW. Correction of the anemia of end‐stage renal disease with recombinant human erythropoietin. Results of a combined phase I and II clinical trial. N Engl J Med 1987; 316: 73–78. [DOI] [PubMed] [Google Scholar]
- 33. Maclure M. The case‐crossover design: a method for studying transient effects on the risk of acute events. Am J Epidemiol 1991; 133: 144–153. [DOI] [PubMed] [Google Scholar]
- 34. Kilpatrick RD, Danese MD, Belozeroff V, Smirnakis K, Goodman WG, Rothman KJ. The association of vitamin D use with hypercalcemia and hyperphosphatemia in hemodialysis patients: a case‐crossover study. Pharmacoepidemiol Drug Saf 2011; 20: 914–921. [DOI] [PubMed] [Google Scholar]
- 35. Koopmans PC, Bos JH, de Jong van den Berg LT. Are antibiotics related to oral combination contraceptive failures in the Netherlands? A case‐crossover study. Pharmacoepidemiol Drug Saf 2012; 21: 865–871. [DOI] [PubMed] [Google Scholar]
- 36. Orriols L, Wilchesky M, Lagarde E, Suissa S. Prescription of antidepressants and the risk of road traffic crash in the elderly: a case‐crossover study. Br J Clin Pharmacol 2013; 76: 810–815. [DOI] [PMC free article] [PubMed] [Google Scholar]
- 37. Maclure M. 'Why me?' versus 'why now?'—differences between operational hypotheses in case‐control versus case‐crossover studies. Pharmacoepidemiol Drug Saf 2007; 16: 850–853. [DOI] [PubMed] [Google Scholar]
- 38. de Francisco AL, Kim J, Anker SD, et al. An epidemiological study of hemodialysis patients based on the European Fresenius Medical Care hemodialysis network: results of the ARO study. Nephron Clin Pract 2011; 118: c143–c154. [DOI] [PubMed] [Google Scholar]
- 39. EMEA . Aranesp: EPAR ‐ Product Information. 12/09/2013 Aranesp‐EMEA/H/C/000332‐IB/0114, 2013. Available at: http://www.ema.europa.eu/docs/en_GB/document_library/EPAR_‐_Product_Information/human/000332/WC500026149.pdf [15 May 2014].
- 40. Kalicki RM, Uehlinger DE. Red cell survival in relation to changes in the hematocrit: more important than you think. Blood Purif 2008; 26: 355–360. [DOI] [PubMed] [Google Scholar]
- 41. Spurling MC, Vinson DC. Alcohol‐related injuries: evidence for the prevention paradox. Ann Fam Med 2005; 3: 47–52. [DOI] [PMC free article] [PubMed] [Google Scholar]
- 42. Shahani S, Braga‐Basaria M, Maggio M, Basaria S. Androgens and erythropoiesis: past and present. J Endocrinol Invest 2009; 32: 704–716. [DOI] [PubMed] [Google Scholar]
- 43. Di Iorio BR, Stellato D, De Santo NG, Cirillo M. Association of gender and age with erythropoietin resistance in hemodialysis patients: role of menstrual status. Blood Purif 2004; 22: 423–427. [DOI] [PubMed] [Google Scholar]
- 44. Stenvinkel P, Barany P. Anaemia, rHuEPO resistance, and cardiovascular disease in end‐stage renal failure; links to inflammation and oxidative stress. Nephrol Dial Transplant 2002; 17(Suppl 5): 32–37. [DOI] [PubMed] [Google Scholar]
- 45. Kalantar‐Zadeh K, Regidor DL, McAllister CJ, Michael B, Warnock DG. Time‐dependent associations between iron and mortality in hemodialysis patients. J Am Soc Nephrol 2005; 16: 3070–3080. [DOI] [PubMed] [Google Scholar]
- 46. Kapoian T, O'Mara NB, Singh AK, et al. Ferric gluconate reduces epoetin requirements in hemodialysis patients with elevated ferritin. J Am Soc Nephrol 2008; 19: 372–379. [DOI] [PMC free article] [PubMed] [Google Scholar]
- 47. Locatelli F, Andrulli S, Memoli B, et al. Nutritional‐inflammation status and resistance to erythropoietin therapy in haemodialysis patients. Nephrol Dial Transplant 2006; 21: 991–998. [DOI] [PubMed] [Google Scholar]
- 48. Minutolo R, Conte G, Cianciaruso B, et al. Hyporesponsiveness to erythropoiesis‐stimulating agents and renal survival in non‐dialysis CKD patients. Nephrol Dial Transplant 2012; 27: 2880–2886. [DOI] [PubMed] [Google Scholar]
- 49. Brugnara C. Reticulocyte cellular indices: a new approach in the diagnosis of anemias and monitoring of erythropoietic function. Crit Rev Clin Lab Sci 2000; 37: 93–130. [DOI] [PubMed] [Google Scholar]
- 50. Cooper A, Mikhail A, Lethbridge MW, Kemeny DM, Macdougall IC. Pentoxifylline improves hemoglobin levels in patients with erythropoietin‐resistant anemia in renal failure. J Am Soc Nephrol 2004; 15: 1877–1882. [DOI] [PubMed] [Google Scholar]
Associated Data
This section collects any data citations, data availability statements, or supplementary materials included in this article.
Supplementary Materials
Supporting info item