

Abstract
Gene expression is a fundamental process that underlies development, homeostasis, and behavior of organisms. The fact that it relies on nucleic acid intermediates, which can specifically interact with complementary probes, provides an excellent opportunity for studying the multiple steps—transcription, RNA processing, transport, translation, degradation, and so forth—through which gene function manifests. Over the past three decades, the toolbox of nucleic acid science has expanded tremendously, making high‐precision in situ detection of DNA and RNA possible. This has revealed that many—probably the vast majority of—transcripts are distributed within the cytoplasm or the nucleus in a nonrandom fashion. With the development of microscopy techniques we have learned not only about the qualitative localization of these molecules but also about their absolute numbers with great precision. Single‐molecule techniques for nucleic acid detection have been transforming our views of biology with elementary power: cells are not average members of their population but are highly distinct individuals with greatly and suddenly changing gene expression, and this behavior of theirs can be measured, modeled, and thus predicted and, finally, comprehended. WIREs Dev Biol 2015, 4:135–150. doi: 10.1002/wdev.170
For further resources related to this article, please visit the WIREs website.
Conflict of interest: The authors have declared no conflicts of interest for this article.
BACKGROUND
In situ detection of nucleic acids was first established by Gall and Pardue, who experimentally demonstrated that radioactively labeled ribosomal RNA molecules will seek their specific complementary ribosomal DNA counterparts in cell squashes in situ.1 These early in situ hybridization (ISH) assays, however, suffered from the disadvantages of radioactive labeling: low spatial resolution owing to streaks caused by the released particles, decaying sensitivity of probes upon storage, and hazardous radiation. However, with the development of organic chemistry, new types of labels were introduced: nucleic acids containing bases (usually uracil) labeled with small organic compounds (haptens), such as dinitrophenol, digoxygenin, biotin, and fluorescein. These labeling molecules in appropriate densities do not interfere with nucleic acid pairing but offered specific and sensitive detection of the target–probe hybrid. Hapten molecules are either directly detectable (e.g., fluorescent) and/or have a specific strong interaction partner2, 3—an antibody or other macromolecule, such as (strept)avidin; these partners conjugated to detection systems, such as enzymes or labeled secondary antibodies, offer the possibility to detect the target nucleic acid, e.g., RNA molecules, specifically4 and allow simultaneous detection of multiple target molecules (multiplexing).5
In microscopy, discrimination of objects positively correlates with the absolute amount of collected photons (brightness) and the signal‐to‐background ratio (contrast). Hapten labeling granted high spatial resolution to fluorescent RNA in situ hybridization (FISH) studies, as the probes contained multiple (usually few tens) chemically modified bases. This translates into a range of fluorophores per target from equal in number in the case of direct fluorescence‐labeled probes to up to a few thousand fluorescent labels when the detection system is based on enzymatic signal amplification, e.g., alkaline phosphatase or horseradish peroxidase. These molecules can carry out multiple rounds of chromogenic or fluorescent reactions, resulting in detectable deposition of their substrates in the immediate vicinity of the hybrid and ability to visualize even low abundance targets6 (Figure 1(a)). Electron microscopy (EM) studies of RNA distribution (EM ISH) have also become possible thanks to enzymes that create electron‐dense deposits or gold‐particle‐conjugated secondary antibodies/protein‐A to detect hapten‐labeled probes. EM ISH can resolve individual ribonucleoprotein complexes (RNPs) with nanometer precision and decipher RNP composition and architecture.3, 7
Figure 1.
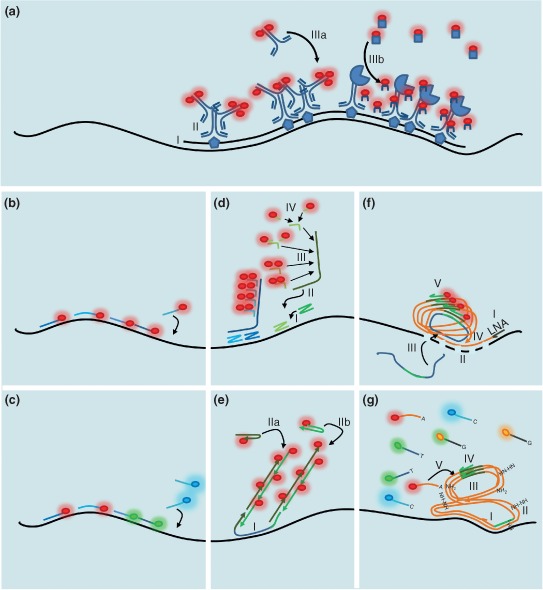
Single‐molecule RNA detection by hybridization. (a) During conventional fluorescent RNA in situ hybridization (FISH), a hapten‐labeled single‐stranded nucleic acid, a few hundred nucleotides long, is (I) hybridized to the target messenger RNA (mRNA). (II) The hapten molecules are subsequently detected by specific primary antibodies. Amplified fluorescent signal is created by detecting the primary antibodies (IIIa) with labeled secondary antibodies or (IIIb) by enzyme‐mediated catalytic conversion of a soluble substrate into stable deposits associated with the surrounding cellular matrix. (b) Single‐molecule FISH based on an array of singly labeled fluorescent probes, simultaneously hybridizing to target, usually in a tandem with a few nucleotide long gaps. (c) RNA bar‐coding based on single‐molecule FISH (smFISH). Smaller arrays of probes labeled with different colors hybridize the target to create one (spectral bar‐coding) or a spatial pattern of super‐localized spots (spatial bar‐coding) with unique color combination. (d) Branched DNA (bDNA) FISH, e.g., RNAscope. (I) Two target‐specific probes hybridize juxtaposed creating a landing platform for (II) the preamplifier, which (III) binds an array of identical amplifiers. The amplifiers gather (IV) multiple copies of singly labeled probes. (e) Hybridization chain reaction. (I) The initiator hybridizes to the target. (IIa and IIb) The two labeled hairpins bind the two overhangs of the initiator deploying fluorescence and regenerating the overhangs to maintain the chain reaction. (f) Rolling circle amplification (RCA) based on padlock probes. (I) Reverse transcription is carried out using a locked nucleic acid (LNA) primer. (II) The RNA of the RNA/cDNA (complementary DNA) duplex is digested with RNase H, allowing binding of the linear padlock probe to the LNA/RNA fixed cDNA. (III) The padlock probe is circularized via mismatch‐sensitive DNA ligation. (IV) Phi29 polymerase‐based RCA is initiated, creating a DNA nanoball that carries multiple covalently bound copies of the padlock probe complementer. (V) These are detected by a singly labeled probe specific to the padlock probe. (g) FISSEQ, sequencing RNA in situ. (I) Random hexamer‐based reverse transcription (RT). (II) The obtained cDNA is circularized by CircLigase and (III) this circular ss cDNA is amplified during RCA, creating a DNA nanoball. (IV) Multiple copies of the sequencing primer hybridize within the nanoball to the adapter introduced by the RT primer. (V) SOLiD sequencing‐by‐ligation is carried out on each spot.
Studies based on these conventional, hapten‐based ISH techniques revealed not only that RNA is not expressed ubiquitously and uniformly in all cells of an organism through its development and homeostasis but also that in virtually all species, a few or thousands of different transcripts localize in a specific nonrandom spatial pattern within the cytoplasm.8, 9, 10, 11 Although powerful in describing qualitative properties of intracellular RNA localization,3 these techniques have some serious limitations: because relatively long probes (several hundreds to thousands of nucleotides) are used, their penetration deep into large cells and densely packed tissues, such as central nervous systems, is restricted.12 Probe length is essential to host enough epitopes to achieve a detectable signal. However, to avoid interference of the bulky labeling molecules with duplex formation, the labels are introduced stochastically with low probability—usually ∼2.5% per nucleotide.13 This can result in signal differences of as much as an order of magnitude between individual probe molecules at the two extremes of the labeling spectrum. Also, the output of signal‐amplifying—mostly enzymatic—steps is governed by the (micro)environment, which is bound to vary even under the most carefully controlled experimental conditions. Given these issues, a fraction of hybridized messenger RNA (mRNA) targets will remain undetected owing to low labeling density (false negatives), whereas nonspecifically bound probes are indistinguishable from true target–probe hybrids (false positives).14 These features render conventional ISH assays nearly impossible to calibrate, which would be crucial to reliably quantify absolute amounts of mRNA molecules.
Measurement of different aspects of gene expression, e.g., transcription, pre‐mRNA processing, and RNA decay, was therefore mostly carried out using tissue‐dissociating in vitro methods/assays, such as Northern blotting, microarrays, quantitative reverse transcription polymerase chain reaction (qRT‐PCR), digital RT‐PCR, or high‐throughput nucleic acid sequencing.15 While originally restricted to bulk analysis, in recent years, these methods have become sensitive enough to detect virtually a single unique nucleic acid sequence within a sample.16 Single‐cell qRT‐PCR and RNA sequencing of various bacteria, yeast, and higher eukaryotic cells from cell culture, dissociated tissues, or from embryos have shown that there are gene expression differences of orders of magnitude between seemingly identical peers within a given population.17, 18, 19 With a few exceptions,20, 21 these assays lack any subcellular and temporal resolving power: they cannot distinguish between physiological noise due to bursts of transcription, cell cycle, or developmental stage‐specific regulation of gene expression, or between functional mRNAs exported to the cytoplasm for translation and mRNAs targeted for intranuclear decay and other spatiotemporal events.16 During the past 15 years, high‐resolution in situ and in vivo RNA localization imaging has been combined with strategies for counting the number of target molecules to gain precise and quantitative understanding of gene expression and RNA biogenesis. Numerous RNA detection assays that yield an output that scales linearly with input, with intrinsic background suppression and strong labeling to detect all target molecules, have been developed (Table 1).
Table 1.
Comparing Different RNA Imaging Methods
| Method | Description | Applicationa | Single‐Molecule Sensitivity | Labelingb | Multiplexingc | Endogenous Targetd | SNP Detectione |
|---|---|---|---|---|---|---|---|
| Conventional FISH2 | Probes a few hundred nucleotides long stochastically labeled with haptens | In situ | Competitive FISH29, 30 | Direct; ∼2.5% per nucleotide, 1 probe per target | Spectrally limited | In situ | No |
| smFISH22, 23 | Arrays of singly labeled short (∼20 nucleotide) long probes | In situ | Yes | Direct; 1 per probe, 16–48 probes per target | Spectral and spatial bar‐coding31; whole transcriptome in sequential smFISH32 | In situ | Yes46 |
| bDNA‐based RNAscope34, 35 | bDNA‐mediated signal amplification | In situ | Yes | Indirect; 20 by 20 per probe pair, 20 probe pairs per target | Spectrally limited | In situ | ND |
| Hybridization chain reaction (HCR)37, 38 | Initiator‐mediated melting deposition of labeled metastable DNA hairpins | In situ | Yes | Indirect; ∼200 per initiator, 5 initiators per target | Spectrally limited | In situ | ND |
| Padlock probes42 | Rolling circle amplification of circularized padlock probe; DNA ligation is mediated by cDNA made during RT | In situ | Yes | Indirect; hundreds to thousands per padlock probe | Spectrally limited | In situ | Yes42 |
| FISSEQ47 | RT of RNAs followed by RCA of circularized cDNA and subsequent sequencing‐by‐ligation | In situ | Yes | Indirect; hundreds to thousands per cDNA | Whole transcriptome | In situ | ND; highly probable |
| Phage RNA loop (p‐loop)–phage coat protein fused to fluorescent protein (pCP–FP)49 | pCP–fluorescent protein fusion protein specifically seeks host orthologous p‐loop RNA secondary structure in modified target | In vivo | Yes | Indirect; 1–2 FPs fused per pCP dimer, 6–24 p‐loops integrated into target, ∼2/3 loop occupancy50 | Spectrally limited | No; homologous recombination allows modification of the genomic locus58 | No |
| Pumilio Homology Domain (PUM‐HD)‐FP63, 66 | Modular eight‐nucleotide‐recognizing PUM‐HDs fused to FPs seek endogenous targets | In vivo | Yes | Direct; 1 FP per 2 PUM‐HDs, 2 PUM‐HDs per target | Spectrally limited | In vivo | ND |
| Multiply labeled tetravalent RNA imaging probes (MTRIP)74 | Short biotinylated probes carrying 2–4 labels are tetramerized via streptavidin and delivered into living cells by streptolysis | In vivo | Yes | Direct; 2–4 per ligand, 8–16 per MTRIP, 2–3 MTRIP per target | Spectrally limited | In vivo | ND; highly unprobable |
| Molecular beacons (MBs)68 | Fluorophore is displaced from quencher upon melting of the MB stem during hybridization of target‐specific loop of MB | In vivo | Yes | Direct, fluorogenic; 1 per MB; few 96 per target | Spectrally limited | In vivo | Yes, in vitro 84 |
| Exciton‐controlled hybridization‐sensitive fluorescent oligonucleotide (ECHO) probes77, 78 | Two thiazol orange (TO) derivative intercalating DNA dyes are coupled to thymidine; during hybridization, the excimeric quenching interaction between the two fluorophores is broken | In vivo | ND; highly probable | Direct, fluorogenic; 1 or 2 (energy transferring) per ECHO probe, few per target | Dye variant limited | In vivo | Yes, in vitro 82 |
| Forced intercalation (FIT) probes79 | A TO derivative is used as a base surrogate; upon hybridization the dye is forced into intercalation | In vivo | ND; highly probable | Direct, fluorogenic; 1 or 2 (energy transferring) per FIT probe, few per target | Dye variant limited | In vivo | Yes, in vitro, in vivo highly probable83 |
| Spinach,92 Spinach293 | Membrane‐permeable GFP‐like nonfluorescent fluorophore (DFHBI) binds specifically to an RNA aptamer and becomes fluorescent | In vivo | ND; highly probable | Indirect; fluorogenic; 1 per RNA aptamer, several aptamers per transgenic target | Dye variant limited | No; homologous recombination would allow modification of the genomic locus | No |
FISH, fluorescent RNA in situ hybridization; smFISH, single‐molecule FISH; bDNA, branched DNA; FISSEQ, fluorescent in situ RNA sequencing; RT, reverse transcription; RCA, rolling circle amplification; cDNA, complementary DNA; pCP, phage coat protein; ND, not determined.
Highly probable and highly unprobable indicate that based on similarity to other assays it is likely or unlikely that the method possesses the feature in question, respectively.
Primary application of the method; in vivo assays can also be used for in situ analysis in fixed specimen.
Number of fluorescent molecules/haptens per probing unit and typical number or probing unit per target. Direct labeling indicates that the RNA‐specific recognition molecule carries the detectable label, whereas during indirect labeling the label is introduced by an additional component of the method, conferring modularity that is recycling of parts of the method.
The limits of different RNA molecules that can simultaneously detected.
Whether the endogenous target can be detected and in what type of assay.
Whether single‐nucleotide polymorphism (SNPs) can be detected and in what type of assay.
SINGLE‐MOLECULE RNA DETECTION BY HYBRIDIZATION
In 1998, the Singer laboratory published the first assay with genuine single‐molecule sensitivity (single‐molecule FISH, smFISH)22 independent of long, stochastically labeled probes. The authors showed that, using as few as five short (50 nucleotides long) labeled oligonucleotides, each carrying five fluorophores, hybridizing to a target in a tandem array, they could detect individual β‐actin mRNA molecules within mammalian cells in culture. Although the maximum 25 labels per target mRNA were dim compared with the potentially thousands deployed by enzymes during conventional FISH, the defined amount of fluorescent molecules allowed calibration of single probe signal. Based on signal intensity, each of the around 500 fluorescent foci observed in a serum‐starved cell turned out to contain only a single copy of β‐actin mRNA, in agreement with previous in vitro studies.22
A major disadvantage of this method was that a large fraction of detected spots contained only one or two probes.22 Therefore, spots labeled with four to five probes could be interpreted as containing not just a single, but possibly two or even three mRNA molecules. On the other hand, single nonspecifically binding probes cannot be distinguished from true probe–target hybrids, resulting in false‐positive detections. To overcome these technical limitations, Raj et al. in 200823 proposed a slightly different smFISH approach: instead of using a few, multiply labeled oligos, they designed a series (12–48) of tandem arrays of around 20‐nucleotide‐long probes each carrying a single fluorescent label (Figure 1(b)). After careful thresholding, this method detected fluorescent spots of fairly uniform intensity that were identified as single green fluorescent protein (GFP)‐coding mRNA molecules. Based on this assay, the Gregor and Wieschaus labs established that the amount of bicoid (bcd) mRNA, which encodes the anterior morphogen of Drosophila, stays fairly constant during early embryogenesis, although bcd mRNPs undergo continuous remodeling and redistribution to establish a steep gradient.24 In a subsequent study, the Gregor lab showed that Bcd‐induced hunchback (hb) expression is intrinsically noisy (∼50% variability between individual loci), yet hb mRNA localizes with remarkable precision, creating a sharp expression boundary within the cytoplasm of syncytial blastoderm embryos due to diffusion‐mediated spatiotemporal averaging.25
Because mRNA molecules are usually several hundred to several thousand nucleotides long, a single mRNA can be targeted with several arrays of probes carrying spectrally distinguishable fluorophores. Multiple intramolecular labeling has allowed not only cross‐validation of different single‐molecule methods22, 23 but has also made certain biologically relevant observations possible. Using probe arrays differentially targeting the 5′ and 3′ untranslated regions (UTRs) of β‐actin mRNA, Femino et al. measured its transcription rate within the nucleus after serum induction. The obtained 1.1–1.4 kb/second transcription rate was in good agreement with that measured in vitro.22, 23
Introns can also be targeted by probe arrays; although most splicing events appear to occur co‐transcriptionally, in that the pre‐mRNA remains localized at the site of transcription, smFISH analysis demonstrated that in many cases alternative splicing takes place post‐transcriptionally within the nucleus, as recognition of a splice site is hindered by protein binding.26 Moreover, if mature products of alternative splicing are sufficiently different, they can be reliably resolved and quantified by smFISH.27
Different transcripts can also be labeled differentially, making simultaneous detection of multiple mRNA species possible.22, 23 Multicolor smFISH experiments established that most RNPs contain single mRNA molecules and different transcripts do not mingle with each other, even when they share a common intracellular destination.22, 23, 28 This was in contrast with earlier findings of RNPs containing different mRNA molecules, based on conventional FISH and RNA injection experiments, demonstrating the importance of detecting endogenous targets with high spatial accuracy when studying (RNA) localization.28
Interestingly, however, competitive FISH based on two conventional hapten‐labeled probes targeting the same sequence also successfully demonstrated that Sex combs reduced (Scr) and hairy mRNPs contain single mRNA molecules, as the two labels were mutually exclusive in the vast majority of detected spots.29, 30 Although in this assay co‐labeling is expected to follow a binomial distribution, the variable label densities—as discussed above—render competitive FISH unreliable beyond a few (three or more) mRNA molecules per RNP or when studying populations of RNPs of variable composition.
Although the current inventory of spectrally resolvable labels (around a dozen) would be exhausted quickly, color‐coding—or bar‐coding—the mRNAs (Figure 1(c)) greatly extends the number of simultaneously identifiable molecules: a single species is identified by not a singly colored probe array but by several (n) different colors of the available repertoire (p, p ≥ n). Depending on whether identical colors are allowed amongst the n positions or not, 2n − 1 or p!/(p − n)!/n! different combinations can be distinguished through spectral bar‐coding.31 Because linearized mRNA molecules are relatively long (100 nucleotides stretch to around 30 nm), centroid determination or super‐resolution microscopy‐based subdiffractive localization of signal allows determination of the spatial sequence of the fluorescent labels, increasing the number of combinations to p!/(p − n)!/2 by spatial bar‐coding.31 Although impressive, the latter technique requires stretching the mRNA molecules by applying pressure to fixed cells, which could prove difficult within bulky specimens, such as three‐dimensional tissues, organs, oocytes, or embryos, where mechanical forces cannot be transmitted efficiently deep into the specimen.31 Multiplexing with spectral bar‐coding, however, can be massively extended through removing used probes by DNAse I and re‐probing the same specimen for other sets of mRNAs. Thus, through a series of detection and probe removal cycles, virtually all—each and every different kind—of transcripts can be visualized with single‐cell and single‐molecule precision.32
Unambiguous identification of fluorescent spots depends on the number of photons collected, which is a product of the number and the brightness of fluorescent molecules within the spot, the quantum efficiency of the detector, and integration time.33 Despite the advances in organic chemistry and physics providing better dyes and detectors, the number of fluorophores can easily become limiting in smFISH assays, e.g., during bar‐coding or simply if the target RNA molecule is too short. Also, owing to its optical imperfections the biological specimen causes loss both of excitation and emission photons, rendering imaging deep within sample quite challenging. One obvious solution is to increase the number of dye molecules bound to the target. To this end, in 2001, Player et al. developed a nucleic acid detection method based on branched DNA (bDNA).34 In a slightly modified version termed RNAscope,35 a pair of target‐specific DNA oligos (Z‐shaped probes) hybridizes adjacent to each other and with their 14 nucleotide long overhangs create a 28‐nucleotide‐long landing platform required to bind another DNA molecule, the preamplifier. In subsequent steps, the preamplifier binds multiple copies of DNA amplifiers, which then bind singly labeled probes (Figure 1(d)). The split landing platform created by the Z‐probe pairs ensures specific binding of the preamplifier, restricting false‐positive detection to a minimum.35 By using multiple pairs of target‐specific probes—with identical landing platform sequences—orders of magnitude higher label density and thus signal intensity can be obtained with RNAscope than with smFISH36 (Figure 1(b) and (d)).
Programmable biomolecules provide another means of controllable, nonenzymatic signal amplification. During hybridization chain reaction (HCR)37, 38 two fluorescently labeled metastable DNA hairpin populations—partially complementary to each other—engage in localized hybridization with each other (Figure 1(e)). The reaction is triggered by an initiator, which consists of a central portion complementary to the target and overhangs on either side. Each overhang triggers melting of one of the hairpin structure, making these linearized, labeled oligos to hybridize partly, resulting in signal recruitment to the target and regeneration of overhangs. Thus, the reaction is amplifying, resulting in around 200‐fold brighter labeling of a target than that obtained with singly labeled probes. Similarly to RNAscope, the targeting to a given RNA of multiple initiators that trigger the same HCR enhances the raw signal (brightness) and the signal‐to‐noise ratio (contrast), allowing precise detection of single RNA molecules even in optically challenging specimens, such as in whole‐mount zebrafish embryos.37
The design of bDNA‐based RNAscope and HCR also allows multiplexing: using different landing platforms or initiator sequences—together with complementary preamplifiers or metastable hairpins—and spectrally resolvable fluorescent dyes, multiple targets can be identified simultaneously with both methods.35, 37 Additionally, in contrast to smFISH, which requires synthesis of unique fluorescent probe arrays to detect individual targets, their modular design allows recycling of the detection systems (preamplifier–amplifier block and hairpins). This modularity combined with automated microscopy and spot detection allowed Battich et al. to perform FISH analysis of more than 900 different human transcripts with single‐molecule resolution.36 They established that the quantities of most transcripts they detected correlated excellently with those obtained by next‐generation RNA sequencing; additionally, however, the single‐cell resolution of the microscopy method allowed determination of subcellular localization patterns and cell‐to‐cell variability of gene expression, which are lost in en‐mass sequencing reactions.
Signal amplification is also critical when detecting short RNA sequences, e.g., microRNAs (miRNAs), which provide target sequences only for single probe. Specificity is critical in such instances, as nonspecifically bound probes could be falsely identified as probe–target hybrids. In 2011, Lu and Tsourkas proposed locked nucleic acid‐FISH (LNA FISH) coupled to enzyme‐labeled fluorescence. LNAs increase the stability of duplexes containing no mismatches, and the resulting increase in melting temperature of the hybrid of around 20°C proved to be sufficient to prevent a high level of false positives during the alkaline phosphatase‐mediated fluorescent signal amplification step.39, 40
Another appealing method with intrinsic signal amplification potential is the PCR. Coupled to RT, PCR was demonstrated to work efficiently in fixed cells and tissues, allowing the detection of specific transcripts.41 The greatest limitation of this method is that the labeled DNA molecules generated are free to diffuse within and even out of cellular compartments, and therefore fine spatial information regarding RNA localization, and thus the possibility of single‐molecule counting are lost.41 To restore the missing information, the Nilsson lab proposed the use of padlock probes for in situ detection of RNA molecules.42 The two ends of padlock probes hybridize to two adjacent sequences of the complementary DNA (cDNA) made from the target, forming a nicked single‐stranded circular DNA—cDNA hybrid (Figure 1(f)). The nick is ligated by a DNA ligase and subsequently rolling circle amplification (RCA) is initiated by the phi29 phage polymerase, generating multiple covalently bound copies of the padlock probe. The resulting DNA nanoball is detected by a fluorescently labeled probe recognizing the middle portion of the padlock sequence present in multiple copies. cDNA–padlock probe hybridization is only possible, however, if the target mRNA—still binding to the cDNA—is removed first. To prevent release of the cDNA from the target spot, Larsson et al. used LNA‐modified RT primers. Thus, although the greater portion of the mRNA is digested by RNase H, the LNA–RNA hybrid remains intact, locking the created cDNA in place.42
Specificity of padlock probe‐based hybridization is conferred by the DNA ligation step, which only takes place after double‐stranded DNA is formed. Because DNA ligases are sensitive to mismatches flanking the nick, this method has been demonstrated to be capable of distinguishing single nucleotide polymorphisms (SNPs) with single‐molecule sensitivity.42 As SNPs are both useful for distinguishing allelic transcripts and hallmarks of progression of chronic, clonal diseases, such as tumors or autoimmune syndromes, SNP‐sensitive in situ assays are invaluable tools for studying transcriptional and epigenetic regulation, and also for early clinical diagnosis and disease progression monitoring.43, 44
In 2013, Hansen and van Oudenaarden demonstrated that smFISH is also able to distinguish allele‐specific transcripts that differ by only a few nucleotides.45 In the same year, the Raj lab showed that by using a short unlabeled masking oligo that will hybridize next to the polymorphism, one can ‘guide’ a single SNP‐specific fluorescent probe to its target specifically.46 This is achieved by restricting to a minimum the target nucleotides available for probe binding, rendering mismatch‐free binding thermodynamically necessary (toehold probe strategy). The masking oligonucleotide is subsequently removed via passive strand displacement, stabilizing the fluorescent probe. As the false‐positive detection rate when using a single probe is high, Levesque et al. introduced an array of target‐specific probes—labeled differently from the SNP sensing probe—to identify target first (guide probe array). With this combined approach, they achieved remarkable precision of distinguishing mRNA molecules that differed only by a single nucleotide.46
Padlock probes and SNP‐sensitive smFISH probes have proven excellent tools for identifying single mRNAs containing known SNPs. Fluorescent in situ RNA sequencing (FISSEQ),47 developed by Lee et al., however performs intracellular in situ sequencing similar to next‐generation sequencing reactions. cDNA and subsequently created DNA metabolites are linked to their surroundings by incorporating aminoallyl‐uracyl during synthesis. The amine groups of cDNA are cross‐linked to amine groups of adjacent, fixed protein molecules by a short amine‐reactive cross‐linker. Subsequently, the cDNA generated during RT is circularized by CircLigase and will serve as template for RCA resulting in a DNA nanoball containing multiple copies of the RNA sequence and a short adapter introduced by the RT primer. This adapter serves as the basis for high‐precision SOLiD (Sequencing by Oligonucleotide Ligation and Detection) sequencing‐by‐ligation by binding sequencing primers (Figure 1(g)). Using random hexamer priming during RT, the authors were able to collect an impressive number of over 14,000 amplicons representing more than 4000 genes in individual cultured human fibroblast cells.47 Although this technique is still in its infancy—as indicated by the moderate correlation between its results and next‐generation Illumina sequencing47—the potentials of single‐cell resolution transcriptomic analysis are tremendous, especially for developmental biologists trying to decipher initial changes in a seemingly uniform population of cells in the process of cell commitment and differentiation.
FLUORESCENT PROTEIN‐BASED RNA VISUALIZATION
A number of disadvantages limit greatly the use of smFISH and other direct fluorescence‐labeled probe‐based approaches in vivo. Major problems include delivery of the probe through intact cell membranes, the obligatory washing steps to remove the large excess of unbound yet fluorescent probes, and the relatively large target required for hybridization to the probe arrays. Because mRNAs rarely exist in linear form, free of secondary structures and binding proteins in living cells, efficient probe binding is not easily guaranteed. Although microinjection of fluorescently labeled mRNAs has been utilized successfully and valuable information on RNP biogenesis was gained,3 the in vitro origin of the injected RNAs—which may not undergo important processing events, such as splicing—can undermine the in vivo relevance of these injection assays.29
To circumvent these problems, fluorescent versions of endogenous RNA‐binding proteins (RBPs) that allow tracking of endogenous RNAs in cultured cells and living organisms were created. Several such fusion proteins, e.g., GFP‐Exuparentia, GFP‐Staufen, and GFP‐Imp, have been expressed transgenically and used as proxies to track the dynamics of the RNP lifecycle.48 Unfortunately, it is impossible to tell whether the observed individual fluorescent RBPs bind any RNA molecule. Also, the relatively large number (>1) of mRNA substrates of these RBPs prevents unambiguous identification of specific mRNA targets. Another class of RBPs, phage coat proteins (pCPs), on the other hand exhibit strong and selective binding to species autologous RNA stem–loop secondary structures (p‐loops, pCP‐binding RNA loop). Because there are no functional or structural homologs of pCPs and p‐loops encoded by eukaryotic genomes, it allowed Bertrand et al. to propose a two‐component system comprising the MS2 pCP fused to GFP (MCP‐GFP) and the bud‐tip localizing ASH1 mRNA of yeast labeled with 12 repeats of the MS2 loop, recognized specifically by MCP (GFP) dimers49 (Figure 2(a)). This approach allowed the first visualization of ASH1 mRNP localization dynamics in living yeast and rapidly the method became the prototype of numerous in vivo mRNA/mRNP studies. Using multiple copies of MS2 loops, about two thirds of which are engaged in binding to an MCP‐GFP dimer,50 confers high sensitivity and specificity over unbound pCP–FPs. Another level of increased specificity is due to inclusion of a nuclear localization sequence (NLS) in the fusion protein, resulting in nuclear sequestration of unbound, fluorescent coat protein molecules in the nucleus, and thus reduction of the cytoplasmic background signal, which is instrumental for single mRNP sensitivity.49
Figure 2.
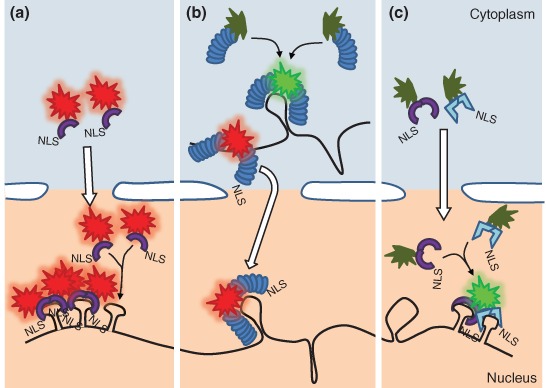
Fluorescent protein‐based messenger RNA (mRNA) visualization. (a) Ribonucleoprotein complex (RNP) detection via phage coat protein–fluorescent protein (pCP–FP)–p‐loop system. Fluorescently labeled monomeric—or intramolecularly dimerized—coat protein molecules carrying nuclear localization signal (NLS) are sequestered to the nucleus, where they bind to the respective p‐loop of a transgenically encoded RNA target. (b) Pumilio Homology Domain (PUM‐HD) FP system. A full FP (red) or the two halves of a split FP (green) are fused to two PUM‐HDs with different sequence specificities. The two PUM‐HDs bind to adjacent segments of the target, restoring fluorescence in case of a split FP label (green). Target binding can take place both in the nucleus and in the cytoplasm. (c) Split FP modification of the pCF‐FP–p‐loop system. Nonfluorescent orthologous intramolecularly dimerized pCPs (e.g., MCP and PCP) fused to split Venus are targeted to the nuclei, where they bind to their respective p‐loops, which are arranged in an alternating fashion, restoring Venus fluorescence. Fluorescently labeled RNPs get exported to cytoplasm while nonassociated label molecules remain sequestered in the nucleus (a–c).
MS2 tagging of mRNAs provided information on transcription dynamics,51, 52, 53, 54 nuclear RNP export,55 RNP transport and localization,3, 48 and mRNA decay.56 Recently, Katz et al. managed to visualize single mRNP translation events based on changes in cytoplasmic motility of β‐actin transcripts.57 Also, genome‐wide introduction of MS2 loops to the 3′ UTR of yeast genes using homologous recombination (HR) has allowed high‐throughput mRNA localization and dynamics studies to be performed.58 HR was also successfully utilized in mammalian models, allowing creation of a mouse strain in which the β‐actin locus was tagged with MS2, thus tagging all endogenous β‐actin transcripts.59 The development of other, pCP–p‐loop binary systems orthogonal to MS2, such as those derived from the λ60 and PP761 phages, has made multiplexing of in vivo RNA tagging possible, allowing differential intramolecular labeling53 and may lead to simultaneous imaging of several RNP species.
As GFP and most related fluorescent proteins are bright from the moment of their maturation, in the conventional loop tagging assays, the unbound pCP–FP coat proteins must be ‘washed out’ from the cytoplasm into the nucleus (see above). However, this strategy is not applicable in prokaryotes or in cellular organelles of prokaryotic origin, such as mitochondria. In 2007, the Broude and Umezawa groups independently described the use of split FPs to facilitate RNP studies—originally described by Rackham and Brown62—in these nucleus‐free systems.63, 64 The principle of their methods is based on the recreation of a GFP‐related FP from two, nonfluorescing halves of the FP (split FP) fused to two RBPs, which upon binding to adjacent segments of a single target restore fluorescence. The Broude lab used two RNA‐binding fragments of eIF4A that can specifically bind to an RNA aptamer heterologous to bacterial transcripts. Although only a single aptamer per target was introduced, and therefore single molecules were not per se visualized, RNA concentration estimated by total fluorescence intensity of reassembled GFP molecules matched well with previous observations, owing to the essentially background‐free detection strategy.64
The RNA‐binding Pumilio Homology Domain (PUM‐HD) of human PUMILIO1 fused to split FP can also be used as a means for in vivo visualization of transcripts, as demonstrated by Ozawa et al.63 The PUM‐HD consists of eight α‐helices arranged in a tandem array that recognize UGUANAUA sequence elements. Because of the modular nature of the RNA recognition moiety of the PUM‐HD, by modifying individual helices the target sequence can be altered and thus virtually any eight‐nucleotide‐long RNA stretch can be recognized.65 Fusing fragments of split FP to two PUM‐HDs that bind to adjacent nucleotides within a target transcript reconstitutes fluorescence, while the composite 16‐nucleotide‐long recognition sequence of the PUM‐HDs confers target specificity (Figure 2(b)). Additionally, unlike the previous loop or aptamer‐binding strategies, which require expression of modified target mRNAs, PUM‐HDs detect endogenous transcripts, even at single‐molecule resolution. In 2011, the Ozawa lab also demonstrated the application of a PUM‐HD1—full‐length EGFP—PUM‐HD2 fusion protein.66 Although use of the intact EGFP reintroduced the issue of aspecific background, total internal reflection microscopy was demonstrated to be powerful enough to resolve singly fluorescent spots—essentially single transcripts—within the cytoplasm. Because this method relies on a single construct expressing two PUM‐HD domains flanking an EGFP molecule, it avoids the problem of nonstoichiometric expression of the two PUM‐HD‐split FPs and simultaneously removes the temporal gap caused by the several minute long fluorescence reconstitution process.66
The split FP approach was also successfully implemented in loop binding assays making use of alternating orthologous phage loops. Transcripts containing an array of 12 MS2–PP7 loop pairs co‐expressed with tandem dimers of MCP‐split VenusN and PP7 coat protein (PCP)‐split VenusC were proven to offer background‐free RNP imaging with high sensitivity even in the nucleus67 (Figure 2(c)).
These in vivo RNP imaging methods have been providing invaluable information on RNP biogenesis; however, they mainly work with genetically modified mRNA molecules. Although in most experiments, quality of the transgenic target molecules is carefully monitored with the available methods—e.g., expression levels, localization, translatability, and/or rescue of a mutant phenotype—it is difficult to judge how and to what extent modification and labeling of RNPs alters their dynamic behavior.
FLUOROGENIC APPROACHES OF IN SITU RNA DETECTION
To circumvent the high background problem caused by unbound and unwashed probes, Tyagi and Kramer proposed the use of oligonucleotide probes labeled with conditional fluorescence. In their design named molecular beacons (MBs, Figure 3(a)),68 the target‐specific segment of the probe is flanked by two short complementary and target‐independent extensions, one bound to a fluorescent dye and the other to a quencher that depletes the energy of the excited dye before it can release a photon. The base pairing between the two overhangs drives formation of a stem–loop structure containing the target recognition segment in its loop, and juxtaposing the fluorophore and the quencher (dark state, Figure 3(a)). In the presence of a target mRNA, probe hybridization causes the stem structure to melt, resulting in an increase in the distance between the dye and the quencher and thus a decrease of the efficiency of energy transfer between them (bright state, Figure 3(a)). As the intensity difference between the two states—the responsiveness—is sufficiently high (around an order of magnitude), MBs can efficiently detect and follow mRNA in vivo (Figure 3(a)). However, this requires modification of the nucleotide backbone to prevent MB and MB–RNA hybrid degradation triggered by nucleases. The first generation of MB harbored 2′O‐methylate nucleotides in the RNA backbone.69 More recently, the Bratu lab demonstrated that—as it does for miRNA detection—an LNA backbone70 increases the thermodynamic stability of the MB–RNA duplex, and thus sequences impervious to less stably binding 2′O‐Me‐MBs can be targeted and shorter beacons can be used in vivo.71 Despite nuclease resistance, some intracellular low‐level degradation of MBs always occurs, releasing intact fluorescent dye molecules and thus increasing background fluorescence.72 Also, MBs tend to accumulate in nuclei soon after delivery, deserting the cytoplasm that leads to a reduction of MB–target duplexes. To prevent this, Tyagi and Alsmadi coupled tetrameric streptavidin to biotinylated MBs and showed that these bulky probe complexes are retained within the cytoplasm and preserve the ability of the MB to sense target mRNA.73 This design was also utilized by Santangelo et al. to tetramerize short 2′O‐methyl RNA oligos labeled with conventional fluorophores. A few (usually two or three) of these multiply labeled tetravalent RNA imaging probes (MTRIP) per target has been shown to provide sufficient brightness and contrast to detect individual β‐actin mRNAs upon streptolysin‐O‐mediated delivery into living cells.74
Figure 3.
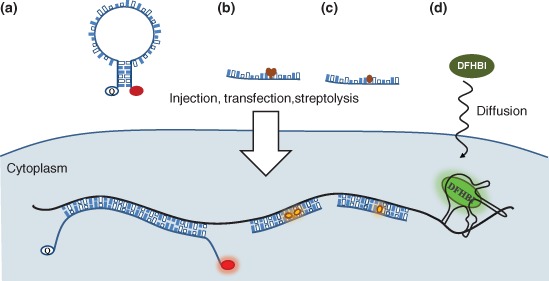
Fluorogenic approaches for RNA detection in situ and in vivo. (a) Molecular beacons. Upon hybridization the fluorophore goes from a quenched, dark state, into a nonquenched bright state. (b) Exciton‐controlled hybridization‐sensitive fluorescent oligonucleotide (ECHO) probes. One thymidine base is covalently coupled to a pair of thiazole orange (TO) dyes. During hybridization, the two TO dyes are displaced and locked by the surrounding stacking forces, resulting in an increase of fluorescence (bright state). (c) Forced intercalation (FIT) probes. One base is replaced by a single TO dye. When in duplex, the high viscosity arising from surrounding hydrogen bonds restricts rotational movement of the TO dye, resulting in an increased fluorescence (bright state). (d) Spinach and Spinach2. A transgenically encoded messenger RNA (mRNA) carrying the Spinach(2) aptamer binds to the nonfluorescent, cell‐permeable green fluorescent protein (GFP) fluorophore DFHBI, providing a protective environment that allows fluorescence to develop.
Another potential weakness of MBs intrinsic to their design is that the quencher remains within the energy transfer radius and thus reduces maximal brightness of the open, bright state of the probe and consequently decreases contrast.72 Contrast also suffers from aspecific, protein‐mediated opening of MBs.72 These limitations can be overcome by using multiple beacons per target necessary to detect individual transcripts,75 similar to smFISH. In 2004, Santangelo et al. implemented a dual MB labeling strategy based on fluorescence resonance energy transfer (FRET) between the nonquenched dyes of the two open beacons.76 Although the number of photons emanating from the acceptor upon FRET is only a fraction of what is obtained during direct excitation, efficient energy transfer only takes place when the two MBs are bound in a coordinated fashion, almost exclusively upon hybridizing to target and thus contrast increases, extending the dynamic range of studies using this approach.76
Intercalating DNA dyes provide another solution for reducing background caused by unbound probe molecules. Exciton‐controlled hybridization‐sensitive fluorescent oligonucleotide (ECHO) probes, developed by the Okamoto lab, harbor a chemically modified internal thymidine base coupled to two thiazole orange (TO) molecules.77, 78 When the probe is not bound to target, the excitonic interactions between the two TO molecules efficiently quench fluorescence (dark state). Upon hybridization, the hydrogen bonds between complementary Watson–Crick base pairs cause the two fluorophores to separate and intercalate into the forming duplex, increasing the fluorescent quantum yield by fourfold to eightfold and changing the absorption spectrum of the hybridized probe (bright state) (Figure 3(b)).
A similar, yet different design was introduced by the Seitz lab: in forced intercalation (FIT) probes, TO is introduced as a base surrogate.79 Probe hybridization forces the intercalation of TO, restricting intramolecular rotation of the dye and thus enhancing its fluorescent quantum yield and thus brightness (bright state) (Figure 3(c)) with remarkable (on average 10‐fold) responsiveness.
Applications and considerations of ECHO and FIT probes largely overlap with those of MBs. Both these TO‐based fluorogenic reactions were shown to work in a variety of nucleic acid contexts, ranging from natural RNA or DNA to nuclease‐resistant 2′O‐Me‐, LNA‐, and peptide nucleic acid (PNA)‐modified backbones.78, 79, 80, 81 The use of locked nucleic acids adjacent to the TO moiety uniquely offers further enhancement of duplex brightness due to the decreased stacking distances of bases, further increasing the viscosity around the intercalating TO dye. LNA modification of ECHO and FIT probes yielded an about twofold increase of responsiveness.81, 82 Another difference between intercalation‐based RNA detection and MBs is their sensitivity to mismatches. Obviously, if stringent enough conditions can be applied, e.g., during FISH analysis or PCR, most oligonucleotide probe‐based assays are capable of discriminating between SNPs of allelic transcripts.82, 83, 84 However, such conditions can rarely be met during in vivo analysis. MBs can respond only in an all‐or‐none fashion, regardless of the number of nonbase‐pairing nucleotides. ECHO and FIT probes, however, were shown to be sensitive to mismatches in the immediate vicinity of the TO dye(s) even under conditions close to those in living cells. Although SNP‐caused mismatches cause reduced responsiveness of the probes,82, 83 this property could potentially be exploited in SNP discriminating in vivo assays.
ECHO and FIT probes also offer the possibility of multiplexing, through substitution of the TO dye with a chemically modified TO derivative or related molecule of different spectral properties.85, 86, 87 A special form of such multicolor probe design consists of co‐labeling a single oligonucleotide with two fluorophores that can engage in energy transfer. Similarly to MB‐FRET,76 multilabeled ECHO probes,88 dual‐fluorophore‐labeled PNA FIT,89 and TO‐JO (oxazolopyridine)‐labeled DNA FIT probes80 possess greater responsiveness and thus better target discriminating ability, as efficient energy transfer only occurs between bright‐state fluorescent molecules. The high responsiveness of such probes allows wash‐free, single‐step RNA FISH, greatly decreasing the amount of time and labor required to develop the signal—even in large specimens—making these methods ideal tools for high‐throughput quantitative RNA localization studies.80
There have been considerable achievements made also in optimizing smFISH in the last 2 years: in 2013, the Raj lab showed that tweaking fixation and probe concentrations can reduce hybridization time to around a few minutes (turboFISH).90 The Tjian lab went one step further, and by exploiting intrinsically unstructured nucleic acid sequences—essentially omitting guanine‐containing target sequences—they managed to obtain subsecond scale hybridization rates that allowed detection of single freshly translated transcripts in vitro.91
In 2011, the Jaffrey lab introduced another, RNA‐aptamer‐based fluorogenic detection method that makes use of chemically synthesized nonfluorescent GFP‐like fluorophore (DFHBI), named Spinach.92 Upon specifically integrating into the aptamer structure, the essentially black DFHBI undergoes a remarkable, almost 2000‐fold increase in brightness in vitro. Although the original Spinach aptamer had context‐dependent folding issues rendering it barely useable for transgenic tagging of RNA molecules, serial mutagenesis yielded a more stable, faster folding and brighter version named Spinach2.93 As DFHBI is membrane permeable, delivery of the dye into living cells is less challenging and requires no sophisticated macromolecule delivery—e.g., microinjection, transfection, and streptolysin‐O—in contrast to MBs, ECHO, and FIT probes.
Similarly to FP‐based in vivo RNP imaging, these fluorogenic methods have intrinsic disadvantages, the most serious being the potential disruption of RNA secondary structures and/or RNA–protein interactions during duplex formation. Fortunately, the potential pitfalls of the two types of in vivo detection approaches are different, allowing co‐validation of different assays and confirmation of experimental results. On the other hand, targeted disruptions can be exploited in order to study functional RNA elements. In 2014, Hovelmann et al.81 showed that disrupting the stem region of the spliced oskar localization element with a detector FIT probe recapitulated the defect in RNP motility that was previously observed in experiments involving a classical, but much more time‐consuming transgenesis‐based mutational analysis.94
CONCLUSIONS/PERSPECTIVES
Over the past 15–20 years, with the exponential development of detection techniques and computational power, biological analysis has become increasingly quantitative and we have begun to understand the numeric variables underlying qualitative decision making in development, physiology, and disease. In situ visualization of single RNA molecules can be directly translated to diagnostics owing to the high sensitivity and SNP specificity, detecting e.g., viral infections and tumorous transformations early, before symptoms develop. Not only have these methods become powerful complementary approaches for obtaining spatiotemporal information on candidates from high‐throughput screens, they have also been developed into stand‐alone high‐content screening assays. The intrinsically provided large sample sizes and the preservation of the biological sample by single‐molecule in situ RNA detection may eventually yield the most accurate quantitative description of transcriptomes and transcriptome kinetics of cell populations, tissues, organs, and organisms. On the other hand, many of these assays offer unique insight into RNP dynamics and illuminate functional connections between structure, assembly, localization, translation, and decay. Equipped with these tools, biologists, physicists, and chemists are ready and eager to peer into the overwhelming, quantitative universe of nucleic acids.
ACKNOWLEDGMENTS
We are grateful to Mandy Jeske, Frank Wippich, and Felix Hövelmann for their helpful comments on the manuscript. We also thank the two reviewers for their critical reading and corrective suggestions.
REFERENCES
- 1. Gall JG, Pardue ML. Formation and detection of RNA‐DNA hybrid molecules in cytological preparations. Proc Natl Acad Sci USA 1969, 63:378–383. [DOI] [PMC free article] [PubMed] [Google Scholar]
- 2. Guesdon JL. Immunoenzymatic techniques applied to the specific detection of nucleic acids. A review. J Immunol Methods 1992, 150:33–49. [DOI] [PubMed] [Google Scholar]
- 3. Weil TT, Parton RM, Davis I. Making the message clear: visualizing mRNA localization. Trends Cell Biol 2010, 20:380–390. [DOI] [PMC free article] [PubMed] [Google Scholar]
- 4. Singer RH, Ward DC. Actin gene expression visualized in chicken muscle tissue culture by using in situ hybridization with a biotinated nucleotide analog. Proc Natl Acad Sci USA 1982, 79:7331–7335. [DOI] [PMC free article] [PubMed] [Google Scholar]
- 5. Kosman D, Mizutani CM, Lemons D, Cox WG, McGinnis W, Bier E. Multiplex detection of RNA expression in Drosophila embryos. Science 2004, 305:846. [DOI] [PubMed] [Google Scholar]
- 6. van de Corput MP, Dirks RW, van Gijlswijk RP, van de Rijke FM, Raap AK. Fluorescence in situ hybridization using horseradish peroxidase‐labeled oligodeoxynucleotides and tyramide signal amplification for sensitive DNA and mRNA detection. Histochem Cell Biol 1998, 110:431–437. [DOI] [PubMed] [Google Scholar]
- 7. Cmarko D, Koberna K. Electron microscopy in situ hybridization: tracking of DNA and RNA sequences at high resolution. Methods Mol Biol 2007, 369:213–228. [DOI] [PubMed] [Google Scholar]
- 8. Lecuyer E, Yoshida H, Parthasarathy N, Alm C, Babak T, Cerovina T, Hughes TR, Tomancak P, Krause HM. Global analysis of mRNA localization reveals a prominent role in organizing cellular architecture and function. Cell 2007, 131:174–187. [DOI] [PubMed] [Google Scholar]
- 9. Martin KC, Ephrussi A. mRNA localization: gene expression in the spatial dimension. Cell 2009, 136:719–730. [DOI] [PMC free article] [PubMed] [Google Scholar]
- 10. Medioni C, Mowry K, Besse F. Principles and roles of mRNA localization in animal development. Development 2012, 139:3263–3276. [DOI] [PMC free article] [PubMed] [Google Scholar]
- 11. St Johnston D. Moving messages: the intracellular localization of mRNAs. Nat Rev Mol Cell Biol 2005, 6:363–375. [DOI] [PubMed] [Google Scholar]
- 12. Lawrence JB, Singer RH. Intracellular localization of messenger RNAs for cytoskeletal proteins. Cell 1986, 45:407–415. [DOI] [PubMed] [Google Scholar]
- 13. Langer PR, Waldrop AA, Ward DC. Enzymatic synthesis of biotin‐labeled polynucleotides: novel nucleic acid affinity probes. Proc Natl Acad Sci USA 1981, 78:6633–6637. [DOI] [PMC free article] [PubMed] [Google Scholar]
- 14. Nederlof PM, van der Flier S, Raap AK, Tanke HJ. Quantification of inter‐ and intra‐nuclear variation of fluorescence in situ hybridization signals. Cytometry 1992, 13:831–838. [DOI] [PubMed] [Google Scholar]
- 15. Stanton LW. Methods to profile gene expression. Trends Cardiovasc Med 2001, 11:49–54. [DOI] [PubMed] [Google Scholar]
- 16. Shapiro E, Biezuner T, Linnarsson S. Single‐cell sequencing‐based technologies will revolutionize whole‐organism science. Nat Rev Genet 2013, 14:618–630. [DOI] [PubMed] [Google Scholar]
- 17. Cheong R, Paliwal S, Levchenko A. Models at the single cell level. WIREs Syst Biol Med 2010, 2:34–48. [DOI] [PMC free article] [PubMed] [Google Scholar]
- 18. Loewer A, Lahav G. We are all individuals: causes and consequences of non‐genetic heterogeneity in mammalian cells. Curr Opin Genet Dev 2011, 21:753–758. [DOI] [PMC free article] [PubMed] [Google Scholar]
- 19. Taniguchi Y, Choi PJ, Li GW, Chen H, Babu M, Hearn J, Emili A, Xie XS. Quantifying E. coli proteome and transcriptome with single‐molecule sensitivity in single cells. Science 2010, 329:533–538. [DOI] [PMC free article] [PubMed] [Google Scholar]
- 20. Vogelaar CF, Gervasi NM, Gumy LF, Story DJ, Raha‐Chowdhury R, Leung KM, Holt CE, Fawcett JW. Axonal mRNAs: characterisation and role in the growth and regeneration of dorsal root ganglion axons and growth cones. Mol Cell Neurosci 2009, 42:102–115. [DOI] [PMC free article] [PubMed] [Google Scholar]
- 21. Zivraj KH, Tung YC, Piper M, Gumy L, Fawcett JW, Yeo GS, Holt CE. Subcellular profiling reveals distinct and developmentally regulated repertoire of growth cone mRNAs. J Neurosci 2010, 30:15464–15478. [DOI] [PMC free article] [PubMed] [Google Scholar]
- 22. Femino AM, Fay FS, Fogarty K, Singer RH. Visualization of single RNA transcripts in situ. Science 1998, 280:585–590. [DOI] [PubMed] [Google Scholar]
- 23. Raj A, van den Bogaard P, Rifkin SA, van Oudenaarden A, Tyagi S. Imaging individual mRNA molecules using multiple singly labeled probes. Nat Methods 2008, 5:877–879. [DOI] [PMC free article] [PubMed] [Google Scholar]
- 24. Little SC, Tkacik G, Kneeland TB, Wieschaus EF, Gregor T. The formation of the Bicoid morphogen gradient requires protein movement from anteriorly localized mRNA. PLoS Biol 2011, 9:e1000596. [DOI] [PMC free article] [PubMed] [Google Scholar]
- 25. Little SC, Tikhonov M, Gregor T. Precise developmental gene expression arises from globally stochastic transcriptional activity. Cell 2013, 154:789–800. [DOI] [PMC free article] [PubMed] [Google Scholar]
- 26. Vargas DY, Shah K, Batish M, Levandoski M, Sinha S, Marras SA, Schedl P, Tyagi S. Single‐molecule imaging of transcriptionally coupled and uncoupled splicing. Cell 2011, 147:1054–1065. [DOI] [PMC free article] [PubMed] [Google Scholar]
- 27. Waks Z, Klein AM, Silver PA. Cell‐to‐cell variability of alternative RNA splicing. Mol Syst Biol 2011, 7:506. [DOI] [PMC free article] [PubMed] [Google Scholar]
- 28. Batish M, van den Bogaard P, Kramer FR, Tyagi S. Neuronal mRNAs travel singly into dendrites. Proc Natl Acad Sci USA 2012, 109:4645–4650. [DOI] [PMC free article] [PubMed] [Google Scholar]
- 29. Amrute‐Nayak M, Bullock SL. Single‐molecule assays reveal that RNA localization signals regulate dynein‐dynactin copy number on individual transcript cargoes. Nat Cell Biol 2012, 14:416–423. [DOI] [PMC free article] [PubMed] [Google Scholar]
- 30. Pare A, Lemons D, Kosman D, Beaver W, Freund Y, McGinnis W. Visualization of individual Scr mRNAs during Drosophila embryogenesis yields evidence for transcriptional bursting. Curr Biol 2009, 19:2037–2042. [DOI] [PMC free article] [PubMed] [Google Scholar]
- 31. Lubeck E, Cai L. Single‐cell systems biology by super‐resolution imaging and combinatorial labeling. Nat Methods 2012, 9:743–748. [DOI] [PMC free article] [PubMed] [Google Scholar]
- 32. Lubeck E, Coskun AF, Zhiyentayev T, Ahmad M, Cai L. Single‐cell in situ RNA profiling by sequential hybridization. Nat Methods 2014, 11:360–361. [DOI] [PMC free article] [PubMed] [Google Scholar]
- 33. Walter NG, Huang CY, Manzo AJ, Sobhy MA. Do‐it‐yourself guide: how to use the modern single‐molecule toolkit. Nat Methods 2008, 5:475–489. [DOI] [PMC free article] [PubMed] [Google Scholar]
- 34. Player AN, Shen LP, Kenny D, Antao VP, Kolberg JA. Single‐copy gene detection using branched DNA (bDNA) in situ hybridization. J Histochem Cytochem 2001, 49:603–612. [DOI] [PubMed] [Google Scholar]
- 35. Wang F, Flanagan J, Su N, Wang LC, Bui S, Nielson A, Wu X, Vo HT, Ma XJ, Luo Y. RNAscope: a novel in situ RNA analysis platform for formalin‐fixed, paraffin‐embedded tissues. J Mol Diagn 2012, 14:22–29. [DOI] [PMC free article] [PubMed] [Google Scholar]
- 36. Battich N, Stoeger T, Pelkmans L. Image‐based transcriptomics in thousands of single human cells at single‐molecule resolution. Nat Methods 2013, 10:1127–1133. [DOI] [PubMed] [Google Scholar]
- 37. Choi HM, Beck VA, Pierce NA. Next‐generation in situ hybridization chain reaction: higher gain, lower cost, greater durability. ACS Nano 2014, 8:4284–4294. [DOI] [PMC free article] [PubMed] [Google Scholar]
- 38. Dirks RM, Pierce NA. Triggered amplification by hybridization chain reaction. Proc Natl Acad Sci USA 2004, 101:15275–15278. [DOI] [PMC free article] [PubMed] [Google Scholar]
- 39. Lu J, Tsourkas A. Imaging individual microRNAs in single mammalian cells in situ. Nucleic Acids Res 2009, 37:e100. [DOI] [PMC free article] [PubMed] [Google Scholar]
- 40. Lu J, Tsourkas A. Quantification of miRNA abundance in single cells using locked nucleic acid‐FISH and enzyme‐labeled fluorescence. Methods Mol Biol 2011, 680:77–88. [DOI] [PubMed] [Google Scholar]
- 41. Lossi L, Gambino G, Salio C, Merighi A. Direct in situ RT‐PCR. Methods Mol Biol 2011, 789:111–126. [DOI] [PubMed] [Google Scholar]
- 42. Larsson C, Grundberg I, Soderberg O, Nilsson M. In situ detection and genotyping of individual mRNA molecules. Nat Methods 2010, 7:395–397. [DOI] [PubMed] [Google Scholar]
- 43. Kim S, Misra A. SNP genotyping: technologies and biomedical applications. Annu Rev Biomed Eng 2007, 9:289–320. [DOI] [PubMed] [Google Scholar]
- 44. Kumar S, Banks TW, Cloutier S. SNP discovery through next‐generation sequencing and its applications. Int J Plant Genomics 2012, 2012:831460. [DOI] [PMC free article] [PubMed] [Google Scholar]
- 45. Hansen CH, van Oudenaarden A. Allele‐specific detection of single mRNA molecules in situ. Nat Methods 2013, 10:869–871. [DOI] [PMC free article] [PubMed] [Google Scholar]
- 46. Levesque MJ, Ginart P, Wei Y, Raj A. Visualizing SNVs to quantify allele‐specific expression in single cells. Nat Methods 2013, 10:865–867. [DOI] [PMC free article] [PubMed] [Google Scholar]
- 47. Lee JH, Daugharthy ER, Scheiman J, Kalhor R, Yang JL, Ferrante TC, Terry R, Jeanty SS, Li C, Amamoto R, et al. Highly multiplexed subcellular RNA sequencing in situ. Science 2014, 343:1360–1363. [DOI] [PMC free article] [PubMed] [Google Scholar]
- 48. Becalska AN, Gavis ER. Lighting up mRNA localization in Drosophila oogenesis. Development 2009, 136:2493–2503. [DOI] [PMC free article] [PubMed] [Google Scholar]
- 49. Bertrand E, Chartrand P, Schaefer M, Shenoy SM, Singer RH, Long RM. Localization of ASH1 mRNA particles in living yeast. Mol Cell 1998, 2:437–445. [DOI] [PubMed] [Google Scholar]
- 50. Fusco D, Accornero N, Lavoie B, Shenoy SM, Blanchard JM, Singer RH, Bertrand E. Single mRNA molecules demonstrate probabilistic movement in living mammalian cells. Curr Biol 2003, 13:161–167. [DOI] [PMC free article] [PubMed] [Google Scholar]
- 51. Bothma JP, Garcia HG, Esposito E, Schlissel G, Gregor T, Levine M. Dynamic regulation of eve stripe 2 expression reveals transcriptional bursts in living Drosophila embryos. Proc Natl Acad Sci USA 2014, 111:10598–10603. [DOI] [PMC free article] [PubMed] [Google Scholar]
- 52. Darzacq X, Kittur N, Roy S, Shav‐Tal Y, Singer RH, Meier UT. Stepwise RNP assembly at the site of H/ACA RNA transcription in human cells. J Cell Biol 2006, 173:207–218. [DOI] [PMC free article] [PubMed] [Google Scholar]
- 53. Hocine S, Raymond P, Zenklusen D, Chao JA, Singer RH. Single‐molecule analysis of gene expression using two‐color RNA labeling in live yeast. Nat Methods 2013, 10:119–121. [DOI] [PMC free article] [PubMed] [Google Scholar]
- 54. Lucas T, Ferraro T, Roelens B, De Las Heras Chanes J, Walczak AM, Coppey M, Dostatni N. Live imaging of bicoid‐dependent transcription in Drosophila embryos. Curr Biol 2013, 23:2135–2139. [DOI] [PubMed] [Google Scholar]
- 55. Shav‐Tal Y, Darzacq X, Shenoy SM, Fusco D, Janicki SM, Spector DL, Singer RH. Dynamics of single mRNPs in nuclei of living cells. Science 2004, 304:1797–1800. [DOI] [PMC free article] [PubMed] [Google Scholar]
- 56. Durand S, Cougot N, Mahuteau‐Betzer F, Nguyen CH, Grierson DS, Bertrand E, Tazi J, Lejeune F. Inhibition of nonsense‐mediated mRNA decay (NMD) by a new chemical molecule reveals the dynamic of NMD factors in P‐bodies. J Cell Biol 2007, 178:1145–1160. [DOI] [PMC free article] [PubMed] [Google Scholar]
- 57. Katz ZB, Wells AL, Park HY, Wu B, Shenoy SM, Singer RH. β‐Actin mRNA compartmentalization enhances focal adhesion stability and directs cell migration. Genes Dev 2012, 26:1885–1890. [DOI] [PMC free article] [PubMed] [Google Scholar]
- 58. Haim L, Zipor G, Aronov S, Gerst JE. A genomic integration method to visualize localization of endogenous mRNAs in living yeast. Nat Methods 2007, 4:409–412. [DOI] [PubMed] [Google Scholar]
- 59. Park HY, Lim H, Yoon YJ, Follenzi A, Nwokafor C, Lopez‐Jones M, Meng X, Singer RH. Visualization of dynamics of single endogenous mRNA labeled in live mouse. Science 2014, 343:422–424. [DOI] [PMC free article] [PubMed] [Google Scholar]
- 60. Daigle N, Ellenberg J. LambdaN‐GFP: an RNA reporter system for live‐cell imaging. Nat Methods 2007, 4:633–636. [DOI] [PubMed] [Google Scholar]
- 61. Larson DR, Zenklusen D, Wu B, Chao JA, Singer RH. Real‐time observation of transcription initiation and elongation on an endogenous yeast gene. Science 2011, 332:475–478. [DOI] [PMC free article] [PubMed] [Google Scholar]
- 62. Rackham O, Brown CM. Visualization of RNA‐protein interactions in living cells: FMRP and IMP1 interact on mRNAs. EMBO J 2004, 23:3346–3355. [DOI] [PMC free article] [PubMed] [Google Scholar]
- 63. Ozawa T, Natori Y, Sato M, Umezawa Y. Imaging dynamics of endogenous mitochondrial RNA in single living cells. Nat Methods 2007, 4:413–419. [DOI] [PubMed] [Google Scholar]
- 64. Valencia‐Burton M, McCullough RM, Cantor CR, Broude NE. RNA visualization in live bacterial cells using fluorescent protein complementation. Nat Methods 2007, 4:421–427. [DOI] [PubMed] [Google Scholar]
- 65. Cheong CG, Hall TM. Engineering RNA sequence specificity of Pumilio repeats. Proc Natl Acad Sci USA 2006, 103:13635–13639. [DOI] [PMC free article] [PubMed] [Google Scholar]
- 66. Yamada T, Yoshimura H, Inaguma A, Ozawa T. Visualization of nonengineered single mRNAs in living cells using genetically encoded fluorescent probes. Anal Chem 2011, 83:5708–5714. [DOI] [PubMed] [Google Scholar]
- 67. Wu B, Chen J, Singer RH. Background free imaging of single mRNAs in live cells using split fluorescent proteins. Sci Rep 2014, 4:3615. [DOI] [PMC free article] [PubMed] [Google Scholar]
- 68. Tyagi S, Kramer FR. Molecular beacons: probes that fluoresce upon hybridization. Nat Biotechnol 1996, 14:303–308. [DOI] [PubMed] [Google Scholar]
- 69. Molenaar C, Marras SA, Slats JC, Truffert JC, Lemaitre M, Raap AK, Dirks RW, Tanke HJ. Linear 2' O‐methyl RNA probes for the visualization of RNA in living cells. Nucleic Acids Res 2001, 29:E89. [DOI] [PMC free article] [PubMed] [Google Scholar]
- 70. Wang L, Yang CJ, Medley CD, Benner SA, Tan W. Locked nucleic acid molecular beacons. J Am Chem Soc 2005, 127:15664–15665. [DOI] [PubMed] [Google Scholar]
- 71. Catrina IE, Marras SA, Bratu DP. Tiny molecular beacons: LNA/2'‐O‐methyl RNA chimeric probes for imaging dynamic mRNA processes in living cells. ACS Chem Biol 2012, 7:1586–1595. [DOI] [PMC free article] [PubMed] [Google Scholar]
- 72. Wu CS, Peng L, You M, Han D, Chen T, Williams KR, Yang CJ, Tan W. Engineering molecular beacons for intracellular imaging. Int J Mol Imaging 2012, 2012:501579. [DOI] [PMC free article] [PubMed] [Google Scholar]
- 73. Tyagi S, Alsmadi O. Imaging native β‐actin mRNA in motile fibroblasts. Biophys J 2004, 87:4153–4162. [DOI] [PMC free article] [PubMed] [Google Scholar]
- 74. Santangelo PJ, Lifland AW, Curt P, Sasaki Y, Bassell GJ, Lindquist ME, Crowe JE Jr. Single molecule‐sensitive probes for imaging RNA in live cells. Nat Methods 2009, 6:347–349. [DOI] [PMC free article] [PubMed] [Google Scholar]
- 75. Vargas DY, Raj A, Marras SA, Kramer FR, Tyagi S. Mechanism of mRNA transport in the nucleus. Proc Natl Acad Sci USA 2005, 102:17008–17013. [DOI] [PMC free article] [PubMed] [Google Scholar]
- 76. Santangelo PJ, Nix B, Tsourkas A, Bao G. Dual FRET molecular beacons for mRNA detection in living cells. Nucleic Acids Res 2004, 32:e57. [DOI] [PMC free article] [PubMed] [Google Scholar]
- 77. Kubota T, Ikeda S, Yanagisawa H, Yuki M, Okamoto A. Hybridization‐sensitive fluorescent probe for long‐term monitoring of intracellular RNA. Bioconjug Chem 2009, 20:1256–1261. [DOI] [PubMed] [Google Scholar]
- 78. Okamoto A. ECHO probes: a concept of fluorescence control for practical nucleic acid sensing. Chem Soc Rev 2011, 40:5815–5828. [DOI] [PubMed] [Google Scholar]
- 79. Kohler O, Jarikote DV, Seitz O. Forced intercalation probes (FIT Probes): thiazole orange as a fluorescent base in peptide nucleic acids for homogeneous single‐nucleotide‐polymorphism detection. Chembiochem 2005, 6:69–77. [DOI] [PubMed] [Google Scholar]
- 80. Hovelmann F, Gaspar I, Ephrussi A, Seitz O. Brightness enhanced DNA FIT‐probes for wash‐free RNA imaging in tissue. J Am Chem Soc 2013, 135:19025–19032. [DOI] [PubMed] [Google Scholar]
- 81. Hovelmann F, Gaspar I, Loibl S, Ermilov EA, Roder B, Wengel J, Ephrussi A, Seitz O. Brightness through local constraint—LNA‐enhanced FIT hybridization probes for in vivo ribonucleotide particle tracking. Angew Chem Int Ed Engl 2014, 53:11370–11375. [DOI] [PubMed] [Google Scholar]
- 82. Sugizaki K, Okamoto A. ECHO‐LNA conjugates: hybridization‐sensitive fluorescence and its application to fluorescent detection of various RNA strands. Bioconjug Chem 2010, 21:2276–2281. [DOI] [PubMed] [Google Scholar]
- 83. Socher E, Jarikote DV, Knoll A, Roglin L, Burmeister J, Seitz O. FIT probes: peptide nucleic acid probes with a fluorescent base surrogate enable real‐time DNA quantification and single nucleotide polymorphism discovery. Anal Biochem 2008, 375:318–330. [DOI] [PubMed] [Google Scholar]
- 84. Tyagi S, Bratu DP, Kramer FR. Multicolor molecular beacons for allele discrimination. Nat Biotechnol 1998, 16:49–53. [DOI] [PubMed] [Google Scholar]
- 85. Ikeda S, Kubota T, Yuki M, Okamoto A. Exciton‐controlled hybridization‐sensitive fluorescent probes: multicolor detection of nucleic acids. Angew Chem Int Ed Engl 2009, 48:6480–6484. [DOI] [PubMed] [Google Scholar]
- 86. Kummer S, Knoll A, Socher E, Bethge L, Herrmann A, Seitz O. PNA FIT‐probes for the dual color imaging of two viral mRNA targets in influenza H1N1 infected live cells. Bioconjug Chem 2012, 23:2051–2060. [DOI] [PubMed] [Google Scholar]
- 87. Wang DO, Matsuno H, Ikeda S, Nakamura A, Yanagisawa H, Hayashi Y, Okamoto A. A quick and simple FISH protocol with hybridization‐sensitive fluorescent linear oligodeoxynucleotide probes. RNA 2012, 18:166–175. [DOI] [PMC free article] [PubMed] [Google Scholar]
- 88. Okamoto A, Sugizaki K, Yuki M, Yanagisawa H, Ikeda S, Sueoka T, Hayashi G, Wang DO. A nucleic acid probe labeled with desmethyl thiazole orange: a new type of hybridization‐sensitive fluorescent oligonucleotide for live‐cell RNA imaging. Org Biomol Chem 2013, 11:362–371. [DOI] [PubMed] [Google Scholar]
- 89. Socher E, Knoll A, Seitz O. Dual fluorophore PNA FIT‐probes—extremely responsive and bright hybridization probes for the sensitive detection of DNA and RNA. Org Biomol Chem 2012, 10:7363–7371. [DOI] [PubMed] [Google Scholar]
- 90. Shaffer SM, Wu MT, Levesque MJ, Raj A. Turbo FISH: a method for rapid single molecule RNA FISH. PLoS One 2013, 8:e75120. [DOI] [PMC free article] [PubMed] [Google Scholar]
- 91. Zhang Z, Revyakin A, Grimm JB, Lavis LD, Tjian R. Single‐molecule tracking of the transcription cycle by sub‐second RNA detection. Elife 2014, 3:e01775. [DOI] [PMC free article] [PubMed] [Google Scholar]
- 92. Paige JS, Wu KY, Jaffrey SR. RNA mimics of green fluorescent protein. Science 2011, 333:642–646. [DOI] [PMC free article] [PubMed] [Google Scholar]
- 93. Strack RL, Disney MD, Jaffrey SR. A superfolding Spinach2 reveals the dynamic nature of trinucleotide repeat‐containing RNA. Nat Methods 2013, 10:1219–1224. [DOI] [PMC free article] [PubMed] [Google Scholar]
- 94. Ghosh S, Marchand V, Gaspar I, Ephrussi A. Control of RNP motility and localization by a splicing‐dependent structure in oskar mRNA. Nat Struct Mol Biol 2012, 19:441–449. [DOI] [PubMed] [Google Scholar]