

Abstract
Aims
To assess the effects of renal impairment (RI) on the efficacy and safety of ipragliflozin in patients with type 2 diabetes mellitus (T2DM).
Methods
A cohort of Japanese patients with T2DM and mild to moderate RI and poor glycaemic control, despite diet/exercise therapy alone or diet/exercise therapy in combination with an oral hypoglycaemic agent (an α‐glucosidase inhibitor, a sulfonylurea, or pioglitazone), were randomized in a double‐blind manner to 50 mg ipragliflozin or placebo once daily for 24 weeks. The patients continued open‐label ipragliflozin for a 28‐week extension period (total treatment duration: 52 weeks).
Results
Ipragliflozin significantly decreased glycated haemoglobin (HbA1c) and fasting plasma glucose (FPG) levels and body weight from baseline to week 24 (last observation carried forward) compared with placebo in all patients with RI. The decreases in HbA1c and FPG levels were statistically significant in patients with mild RI, but not in patients with moderate RI. Ipragliflozin significantly reduced body weight in both RI groups. The improvements in glycaemic control were maintained in the 28‐week extension period. Ipragliflozin was associated with no clinically significant safety concerns, and its safety profiles were not influenced by the severity of RI.
Conclusions
Ipragliflozin significantly improved glycaemic control and body weight in patients with T2DM with mild RI, but did not improve glycaemic control in patients with moderate RI. Ipragliflozin is a valid treatment option for patients with mild RI but not those with moderate RI.
Keywords: SGLT2 inhibitor
Introduction
Sodium–glucose co‐transporter (SGLT) 1 and SGLT2 are solute transporters that use the electrochemical gradient of Na+ to actively transport glucose into cells. Mutations in these transporters significantly affect glucose absorption from the gastrointestinal tract (SGLT1) or glucose reuptake from renal tubules (SGLT2) 1, 2. SGLT2 is responsible for ∼90% of glucose reuptake in the kidney 3, and inhibition of renal glucose reuptake was confirmed to reduce blood glucose levels 4; therefore, several SGLT2 inhibitors have been developed as novel treatments for type 2 diabetes mellitus (T2DM).
Ipragliflozin is an orally bioavailable SGLT2‐selective inhibitor discovered through joint research between Astellas Pharma Inc. and Kotobuki Pharmaceutical Co., Ltd. that was approved in January 2014 for T2DM treatment. Preclinical and initial clinical trials have shown that ipragliflozin significantly improves glycaemic control in animal models of diabetes 5, 6 and in patients with T2DM 7, 8, 9. Furthermore, ipragliflozin was associated with significant reductions in body weight and was well tolerated in these clinical studies.
Because of its mechanism of action, there is some concern that the efficacy and safety of ipragliflozin might be compromised in patients with renal impairment (RI). We therefore conducted a randomized, placebo‐controlled, multicentre study to examine the effects of RI on the efficacy and safety of ipragliflozin. A cohort of Japanese patients with T2DM and mild or moderate RI were treated with ipragliflozin or placebo in a double‐blind manner for 24 weeks, followed by an open‐label 28‐week extension in which all patients received ipragliflozin.
Methods
The present exploratory study was conducted in 67 institutions in Japan between January 2011 and November 2012. The study was conducted in accordance with the Standards for Conduct of Clinical Trials of Drugs (Good Clinical Practice), the International Conference on Harmonisation of Technical Requirements for Registration of Pharmaceuticals for Human Use Guidelines and applicable laws and regulations. The study was approved by institutional review boards at all participating institutions. The study is registered at ClinicalTrials.gov (registration number: NCT01316094).
Patients
Patients aged 20–74 years who were diagnosed with T2DM ≥12 weeks before providing informed consent were eligible if they: 1) were currently on diet/exercise therapy alone or in combination with an α‐glucosidase inhibitor, a sulfonylurea, or pioglitazone in a constant dosing regimen; 2) had poor glycaemic control despite treatment, defined as a glycated haemoglobin (HbA1c) of 6.9–8.9% (National Glycohemoglobin Standardization Program [NGSP] units), a change in HbA1c of ≤1.0% between visits 1 and 2, and a fasting blood glucose concentration of ≥ 6.99 mmol/l (126 mg/dl) for patients using a sulfonylurea; 3) had a BMI of 20.0–45.0 kg/m2; and 4) had mild (estimated glomerular filtration rate [eGFR] ≥60 to <90 ml/min/1.73 m2) or moderate RI (eGFR ≥30 to <60 ml/min/1.73 m2). All patients provided written informed consent. Exclusion criteria are listed in the Supporting Information (File S1).
Study Design and Treatments
The study consisted of a 4‐week screening period, a 2‐week run‐in period in which all patients received placebo, treatment period 1 (24 weeks), treatment period 2 (28 weeks) and a 4‐week follow‐up period (Figure S1). At the end of the run‐in period, patients were randomized at a 2 : 1 ratio to receive 50 mg ipragliflozin or placebo. Randomization was performed after stratifying patients according to RI severity. Treatment period 1 was conducted in a double‐blind and parallel‐group manner in which the patients took the allocated tablet once daily before breakfast for 24 weeks. At the end of treatment period 1, all patients who agreed to continue the study and who had no safety concerns switched to open‐label treatment with ipragliflozin, which was continued for 28 weeks in treatment period 2. At week 24, the ipragliflozin dose to be used in treatment period 2 could be increased to 100 mg in patients who met the following criteria: an HbA1c level of ≥7.4% at week 20 for patients whose HbA1c level was ≥7.4% at week 0; an HbA1c level of ≥6.9% at week 20 for patients whose HbA1c level was <7.4% at week 0; and a willingness to use a higher dose. The dose could be reduced to 50 mg if there were possible safety concerns, but the dose could not be increased again after the dose reduction. Other patients continued 50 mg ipragliflozin in treatment period 2.
Patients continued their diet/exercise therapy throughout both treatment periods. Patients who had used an oral hypoglycaemic agent for ≥12 weeks before the start of the study were permitted to continue the drug at the same dose throughout the study; changes in the dosing regimen or switching to an alternative drug were prohibited. Concomitant use of hypoglycaemic agents other than an α‐glucosidase inhibitor, a sulfonylurea, or pioglitazone was prohibited.
The efficacy endpoints were HbA1c, fasting plasma glucose (FPG), fasting serum insulin, leptin and adiponectin levels, body weight and waist circumference. HbA1c values were initially reported in Japan Diabetes Society units and were converted into NGSP units using the following equation 10:
Safety outcomes included treatment‐emergent adverse events (TEAEs), vital signs, laboratory variables (measured using routine methods at Mitsubishi Chemical Medience Corporation), 12‐lead ECG and eGFR, which was calculated using the following equation 11:
Statistical Analysis
The sample size calculation, analysis populations and statistical methods are described in the Supporting Information (File S2). For all efficacy and safety variables, changes from baseline to week 24 or 52 were analysed using the last observation carried forward method to impute missing data.
Results
Patient Characteristics
Of 312 patients who initially consented to participate in the study, 277 received placebo during the run‐in period. In treatment period 1, 165 patients were assigned to the placebo (46 patients) or the ipragliflozin group (119 patients). One patient with mild RI in the ipragliflozin group lacked efficacy data in treatment period 1 and was excluded from the full analysis set. Of the patients allocated to ipragliflozin in treatment period 1, 102 entered treatment period 2 (Figure 1). Patient characteristics are summarized in Table 1. There were no marked differences in patient characteristics between the ipragliflozin and the placebo group, irrespective of RI severity (data not shown).
Figure 1.
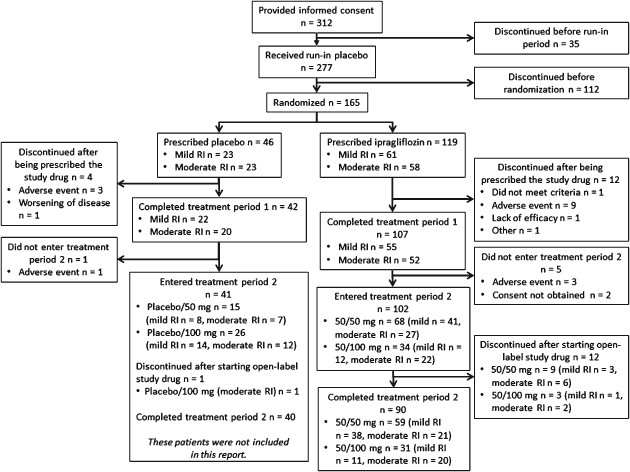
Patient disposition. Data for treatment period 2 are not shown for patients allocated to placebo in treatment period 1. RI, renal impairment.
Table 1.
Patient characteristics (full analysis set)
| Ipragliflozin | Placebo | |
|---|---|---|
| No. of patients | 118* | 46 |
| Sex, n (%) | ||
| Males | 92 (78.0) | 36 (78.3) |
| Females | 26 (22.0) | 10 (21.7) |
| Age† , years, mean ± s.d. | 63.9 ± 6.59 | 65.7 ± 6.93 |
| <65 years | 63 (53.4) | 18 (39.1) |
| ≥65 years | 55 (46.6) | 28 (60.9) |
| Body weight‡, kg, mean ± s.d. | 69.16 ± 11.571 | 66.70 ± 10.940 |
| BMI‡, kg/m2, mean ± s.d. | 25.84 ± 3.450 | 24.96 ± 3.362 |
| <25 kg/m2 | 54 (45.8) | 29 (63.0) |
| ≥25 kg/m2 | 64 (54.2) | 17 (37.0) |
| Duration of diabetes‡, months, mean ± s.d. | 114.3 ± 92.26 | 113.0 ± 99.77 |
| Duration of diabetes, n (%) | ||
| <60 months | 34 (29.8) | 14 (33.3) |
| ≥60 months | 80 (70.2) | 28 (66.7) |
| Concurrent hypertension†, n (%) | ||
| Absent | 27 (22.9) | 15 (32.6) |
| Present | 91 (77.1) | 31 (67.4) |
| Systolic blood pressure§, mmHg, mean ± s.d. | 133.0 ± 12.48 | 134.1 ± 12.41 |
| Diastolic blood pressure§, mmHg, mean ± s.d. | 78.2 ± 8.61 | 74.8 ± 10.12 |
| Smoking history†, n (%) | ||
| No history of smoking | 43 (36.4) | 14 (30.4) |
| Ex‐smoker | 55 (46.6) | 24 (52.2) |
| Current smoker | 20 (16.9) | 8 (17.4) |
| Concomitant oral hypoglycaemic agents‡, n (%) | ||
| Absent | 36 (30.5) | 10 (21.7) |
| Present | 82 (69.5) | 36 (78.3) |
| Type of concomitant oral hypoglycaemic agents‡, n (%) | ||
| α‐glucosidase inhibitor | 15 (12.7) | 9 (19.6) |
| Sulfonylurea | 52 (44.1) | 20 (43.5) |
| Pioglitazone | 15 (12.7) | 7 (15.2) |
| Severity of renal impairment¶, **, n (%) | ||
| Mild | 60 (50.8) | 23 (50.0) |
| Moderate | 58 (49.2) | 23 (50.0) |
| HbA1c¶, %, NGSP, mean ± s.d. | 7.53 ± 0.538 | 7.55 ± 0.526 |
| FPG¶, [mmol/l (mg/dl)], mean ± s.d. | 8.11 ± 1.335 (144.3 ± 22.63) | 8.23 ± 1.373 (143.8 ± 23.89) |
| eGFR¶, ml/min/1.73 m2, mean ± s.d. | 60.2 ± 13.08 | 62.7 ± 13.13 |
| eGFR, n (%) | ||
| <60 ml/min/1.73 m2 | 57 (48.3) | 22 (47.8) |
| ≥60 ml/min/1.73 m2 | 61 (51.7) | 24 (52.2) |
eGFR, estimated glomerular filtration rate; FPG, fasting plasma glucose; HbA1c, glycated haemoglobin; NGSP, National Glycohemoglobin Standardization Program; RI, renal impairment; s.d., standard deviation.
One patient with mild RI in the ipragliflozin group lacked efficacy data in treatment period 1 and was excluded from the full analysis set.
At the time of informed consent.
At screening.
At the start of treatment period 1.
During the placebo run‐in period.
The severity of RI was rated as mild (eGFR 60 to <90 ml/min/1.73 m2) or moderate (eGFR 30 to <60 ml/min/1.73 m2) based on eGFR measured at visit 2.
Efficacy in Treatment Period 1 in all Patients
The mean change in HbA1c level from baseline to week 24 was −0.42% in the ipragliflozin group versus −0.17% in the placebo group, corresponding to a placebo‐adjusted mean difference of −0.25% (P = 0.004; Table S1; Figure 2). The reduction in HbA1c was apparent by week 4 and continued until week 24. Greater proportions of patients had an HbA1c level <7.0% at the end of treatment period 1 in the ipragliflozin group than in the placebo group (Table 2). The reductions in FPG were also significantly greater in the ipragliflozin group than in the placebo group (Table S1), with changes that were apparent by week 4 and continued until week 24 (Figure S2A). The mean change in leptin level from baseline to week 24 was significantly different between the two groups, whereas the changes in insulin and adiponectin were not significantly different between the two groups (Table S1). The mean reduction in body weight from baseline to week 24 was significantly greater in the ipragliflozin group than in the placebo group (−1.87 vs. −0.06 kg; adjusted mean difference: −1.77 kg; P < 0.001; Figure S2B). Reductions in body weight were apparent by 4 weeks of treatment in the ipragliflozin group, and continued throughout treatment period 1. Waist circumference tended to decrease in both groups, although not significantly (Table S1).
Figure 2.
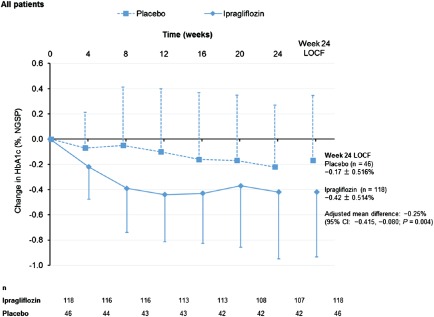
Change in glycated haemoglobin (HbA1c) from baseline to endpoint in all patients according to treatment group. CI, confidence interval; NGSP, National Glycohemoglobin Standardization Program.
Table 2.
Proportions of patients with HbA1c <7.0% in treatment period 1
| All patients, n/N (%) | Patients with mild renal impairment, n/N (%) | Patients with moderate renal impairment, n/N (%) | ||||
|---|---|---|---|---|---|---|
| Ipragliflozin | Placebo | Ipragliflozin | Placebo | Ipragliflozin | Placebo | |
| Baseline | 12/118 (10.2) | 2/46 (4.3) | 7/60 (11.7) | 0/23 (0.0) | 5/58 (8.6) | 2/23 (8.7) |
| End of treatment period 1 (LOCF) | 55/118 (46.6) | 13/46 (28.3) | 35/60 (58.3) | 7/23 (30.4) | 20/58 (34.5) | 6/23 (26.1) |
Effects of Renal Impairment Severity on the Efficacy of Ipragliflozin in Treatment Period 1
The reductions in HbA1c levels were greater in patients with less severe RI in the ipragliflozin and placebo groups (Figure 3). This was also apparent when we plotted the reduction in HbA1c against eGFR at baseline (Figure S3). In patients with mild RI, the mean change in HbA1c level from baseline to week 24 was significantly greater in the ipragliflozin group than in the placebo group (−0.56 vs. −0.26%; adjusted mean difference: −0.35%; P < 0.001; Figure 3); however, in patients with moderate RI, the reduction of HbA1c was not significantly different between the ipragliflozin and placebo groups (Figure 3). The reductions in HbA1c were greater in patients with higher baseline values irrespective of RI severity. Furthermore, greater proportions of patients had HbA1c levels <7.0% at week 24 in the ipragliflozin group than in the placebo group, irrespective of RI severity (Table 2).
Figure 3.
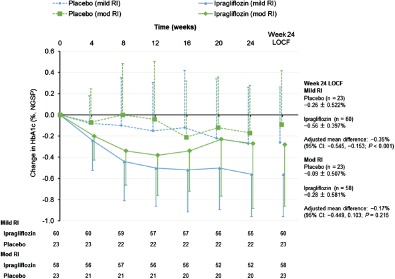
Change in glycated haemoglobin (HbA1c) from baseline to endpoint in patients with mild or moderate renal impairment (RI) according to treatment group. The changes from baseline to week 24 are also shown with the LOCF to impute missing data. Data are shown as the mean ± standard deviation. NGSP, National Glycohemoglobin Standardization Program.
Among patients with mild RI, the mean change in FPG from baseline to week 24 was significantly greater in the ipragliflozin group than in the placebo group (−0.93 mmol/l vs. −0.10 mmol/l [−16.7 mg/dl vs. −1.8 mg/dl]; adjusted mean difference: −0.82 mmol/l [−14.8 mg/dl]; P < 0.001; Figure S4). By contrast, in patients with moderate RI, the reduction in FPG was not significantly different between the ipragliflozin and the placebo groups (Figure S4).
The mean change in body weight from baseline to week 24 was significantly (P < 0.001) greater in the ipragliflozin group than in the placebo group in patients with mild RI and in patients with moderate RI (Figure 4).
Figure 4.
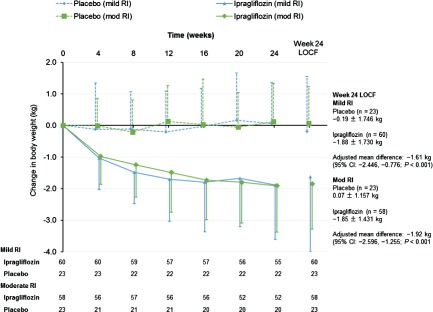
Change in body weight from baseline to endpoint in patients with mild or moderate renal impairment (RI) according to treatment group. The changes from baseline to week 24 are also shown with the LOCF to impute missing data. Data are shown as the mean ± standard deviation.
Efficacy in Treatment Period 2 in Patients who Received Ipragliflozin in Treatment Period 1
Because of the small number of patients in the placebo group who were eligible to enter treatment period 2, we focused on patients who were randomized to ipragliflozin in treatment period 1 and who received 50 or 100 mg ipragliflozin in treatment period 2. The improvements in HbA1c (Figure S5A), FPG (Figure S5B) and body weight (Figure S5C) observed at week 24 were maintained until week 52 in both dose groups.
Efficacy in Treatment Period 2 in Ipragliflozin‐Treated Patients Stratified by Renal Impairment Severity
The mean HbA1c values at baseline, week 24 and week 52 were 7.45, 6.89 and 6.91% respectively, in patients with mild RI and 7.59, 7.31 and 7.26%, respectively, in patients with moderate RI (Figure S6A). The mean FPG values at baseline, week 24 and week 52 were 7.95 mmol/l (143.1 mg/dl), 7.05 mmol/l (126.9 mg/dl) and 7.02 mmol/l (126.3 mg/dl) respectively, in patients with mild, RI and 8.09 mmol/l (145.6 mg/dl), 7.61 mmol/l (137.0 mg/dl) and 7.58 mmol/l (136.5 mg/dl) respectively, in patients with moderate RI (Figure S6B). The mean changes in body weight from baseline to weeks 24 and 52 were −1.88 and −2.13 kg respectively, in patients with mild RI, and −1.85 and −2.18 kg respectively, in patients with moderate RI (Figure 4, Figure S6C).
Safety in Treatment Period 1 According to Renal Impairment Severity
The incidence rates of TEAEs in the ipragliflozin and placebo groups were 80.3% (49/61) and 78.3% (18/23), respectively, in patients with mild RI (P = 1.000) and 82.8% (48/58) and 69.6% (16/23), respectively, in patients with moderate RI (P = 0.230; Table 3).
Table 3.
Safety profile in treatment period 1 (safety analysis set)
| All patients, n (%) | Mild renal impairment, n (%)* | Moderate renal impairment, n (%)* | ||||
|---|---|---|---|---|---|---|
| Ipragliflozin | Placebo | Ipragliflozin | Placebo | Ipragliflozin | Placebo | |
| Male patients/female patients/total patients | 93/26/119 | 36/10/46 | 46/15/61 | 20/3/23 | 47/11/58 | 16/7/23 |
| Patients with TEAEs | 97 (81.5) | 34 (73.9) | 49 (80.3) | 18 (78.3) | 48 (82.8) | 16 (69.6) |
| Number of TEAEs | 224 | 96 | 104 | 46 | 120 | 50 |
| Patients with SAEs | 8 (6.7) | 2 (4.3) | 5 (8.2) | 1 (4.3) | 3 (5.2) | 1 (4.3) |
| TEAEs leading to treatment discontinuation | 12 (10.1) | 4 (8.7) | 6 (9.8) | 1 (4.3) | 6 (10.3) | 3 (13.0) |
| TEAEs of special interest | ||||||
| TEAEs related to hypoglycaemia | 1 (0.8) | 0 | 0 | 0 | 1 (1.7) | 0 |
| TEAEs related to urinary tract infection | 1 (0.8) | 2 (4.3) | 0 | 0 | 1 (1.7) | 2 (8.7) |
| Males | 1 (1.1) | 0 | 0 | 0 | 1 (2.1) | 0 |
| Females | 0 | 2 (20.0) | 0 | 0 | 0 | 2 (28.6) |
| TEAEs related to genital infection | 1 (0.8) | 0 | 1 (1.6) | 0 | 0 | 0 |
| Males | 0 | 0 | 0 | 0 | 0 | 0 |
| Females | 1 (3.8) | 0 | 1 (6.7) | 0 | 0 | 0 |
| TEAEs related to polyuria or pollakiuria | 10 (8.4) | 2 (4.3) | 5 (8.2) | 2 (8.7) | 5 (8.6) | 0 |
eGFR, estimated glomerular filtration rate; SAE, serious adverse event; TEAE, treatment‐emergent adverse event.
The severity of renal impairment was rated as mild (eGFR: 60 to <90 ml/min/1.73 m2) or moderate (eGFR: 30 to <60 ml/min/1.73 m2) based on the eGFR at visit 2.
In patients with mild RI, serious adverse events (SAEs) occurred in 8.2% (5/61) and 4.3% (1/23) of patients in the ipragliflozin and placebo groups, respectively. The corresponding rates in patients with moderate RI were 5.2% (3/58) and 4.3% (1/23). The SAEs for which a causal relationship to the investigational product could not be excluded were upper gastrointestinal haemorrhage in one ipragliflozin‐treated patient with moderate RI and complete atrioventricular block in one placebo‐treated patient with moderate RI.
Among patients with mild RI, TEAEs led to treatment discontinuation in 9.8% (6/61) and 4.3% (1/23) of patients in the ipragliflozin and placebo groups, respectively. The corresponding rates in patients with moderate RI were 10.3% (6/58) and 13.0% (3/23).
Treatment‐Emergent Adverse Events of Special Interest
Treatment‐emergent adverse events related to hypoglycaemia (0.8% [1/119] and 0% [0/46] in the ipragliflozin and placebo groups, respectively), urinary tract infection (0.8% [1/119] and 4.3% [2/46] in the ipragliflozin and placebo groups, respectively), and genital infection (0.8% [1/119] and 0% [0/46] in the ipragliflozin and placebo groups, respectively) occurred in <5% of patients. Polyuria/pollakiuria occurred in 8.4% (10/119) and 4.3% (2/46) of patients in the ipragliflozin and placebo groups, respectively. In terms of TEAEs of special interest, only the incidence of TEAEs related to polyuria/pollakiuria was more common in the ipragliflozin group, occurring in 5 of 61 patients (8.2%) with mild RI and 5 of 58 patients (8.6%) with moderate RI in the ipragliflozin group and in 2 of 23 patients (8.7%) with mild RI in the placebo group. The incidences of TEAEs related to hypoglycaemia, urinary tract infection and genital infection were low and similar in the ipragliflozin and placebo groups (Table 3). Adverse events related to hypoglycaemia occurred in one patient (with concomitant sulfonylurea) in the ipragliflozin group in treatment period 1. The incidence of TEAEs was not significantly different between patients with mild or moderate RI.
Safety in Treatment Periods 1 and 2 Combined, for Patients Treated with Ipragliflozin in Both Periods
Over 52 weeks, TEAEs occurred in 93.3% of patients (111/119) (Table S2), including 93.4% of patients (57/61) with mild RI and 93.1% of patients (54/58) with moderate RI. Adverse events related to hypoglycaemia occurred in seven subjects (two without other concomitant oral hypoglycaemic agents and five with concomitant sulfonylureas) in the ipragliflozin group in treatment periods 1 and 2. The incidence rates of specific TEAEs, SAEs, or TEAEs leading to treatment discontinuation did not increase over time in patients with mild or moderate RI.
Laboratory Variables and Vital Signs in Treatment Periods 1 and 2
The mean change in eGFR from baseline to week 24 was greater in the ipragliflozin group than in the placebo group in the first 2–4 weeks of treatment in patients with mild or moderate RI (Table S3); however, eGFR in the ipragliflozin‐treated patients returned towards the baseline level by the end of treatment period 1. Creatinine levels also increased in the short term but returned to normal by the end of treatment period 1 in ipragliflozin‐treated patients. Blood urea nitrogen, cystatin C and haematocrit levels increased in the ipragliflozin group of patients with mild or moderate RI (Table S3). Alanine aminotransferase levels and aspartate aminotransferase levels decreased in the ipragliflozin group, and the changes from baseline were greater than those in the placebo group (Table S3). Ipragliflozin was associated with slight increases in serum or urine electrolytes, including magnesium and phosphorus (Table S3). There were no marked differences between the ipragliflozin and placebo groups in terms of other laboratory variables measured at baseline or week 24 (Table S3). Furthermore, there were no marked differences between patients with mild or moderate RI (Table S3).
Systolic and diastolic blood pressure tended to decrease in the ipragliflozin group compared with the placebo group in the overall cohort of patients and in patients with mild or moderate RI (Table S3).
Clinically significant new abnormalities on 12‐lead ECG were detected in treatment period 1 in two patients with moderate RI in the ipragliflozin group and in one patient with mild RI in the placebo group. These abnormalities were reported as TEAEs and were not considered related to the study drug.
There were no further changes in laboratory test values or vital signs during treatment period 2 (Table S3). A clinically significant abnormality was detected by 12‐lead ECG in treatment period 2 in one patient with mild RI whose ipragliflozin dose had been escalated in this period. The event was reported as a TEAE (mild arrhythmia) and a causal relationship to the study drug was not excluded.
Discussion
In the present study, treatment with ipragliflozin for 24 weeks was associated with significantly greater improvements in glycaemic control and body weight in the ipragliflozin group than in the placebo group in the overall cohort, and in patients with mild RI. In patients with moderate RI, the improvements in glycaemic control were not significantly greater in the ipragliflozin group than in the placebo group. The improvements in glycaemic control in patients with mild RI and the reduction in body weight in patients with mild or moderate RI were apparent by week 4 of treatment and were maintained at week 52.
The mean changes in HbA1c and FPG from baseline to week 24 in the ipragliflozin group in the present study were smaller than those observed in earlier studies of ipragliflozin [HbA1c: −0.64 to −0.87%; FPG: −1.23 mmol/l (−22.2 mg/dl) to −2.30 mmol/l (−41.4 mg/dl)] 12, 13, 14 that enrolled patients with normal serum creatinine levels. When analysed according to the severity of renal dysfunction, the reductions in HbA1c and FPG levels were smaller in patients with moderate RI than in patients with mild RI. The same tendency was observed for the changes in HbA1c and FPG from baseline to week 52. RI was also associated with less efficient reductions in HbA1c and FPG in studies on canagliflozin 15 and dapagliflozin 16 in Western populations. There are several possible explanations for this. First, because the mean HbA1c level at baseline was lower in the present study than in the earlier studies (7.52 vs. 8.24–8.38%) 12, 14, the capacity for a reduction in HbA1c level was lower in the present study relative to the earlier ipragliflozin studies. Second, glomerular filtration of glucose is essential for the clinical effects of SGLT2 inhibitors. The patients enrolled in the present study had mild to moderate renal dysfunction, which might contribute to inefficient urinary glucose excretion and a smaller reduction in HbA1c. This was confirmed in the present study because the reduction in HbA1c was smaller in patients with moderate RI than in patients with mild RI. This is consistent with the results of an earlier study in which ipragliflozin‐induced glycosuria declined with decreasing eGFR 17. The study by Ferrannini et al. 17 also showed that there was no appreciable difference in glucose excretion between Japanese patients with mild RI or those who had normal kidney functions.
Although the blood glucose‐lowering effects of ipragliflozin were influenced by RI, the reduction in body weight from baseline to week 24 was consistently greater in the ipragliflozin group than in the placebo group, with adjusted mean differences of −1.61 kg in patients with mild RI and −1.92 kg in patients with moderate RI. If urinary glucose excretion and urinary excretion of energy decrease with increasing RI severity, we would expect a smaller reduction in body weight during treatment with ipragliflozin in patients with moderate RI compared with patients with mild RI; however, this was not the case. In fact, the mean reduction in body weight was slightly greater in patients with moderate RI than in patients with mild RI in the present study. Although the reason for which reduced renal function did not influence the reduction in body weight during treatment with ipragliflozin is not clear, similar findings were also reported for canagliflozin 15 and dapagliflozin 16. It must be acknowledged that the present study involved relatively small numbers of patients with moderate RI; therefore, further studies are needed to determine the potential underlying mechanisms.
The safety profile of ipragliflozin in the present study was generally similar to that in other studies 7, 12, 14, 18. The most common TEAEs in the present study, including nasopharyngitis and polyuria/pollakiuria, were also found in other studies, and the incidence of these events was not increased in patients with mild or moderate RI. Furthermore, the incidence rates of TEAEs of special interest, including hypoglycaemia, genital infections and urinary tract infections, were very low in the ipragliflozin group and were not affected by RI. Although the incidence of hypoglycaemia was lower in the ipragliflozin group, the incidence of adverse events related to hypoglycaemia may increase when ipragliflozin is used in combination with a sulfonylurea; therefore, ipragliflozin should be administered carefully, with consideration for the risk of hypoglycaemia when administered concomitantly with a sulfonylurea.
Treatment with ipragliflozin was also associated with a reduction in blood pressure at week 24, which was maintained at week 52. Although the change was small, it may be clinically relevant in patients with renal dysfunction.
In the ipragliflozin group, eGFR showed a transient reduction at week 2, irrespective of RI severity, but recovered to baseline levels by week 24. Meanwhile, cystatin C levels increased slightly in the ipragliflozin group compared with placebo, but no significant changes from baseline in urinary N‐acetyl‐β‐d‐glucosaminidase levels occurred in either group. Renal function, therefore, was not appreciably affected by ipragliflozin in these patients. Urinary volume was reported to increase slightly during treatment with SGLT2 inhibitors 19, 20, probably because of the osmotic potential of glucose in urine. This increase in urine volume is associated with osmotic diuresis and a mild decrease in body fluid, reflecting an increase in haematocrit and causing a transient reduction in eGFR; however, we found slight increases in the level of urine β2‐microglobulin, which is normally freely filtered at the glomerulus and then reabsorbed by renal tubules. The serum and urinary phosphate and magnesium levels were higher in the ipragliflozin group than in the placebo group. The severity of RI did not obviously affect the levels of serum or urinary electrolytes. The mechanisms underlying the increased serum levels of these electrolytes are unclear, but increases in these urinary electrolytes might be attributable to slight increases in their serum levels or altered fluid handling. Similar results have been reported for other SGLT2 inhibitors 19, 21, 22.
Some limitations of the present study should be noted, including the relatively small number of patients enrolled in each treatment group and the short duration of treatment (1 year).
In conclusion, ipragliflozin improved glycaemic control and reduced body weight in Japanese patients with T2DM with mild to moderate RI, and its blood glucose‐lowering effects were positively correlated with renal function. There were no clinically significant safety concerns in patients with RI and the safety profiles were similar in patients with mild or moderate RI. Taken together, these results confirm that ipragliflozin is a valid treatment option for patients with T2DM with normal renal function or mild RI, but not for patients with T2DM with moderate RI.
Conflict of Interest
Ipragliflozin (ASP1941) was developed by Astellas Pharma Inc. and Kotobuki Pharmaceutical Co., Ltd. A. K. is a consultant for and has received consulting fees/honoraria from Astellas Pharma Inc. The remaining authors are employees of Astellas Pharma Inc., Tokyo, Japan.
A. K., S. Y. and A. U. contributed to study design, data analysis and writing of the manuscript; H. T. contributed to study conduct, data collection and analysis and writing of the manuscript; H. I. and K. K. contributed to study design, study conduct, data collection and analysis and writing of the manuscript; E. U. contributed to data analysis and writing of the manuscript. All authors read and approved the final draft of the manuscript.
Supporting information
File S1. Exclusion criteria.
File S2. Sample size calculation, analysis populations and statistical methods.
Table S1. Changes in efficacy outcomes from baseline to week 24 (with last observation carried forward).
Table S2. Safety profile (safety analysis set) for all patients treated with ipragliflozin in treatment periods 1 and 2.
Table S3. Changes in laboratory parameters and blood pressure from baseline to the ends of treatment periods 1 or 2 (with last observation carried forward).
Figure S1. Study design.
Figure S2. Time‐course of changes in FPG (A) and body weight (B) from baseline to each visit in the ipragliflozin and placebo groups.
Figure S3. Change in HbA1c from baseline to the end of treatment period 1 according to eGFR at baseline.
Figure S4. Time‐course of changes in FPG from baseline to each visit in the ipragliflozin and placebo groups in patients grouped by the severity of RI.
Figure S5. HbA1c (A), FPG (B) and body weight (C) measured at each visit during treatment periods 1 (weeks 0–24) and 2 (weeks 24–52) in patients assigned to ipragliflozin in treatment period 1.
Figure S6. HbA1c (A), FPG (B), and time‐course of changes in body weight (C) measured at each visit during treatment periods 1 (weeks 0–24) and 2 (weeks 24–52) in patients assigned to ipragliflozin in treatment period 1 according to the severity of renal dysfunction.
Acknowledgements
The authors thank Nicholas D. Smith, PhD and ELMCOM™ for providing medical writing/editorial assistance for this work, which was supported by Astellas Pharma Inc.
References
- 1. Wright EM. Renal Na(+)‐glucose cotransporters. Am J Physiol Renal Physiol 2001; 280: F10–F18. [DOI] [PubMed] [Google Scholar]
- 2. Wright EM, Hirayama BA, Loo DF. Active sugar transport in health and disease. J Intern Med 2007; 261: 32–43. [DOI] [PubMed] [Google Scholar]
- 3. Bakris GL, Fonseca VA, Sharma K, Wright EM. Renal sodium‐glucose transport: role in diabetes mellitus and potential clinical implications. Kidney Int 2009; 75: 1272–1277. [DOI] [PubMed] [Google Scholar]
- 4. Krook A, Kawano Y, Song XM et al. Improved glucose tolerance restores insulin‐stimulated Akt kinase activity and glucose transport in skeletal muscle from diabetic Goto‐Kakizaki rats. Diabetes 1997; 46: 2110–2114. [DOI] [PubMed] [Google Scholar]
- 5. Tahara A, Kurosaki E, Yokono M et al. Antidiabetic effects of SGLT2‐selective inhibitor ipragliflozin in streptozotocin‐nicotinamide‐induced mildly diabetic mice. J Pharmacol Sci 2012; 120: 36–44. [DOI] [PubMed] [Google Scholar]
- 6. Tahara A, Kurosaki E, Yokono M et al. Pharmacological profile of ipragliflozin (ASP1941), a novel selective SGLT2 inhibitor, in vitro and in vivo. Naunyn Schmiedebergs Arch Pharmacol 2012; 385: 423–436. [DOI] [PubMed] [Google Scholar]
- 7. Kashiwagi A, Kazuta K, Yoshida S, Nagase I. Randomized, placebo‐controlled, double‐blind glycemic control trial of novel SGLT2 inhibitor ipragliflozin in Japanese patients with type 2 diabetes mellitus. J Diabetes Investig 2013; 5: 382–391. [DOI] [PMC free article] [PubMed] [Google Scholar]
- 8. Fonseca VA, Ferrannini E, Wilding JP et al. Active‐ and placebo‐controlled dose‐finding study to assess the efficacy, safety, and tolerability of multiple doses of ipragliflozin in patients with type 2 diabetes mellitus. J Diabetes Complications 2013; 27: 268–273. [DOI] [PubMed] [Google Scholar]
- 9. Wilding JP, Ferrannini E, Fonseca VA, Wilpshaar W, Dhanjal P, Houzer A. Efficacy and safety of ipragliflozin in patients with type 2 diabetes inadequately controlled on metformin: a dose‐finding study. Diabetes Obes Metab 2013; 15: 403–409. [DOI] [PubMed] [Google Scholar]
- 10. Kashiwagi A, Kasuga M, Araki E et al. International clinical harmonization of glycated hemoglobin in Japan: From Japan Diabetes Society to National Glycohemoglobin Standardization Program values. Diabetol Int 2012; 3: 8–10. [DOI] [PMC free article] [PubMed] [Google Scholar]
- 11. Matsuo S, Imai E, Horio M et al. Revised equations for estimated GFR from serum creatinine in Japan. Am J Kidney Dis 2009; 53: 982–992. [DOI] [PubMed] [Google Scholar]
- 12. Kashiwagi A, Akiyama N, Shiga T et al. Efficacy and safety of ipragliflozin as an add‐on to a sulfonylurea in Japanese patients with inadequately controlled type 2 diabetes: results of the randomized, placebo‐controlled, double‐blind, phase III EMIT study. Diabetol Int 2014; DOI: 10.1007/s13340‐014‐0184‐9. [Google Scholar]
- 13. Kashiwagi A, Kazuta K, Goto K, Yoshida S, Ueyama E, Utsuno A. Ipragliflozin in combination with metformin for the treatment of Japanese patients with type 2 diabetes: ILLUMINATE, a randomised, double‐blind, placebo‐controlled study. Diabetes Obes Metab 2014; DOI: 10.1111/dom.12331. [DOI] [PMC free article] [PubMed] [Google Scholar]
- 14. Kashiwagi A, Akiyama N, Shiga T, Yoshida S, Ueyama E, Utsuno A. Efficacy and safety of ipragliflozin as an add‐on to pioglitazone in Japanese patients with inadequately controlled type 2 diabetes: a randomized, double‐blind, placebo‐controlled study (The SPOTLIGHT study). Diabetol Int 2014; DOI: 10.1007/s13340-014-0182-y. [Google Scholar]
- 15. Yale JF, Bakris G, Cariou B et al. Efficacy and safety of canagliflozin in subjects with type 2 diabetes and chronic kidney disease. Diabetes Obes Metab 2013; 15: 463–473. [DOI] [PMC free article] [PubMed] [Google Scholar]
- 16. Kohan DE, Fioretto P, Tang W, List JF. Long‐term study of patients with type 2 diabetes and moderate renal impairment shows that dapagliflozin reduces weight and blood pressure but does not improve glycemic control. Kidney Int 2013; 85: 962–971. [DOI] [PMC free article] [PubMed] [Google Scholar]
- 17. Ferrannini E, Veltkamp SA, Smulders RA, Kadokura T. Renal glucose handling: Impact of chronic kidney disease and sodium‐glucose cotransporter 2 inhibition in patients with type 2 diabetes. Diabetes Care 2013; 36: 1260–1265. [DOI] [PMC free article] [PubMed] [Google Scholar]
- 18. Kashiwagi A, Kazuta K, Takinami Y, Yoshida S, Utsuno A, Nagase I. Ipragliflozin improves glycemic control in Japanese patients with type 2 diabetes mellitus: the BRIGHTEN study. Diabetology Int 2014; DOI: 10.1007/s13340-014-0164-0. [Google Scholar]
- 19. List JF, Woo V, Morales E, Tang W, Fiedorek FT. Sodium‐glucose cotransport inhibition with dapagliflozin in type 2 diabetes. Diabetes Care 2009; 32: 650–657. [DOI] [PMC free article] [PubMed] [Google Scholar]
- 20. Kadokura T, Akiyama N, Kashiwagi A et al. Pharmacokinetic and pharmacodynamic study of ipragliflozin in Japanese patients with type 2 diabetes mellitus: A randomized, double‐blind, placebo‐controlled study. Diabetes Res Clin Pract 2014; 106: 50–56. [DOI] [PubMed] [Google Scholar]
- 21. Ljunggren Ö, Bolinder J, Johansson L et al. Dapagliflozin has no effect on markers of bone formation and resorption or bone mineral density in patients with inadequately controlled type 2 diabetes mellitus on metformin. Diabetes Obes Metab 2012; 14: 990–999. [DOI] [PubMed] [Google Scholar]
- 22. Rosenstock J, Aggarwal N, Polidori D et al. Dose‐ranging effects of canagliflozin, a sodium‐glucose cotransporter 2 inhibitor, as add‐on to metformin in subjects with type 2 diabetes. Diabetes Care 2012; 35: 1232–1238. [DOI] [PMC free article] [PubMed] [Google Scholar]
Associated Data
This section collects any data citations, data availability statements, or supplementary materials included in this article.
Supplementary Materials
File S1. Exclusion criteria.
File S2. Sample size calculation, analysis populations and statistical methods.
Table S1. Changes in efficacy outcomes from baseline to week 24 (with last observation carried forward).
Table S2. Safety profile (safety analysis set) for all patients treated with ipragliflozin in treatment periods 1 and 2.
Table S3. Changes in laboratory parameters and blood pressure from baseline to the ends of treatment periods 1 or 2 (with last observation carried forward).
Figure S1. Study design.
Figure S2. Time‐course of changes in FPG (A) and body weight (B) from baseline to each visit in the ipragliflozin and placebo groups.
Figure S3. Change in HbA1c from baseline to the end of treatment period 1 according to eGFR at baseline.
Figure S4. Time‐course of changes in FPG from baseline to each visit in the ipragliflozin and placebo groups in patients grouped by the severity of RI.
Figure S5. HbA1c (A), FPG (B) and body weight (C) measured at each visit during treatment periods 1 (weeks 0–24) and 2 (weeks 24–52) in patients assigned to ipragliflozin in treatment period 1.
Figure S6. HbA1c (A), FPG (B), and time‐course of changes in body weight (C) measured at each visit during treatment periods 1 (weeks 0–24) and 2 (weeks 24–52) in patients assigned to ipragliflozin in treatment period 1 according to the severity of renal dysfunction.