

Abstract
A majority of cellular functions are carried out by macromolecular complexes. A host of biochemical and spectroscopic methods exists to characterize especially protein/protein complexes, however there has been a lack of a universal method to determine protein stoichiometries. Peptide‐based MS, especially as a complementary method to the MS analysis of intact protein complexes, has now been developed to a point where it can be employed to assay protein stoichiometries in a routine manner. While the experimental demands are still significant, peptide‐based MS has been successfully applied to analyze stoichiometries for a variety of protein complexes from very different biological backgrounds. In this review, we discuss the requirements especially for targeted MS acquisition strategies to be used in this context, with a special focus on the interconnected experimental aspects of sample preparation, protein digestion, and peptide stability. In addition, different strategies for the introduction of quantitative peptide standards and their suitability for different scenarios are compared.
Keywords: Mass spectrometry, Protein complex, SRM, Stoichiometry, Technology
Abbreviations
- AQUA
absolute quantification of proteins
- EtEP
equimolarity through equalizer peptide
- iBAQ
intensity‐based absolute quantification
- QconCAT
quantification concatamer
1. Characteristics of macromolecular protein complexes: Composition, stoichiometry/copy number, topology and dynamics
In the crowded environment of the cell, proteins are permanently engaged in interactions with other biomolecules such as other proteins, DNA, RNA, or lipids. Cellular function can rarely be attributed to isolated molecules; instead, it is most often affected by functional modules. These complexes range in size and complexity from simple homodimeric enzymes up to complex macromolecular machines such as the ribosome. Macromolecular complexes can be investigated at different levels (Fig. 1): (A) composition, (B) stoichiometry, (C) copy number, (D) topology, and (E) dynamics.
Figure 1.
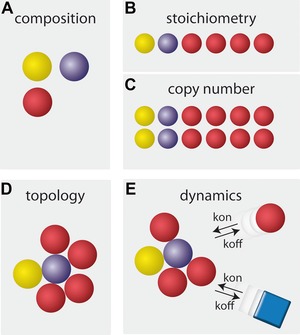
Different layers of macromolecular complex characteristics. Complex composition (A) encompasses the list of complex constituents. Complex stoichiometry (B) defines the abundance of constituents relative to each other, while the copy number (C) quantifies the absolute number of constituents per complex. Complex topology (D) describes the spatial setup of the constituents in the complex. Complex dynamics (E) represent the alterations in composition, stoichiometry, and topology over time.
Qualitatively, complexes involving proteins can be characterized by (A) their composition, that is the qualitative identification of their constituents. Compositions of protein complexes are most frequently determined through a combination of affinity‐based purification, using a binding partner of interest (bait), and shotgun MS analysis of interaction partners. Pioneer work on large‐scale studies of protein–protein interactions, for example in yeast 1, 2, has revealed extensive interaction networks, indicating that the majority of cellular functions are indeed affected through macromolecular complexes 3.
The complex's second qualitative property is its topology (D), that is the shape and relative spatial arrangement of its constituents (Fig. 1D). Traditionally, topology is studied by methods that directly provide spatial information, such as NMR 4, X‐ray crystallography 5, electron cryomicroscopy 6 or electron tomography 7. More recently, MS‐based methods such as MS of intact protein complexes, protein–protein cross‐linking, radical footprinting, or H/D exchange MS have substantially contributed to our knowledge of protein complex topology (reviewed in 8, 9, 10).
In contrast to these qualitative properties, the relative stoichiometry (Fig. 1B), that is the ratio of the complex's constituents, and the closely related absolute number (C) of constituent copies, both require analysis at a quantitative level. Information about copy numbers (Fig. 1C) of the various components in a complex supersedes the information about relative stoichiometry, which is plainly illustrated by the case of urease from Helicobacter pylori. Urease is composed of α and β subunits, which form a dodecameric suprastructure (α β)12 11. Methods that aim to determine the stoichiometry will show a 1:1 relative stoichiometry, but this ignores the oligomeric nature of the complex. To obtain information on copy numbers in a complex, additional complementary information about its topology (Fig. 1D), molecular weight, or geometric size has to be available.
Finally, complex dynamics (Fig. 1E) describe changes of the above properties (A–D) over time; these can often be attributed to cellular function. Such changes depend on the expression levels, the compartmentation, and (post‐translational) modifications of its components, all of which may vary during growth, during the cell cycle, or in response to extracellular stimuli. As an example, Ori et al. used targeted peptide‐based MS to show that the stoichiometry of proteins in the human nuclear pore complex displays significant variation between different cancer‐associated cell lines, indicating that even quantitative complex properties are adjustable for function 12.
To the best of our knowledge, MS is the only technology that can contribute to the investigation of protein(–ligand) complexes at all these levels. This review focuses on the less frequently described MS‐based approaches for the analysis of protein complex stoichiometry and of copy numbers in isolated complexes, namely the so‐called “bottom up” approach in which the stoichiometry of protein complexes is investigated at the peptide level after enzymatic digestion. The merits and challenges of the peptide‐based approach will be discussed against the backdrop of alternative methods.
2. General remarks concerning the purification and study of intact protein complexes
In most cases, the stoichiometries of complexes assembled in vivo are studied in vitro (or ex vivo). Apart from mass spectrometric approaches, a variety of methods have been established to study stoichiometry (Table 1) 4, 5, 6, 7, 13, 14, 15, 16, 17, 18, 19, 20, 21, 22, 23, 24, 25. Apart from their different requirements—such as complex purity, stability, availability, etc.—these methods often provide additional information on topology, binding affinities, etc. Thus, complex stoichiometry is often part of an information package that can be gained by a particular method.
Table 1.
Classical methods for stoichiometry determination
| Class of method | Method | Source of complex | References |
|---|---|---|---|
| Biophysical methods | Isothermal titration calorimetry (ITC) | In vitro | Feig 13 |
| Static and dynamic light‐scattering (SEC‐MALS) | Ex vivo/in vitro | Some 14 | |
| Surface plasmon resonance (SPR) | In vitro | Day et al. 15 | |
| Analytical ultracentrifugation | Ex vivo/in vitro | Padrick and Brautigam 16 | |
| Single‐molecule fluorescence correlation spectroscopy (FCS) | In vivo/ex vivo/in vitro | Bulseco and Wolf 23 | |
| Single‐molecule fluorescence intensity distribution analysis (FIDA), fluorescence fluctuation spectroscopy (FFS) | In vivo/ex vivo/in vitro | Saffarian et al. 17 | |
| Single‐molecule TIRF bleaching | In vivo/ex vivo/in vitro | Nakajo et al. 18 | |
| Biochemical methods | Native gel electrophoresis + densitometry | Ex vivo/in vitro | Wittig et al. 19 |
| Radiometric quantification | Ex vivo/in vitro | Mogridge et al. 24 | |
| Size‐exclusion chromatography (SEC) | Ex vivo/in vitro | Winzor et al. 25 | |
| Western blot | Ex vivo/in vitro | Diaconu et al. 20 | |
| Structural methods | NMR | Ex vivo/in vitro | Cavanagh et al. 4 |
| X‐ray crystallography | Ex vivo/in vitro | McPherson 5 | |
| Cryo electron microscopy | Ex vivo/in vitro | Orlova and Saibil 6 | |
| Atomic force microscopy (AFM) | Ex vivo/in vitro | Barrera et al. 21 | |
| Scanning transmission electron microscopy (STEM) | Ex vivo/in vitro | Müller et al. 22 |
The quantitative nature of a stoichiometry puts high demands on the preservation of the complex's structural and functional integrity upon cell lysis and during subsequent purification. If complex integrity is not ensured and confirmed, values for the stoichiometries determined cannot be regarded as robust.
When protein complexes are purified, their thermodynamic stability (which was essential for their assembly in vivo) becomes less relevant than their kinetic inertness. The protocols used for cell lysis and purification often embody huge changes to the physiological milieu under which the complex was formed with regard to solvents, pH, ionic strength, and temperature. In addition, most purification protocols include dilution steps, which shift all complex‐binding equilibria toward the free components. Under these nonequilibrium conditions, complexes will start to dissociate, and their integrity depends on their dissociation rates, the duration of the purification, and the experimental conditions, for example temperature. Usually, a compromise has to be made between the complexes’ purity and the preservation of its stoichiometry. Consequently, the requirements for purification procedures for stoichiometry studies differ from those for interactome studies (as reviewed in 26) and should be “fast, cold, and concentrated” 27, 28. For this reason, the purification procedure has to be adapted to each individual target complex and its kinetic properties. Classical multistep purification procedures (centrifugation, etc.) are fast enough for stable nanomachines (e.g. the ribosome 29) to retain their integrity. However, more transient complexes require faster purification strategies, and for these a large repertoire of antibody‐ or tag‐based affinity purification procedures has been established 30.
Isolation of complexes should go hand in hand with the investigation of their preservation and functional integrity. Besides biochemical methods, MS‐based approaches have been developed to distinguish between stable and dynamic components. Isotope‐labeled preparations with tagged bait protein are mixed with differently labeled nontagged preparations. After purification and digestion, only dynamic—that is exchangeable—components exhibit mixed labeling and can thus be differentiated from stable components 31, 32, 33. Highly dynamic complexes, which undergo full equilibration of their subunits in the time window of purification, can also be studied in a time‐resolved fashion (tc‐PAM SILAC or MAP (mixing after purification)‐SILAC).
When complexes are known to be transient, different approaches can be envisaged for their stabilization. The physicochemical environment can be optimized by high‐throughput screens for complex preservation 34. Functional complexes can be trapped by specific inhibitors, for example the kirromycin‐stalled EF‐Tu–tRNA–ribosome complex 35, or complex assembly can be stopped by deletion of essential assembly factors (reviewed in 36). In addition, cross‐linking can be used to “freeze” assembled protein complexes for further analysis 37.
3. Determination of complex stoichiometry by applying MS of intact protein complexes
In general, MS can be applied to the study of protein complexes in two ways: either entire intact macromolecular assemblies are analyzed, hereafter termed “MS of intact complexes,” or complex properties such as stoichiometry are investigated on the peptide level after enzymatic digestion, hereafter termed “peptide‐based stoichiometry determination” (see below). These MS methods, which are otherwise highly orthogonal, each overcome a variety of limitations of non‐MS approaches. Both require relatively small amounts of complex (pmol or less), and both allow the study of very large macromolecular assemblies where protein stoichiometries/copy numbers and topology cannot easily be investigated by classical structure‐resolving methods such as NMR or X‐ray crystallography. In addition, neither method is hampered by dynamic regions of the complex's components, such as flexible termini of proteins or completely unstructured proteins, which impede topology determination by, for example, cryo EM or X‐ray crystallography. Notably, when applied to the same macromolecular complex (e.g. the prokaryotic 70S ribosome), both MS methods lead to stoichiometries that are in good agreement with non‐MS‐based methods 38, 39.
MS of intact protein complexes is often considered the gold standard for the investigation of complex structures. It allows the accurate measurement of the intact masses of a complex or its subunits. If the protein composition is known, then stoichiometry and copy number can be deduced directly from this combined information.
Studying intact macromolecular complexes by MS was made possible by the finding that “soft” ionization methods such as ESI 40 or MALDI do not necessarily disrupt noncovalent interactions when performed under controlled conditions. Of the two, MALDI is the more tolerant to higher salt concentrations and produces spectra that are easier to interpret owing to the formation of largely singly charged quasi‐molecular ions 37. However, MALDI suffers from some limitations, because the incorporation of a protein complex into the solid MALDI matrix can disrupt noncovalent interactions. In addition, nonspecific protein/protein adducts are often formed, either during matrix crystallization or in the plume directly after laser irradiation. While these limitations can be circumvented by chemical cross‐linking of proteins in a complex 37, they have still prevented widespread use of this approach. ESI on the other hand is the milder ionization method of the two and nowadays dominates the field of MS of protein(–ligand) complexes 41, 42. Successful transfer of intact complexes to the gas phase in ESI‐MS depends on the nature of their interactions: Electrostatic interactions and hydrogen bonds will be strengthened upon evaporation of the solvent, while hydrophobic interactions are loosened 43. Because basic residues are often involved in protein–protein interaction 44, and because the addition of a protein to a complex leads to a greater relative increase in the complex's molecular weight than in its surface area, only a relatively small percentage of the basic residues present in intact protein complexes is exposed at the complex's surface. The result is a relatively low net charge and hence high m/z values compared with, for example, single proteins under denaturing conditions. This necessitates the use of mass analyzers with a wide m/z range (up to 30 000) and relatively high mass resolution. Consequently, orthogonal TOF mass analyzers have become a standard platform for native MS. Recent improvements in the technology of Orbitrap mass analyzers have made these suitable as well 45, 46. Besides the choice of mass analyzer, optimization of the ESI‐MS interface and ion‐transfer regions is also necessary for the successful analysis of noncovalent macromolecular complexes. Of especial value is the use of increased pressure in the ESI–MS interface region to improve intact transmission of the complexes in the gas phase by collisional cooling and focusing 47, 48, 49.
Information about complex stoichiometry is derived from intact protein MS by combining (i) measurements of the absolute mass of the intact complex, (ii) determinations of its composition, usually after tryptic digestion, and (iii) measurement of the masses of the individual subunits (reviewed in 50). The intact mass is measured under nondenaturing conditions by using an ESI‐compatible volatile buffer system (Fig. 2). The zero–charge mass of the native complex is obtained from the resulting charge state series by deconvolution. In the case of heterologous proteins, the masses of the subunits can often be derived from databases. However, protein degradation or truncations of heterologous proteins can hamper the mass assignment. For in vivo assembled complexes, a significant degree of PTM or N‐terminal processing can further impede an unambiguous subunit assignment. Here, denaturation of the complexes and subsequent ESI‐MS analysis allow the subunit assignment to be made in a single step (Fig. 2). Additionally, complexes can be partially disassembled in the gas phase by MS/MS using CID. Collisions with gas molecules first lead to dissociation of water or counterions, followed by structural distortions of the protein assembly, and finally to unfolding and ejection of single peripheral subunits from the macromolecular assembly (reviewed in 51, 52). The CID pathway is usually asymmetric and yields highly charged monomers and a stripped complex of lower charge. Different dissociation pathways operating in parallel can lead to the formation of different stripped complexes in the same experiment. For complexes with few subunits or high symmetry, the determination of the stoichiometry is straightforward. In the case of highly complex dissociation patterns, an ion mobility separation stage in the mass spectrometer (IM‐MS) can help to simplify correct assignment of charge state series by separating complexes and complex subunits according to their collisional cross‐sections (reviewed in 53). Improved software algorithms for the deconvolution and interpretation of native ESI mass spectra of complexes have further extended the range of applications, making possible the analysis of the stoichiometry and topology of eight subunits in the 29‐subunit assembly of the rotary ATP synthase from Enterococcus hirae 54.
Figure 2.
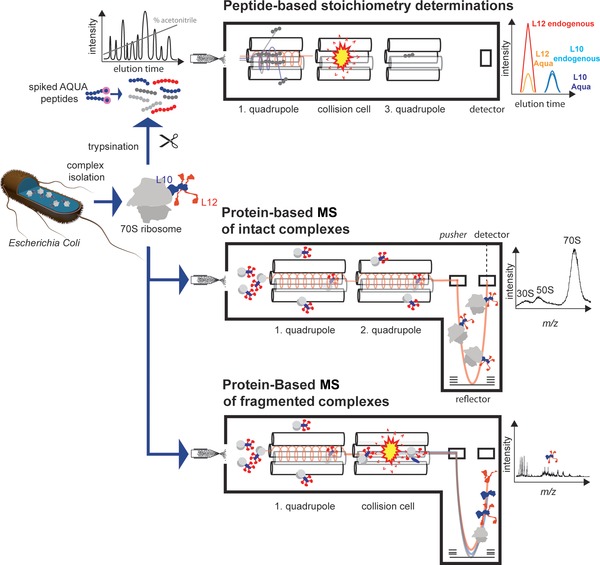
Workflows for MS‐based stoichiometry determination. In the case of the peptide‐based methods, the isolated ribosomes are proteolyzed. Isotopolog proxy peptides that are used for normalization of the endogenous peptides coelute when separated by RP chromatography. Endogenous and AQUA peptide are sprayed into a triple quadrupole mass spectrometer. The first quadrupole filters peptides having the correct m/z ratio while blocking all other peptides. Peptides that passed the first quadrupole are fragmented in the collision cell. Fragments of the desired m/z ratio are selected in the third quadrupole. Since triple quadrupole mass spectrometers can rapidly vary the settings of both quadrupoles (transitions), fragments of the AQUA peptide and the endogenous peptide coelute and can be quantified relatively to each other. From these ratios, the complex stoichiometry can be readily deduced. For protein‐based MS, isolated ribosomes are sprayed into a modified high‐mass quadrupole TOF (QTOF) spectrometer 48. In a first step, the intact mass of the ribosomes is determined. Then, ribosomes are dissociated in the collision cell and different ribosomal stalk complexes are formed. Knowing the overall mass and the mass of different ribosomal subcomplexes, the L12:L10 stoichiometry can be extracted.
In addition to the determination of protein stoichiometries and protein copy numbers, MS of intact protein complexes can assist in the deduction of complex topologies including assessing direct interactions between complex subunits 55, 56, 57, can measure ligand binding affinities 58 or enzymatic turnover rates 40 and even the polydipersity, that is the different oligomeric states of a protein complex in the sample 59, and has been used to study protein folding 60. Nonetheless, the analysis of complex stoichiometry by MS at the level of intact proteins comes with some limitations: (i) The complex under investigation must be stable in buffer systems that are compatible with ESI, for example ammonium acetate solutions at pH values within its buffer ranges 61. (ii) Complexes need to be highly purified to avoid ion suppression or signal overlay by other analytes in the sample, and (iii) they need to be highly concentrated (in the micromolar range) in order to force the binding equilibrium toward the intact complex. (iv) In addition, strong ion currents for the complexes’ quasimolecular ions are required because of the distribution of the signal onto multiple charge states, the reduced transmission of MS ion optics at higher m/z, and the inherently lower sensitivity of MCP detectors typically used in TOF‐MS instruments for higher mass analytes. Finally, (v) the interface regions of commercially available mass spectrometers are usually not suited for efficient cooling and focusing of noncovalently bound assemblies, and they require modification of, for example, the pressure regime (see above). Consequently, the mass spectrometers used for this type of analyses are still, with the exception of a recently introduced Orbitrap instrument 45, heavily modified at the hardware level 48, 62, which has hampered a wider adoption of this approach in the field yet.
4. Determination of complex stoichiometry by application of peptide‐based MS
Peptide‐based MS used for investigation of protein stoichiometries is inherently more sensitive; it does not require high sample purity and allows the measurement of several experimental values per protein, leading to high statistical confidence. It is generally compatible with front–end separation devices hyphenated to the ESI mass spectrometer, allowing the analysis of complex constituents even in the presence of an excess of other biomolecules. While this makes peptide‐based MS much more closely compatible with the analysis of complexes isolated and purified from in vivo samples, it is important to note that it has its own drawbacks, limitations and pitfalls, which will be discussed later in this review.
Peptide‐based stoichiometry determinations rely on the measurement of the constituent proteins’ concentrations in a complex, rather than on the measurement of its mass. These are obtained by quantification of representative sets of peptides (proxy peptides) for all subunits after enzymatic proteolysis. Complex stoichiometries are derived from the integrated MS signal intensities of these proxy peptides, rather than from molecular weight differences (as for intact complex MS analysis). Importantly, MS signal intensities of peptides strongly depend on their physicochemical properties and, in consequence, on their ionization efficiencies. This makes a direct, precise quantification impossible and necessitates the use of quantified standards for external or internal calibration, for example by spiking with isotopically labeled reference peptides of the same sequence at known concentrations in the so‐called absolute quantification of proteins (AQUA) approach 63. Since the endogenous peptides and isotopically labeled reference peptides have the same properties, their intensities are directly comparable. The use of reference proxy peptides that resemble the endogenous peptides necessitates the a priori determination of the protein composition, either by survey LC‐MS/MS analysis or by available database entries. The important aspects of how reference peptides are chosen and can be generated are discussed in a later section of this review.
The MS intensities between reference peptides and endogenous peptides can be measured by various means. The gold standard is clearly SRM performed on triple quadrupole instruments (Fig. 2). Briefly, a single SRM experiment—or SRM transition—employs two‐stage quadrupole filtering for determining the m/z of the intact peptide precursor before CID, and for determining the m/z of a selected fragment ion after CID, in a quadrupole collision cell. Fragments reaching the detector are recorded over time. To make the protein quantification more robust toward confounding factors—such as integration errors caused by coeluting contaminants or problems with the quantification and handling of individual reference peptides—usually three to four transitions, corresponding to three to four fragments, are monitored per peptide, and two to three peptides per protein. The corresponding transitions are measured in a sequential manner in each experimental cycle. Quantification is achieved by comparing the peak areas recorded for the transitions of endogenous and the reference peptides. Because the reference peptides were spiked into the samples in known amounts, the integrated signal for the peptides can readily be normalized to yield peptide and thus protein concentrations. From the ratio of protein concentrations, the complex stoichiometries can easily be determined. Using this peptide‐based quantification, the stoichiometries of very different complexes from different organisms using different sources of reference peptides have been quantified (Table 2) 38, 64, 65, 66, 67, 68, 69, 70, 71, 72, 73, 74, 75, 76, 77, 78.
Table 2.
Complex stoichiometries determined by peptide‐based MS
| Complex | Organism | Composition (stoichiometry) | Purification | Reference peptide | References |
|---|---|---|---|---|---|
| hPrp19/CDc5L spliceosomal complex | Human | Prp19:CD5L/SPF27/PRL1/CTNBL1 (4:2:1:1:1) | Immunoadsorption | AQUA | Schmidt et al. 64 |
| Cullin‐ring Ubiquitin ligase | Human | >10 Subunits (diverse) | Immunoprecipitation | AQUA | Bennett et al. 65 |
| Ribosomal stalk | E. coli A. platensis | L10/L12 (1:4 and 1:8) | Sucrose gradients | AQUA | Davydov et al. 38 |
| Protein phosphatase 2A network | Human | 8 Subunits (1:1 to 1:20) | Affinity purification (SH‐quant) tag | AQUA | Wepf et al. 66 |
| CD95 death‐inducing signaling | Human | FADD/procaspase‐8/c‐FLIP/procaspase‐10 (1:2:0.1:0.3) | Immunoprecipitation | AQUA | Warnken et al. 67 |
| Adenovirus | Human | >10 Subunits (diverse) | Cesium gradients | AQUA | Benevento et al. 68 |
| Proteasome | S. cerevisiae | Rpn10/Rpt1/Rpn13 (2:2:1) | Immunopurification | AQUA | Berko et al. 69 |
| U1 snRNP | Human | U1–70K/U1‐C/U1A/SmB/SmD1/SmD2/SmD3/SmE/SmF/SmG (1:1:1:1:1:1:1:1:1:1) | Immunopurification + chromatography | ICPL | Hochleitner et al. 70 |
| Cohesin core complex | Human | SMC1/SMC3/RAD21/SA1/2 (1:1:1:1) | Immunoadsorption | EtEP | Holzmann et al. 71 |
| MP1/p14 complex | Murine (expressed in E. coli) | MP1/p14 (1:1) | Affinity purification (His tag) | EtEP | Holzmann et al. 72 |
| Cohesin core complex | Human | >10 Subunits (diverse) | Immunoprecipitation | qConCAT | Ding et al. 73 |
| ClpP/R protease complex | A. thaliana | Clp3/4/5/6 (1:2:3:1) Clp1/ClpR1/2/3/4 (3:1:1:1:1) | Affinity purification | qConCAT | Olinares et al. 74 |
| Transducin complex | Bovine (expressed in E. coli) | GABα/β/γ (1:1:1) | Affinity purification (His tag) | qConCAT | Nanavati et al. 75 |
| Ribosome | E. coli | >10 Subunits (diverse) | Sucrose gradients | qConCAT | Al‐Majdoub et al. 76 |
| eIF2B‐eIF2 | S. cerevisiae | eIF2B(αβγδε)/eIF2(αβγ) (1:1:1:1:1)/(0.3:0.3:0.3) | Tandem affinity purification | PCS | Kito et al. 77 |
| V1‐ATPase | S. cerevisiae | A/B/DE/FG/H (3:3:3:3:1) | Immunopurification + SEC | 15N in vivo labeling | Kitagawa et al. 78 |
An alternative to the SRM approach is to use integrated extracted ion chromatograms generated from data‐dependent acquisition LC‐MS/MS experiments, as exemplified by the intensity‐based absolute quantification (iBAQ) approach that we discuss later. While these are readily available from protein identification experiments without further optimization, quantitation from extracted ion chromatograms often suffers from the intrinsically higher background in the MS domain and inconsistent numbers of data points generated across chromatography peaks, resulting in increased variation of quantitation values.
An intrinsic (i.e. mass‐spectrometric) limitation of the peptide‐based MS approach is encountered in the determination of high stoichiometric ratios (>10:1). As the SD of the concentration measurements is usually in the range of 10%, above a ratio of 1:10 biologically meaningful but inaccurate stoichiometries might be found within the SD 38. Intriguingly, most of the stoichiometries determined by MS so far show low ratios or even equimolarity of the constituents (Table 2). Another limitation of the peptide‐based approach arises when heterogeneous populations are investigated. Proteolysis of heterogeneous complex preparations results in the measurement of averaged stoichiometries, obscuring the intrinsic stoichiometries of the single complexes. In contrast to native MS, which is able to deconvolute and even to resolve the dynamics of different coexisting complex populations 79, 80, this information is lost upon proteolysis. Consequently, great care should be taken to assay and monitor the purity and integrity of the complex where possible, and to differentiate between stable and dynamic constituents (see above). However, the presence of heterogeneous complex populations in a sample is never beneficial in an investigation of complexes using any of the approaches discussed.
Peptide‐based methods compensate for the above‐mentioned restrictions by being far more tolerant than MS of intact protein complexes toward different buffer compositions or sample impurities. For sample preparation, all buffers, salts, crowding agents, and detergents that are necessary to stabilize the complex can be used during purification. However, observed stoichiometry values can be dependent on the protocol used to solubilize and proteolyze a given complex 64, which highlights the necessity of protocol optimization. Moreover, as in particular SRM‐based methods are highly selective and sensitive and can even quantify low‐abundance proteins in lysates 81, stoichiometries can be determined in complex samples and the only requirement is that unbound ligands be removed before proteolysis. Another benefit is that once a targeted peptide‐based (SRM) assay has been established, it can also be used to quantify the expression level of the proteins involved in complex formation, to correlate the stoichiometry with the concentration of any other protein or PTM 73 in the sample and to track complex disintegration 68 or sample losses at different stages of the purification process. For a more detailed description of the SRM method, we refer to excellent reviews 82, 83, 84.
Of late, there have been attempts to replace the highly targeted MS approach to quantification by more generic label‐free techniques that use generic protein standards, standards that can be applied to any study without prior optimization. Selbach and co‐workers have recently introduced the iBAQ 85 approach. In brief, the intensities for all observed tryptic peptides assigned to a protein are summed and scaled relative to the number of peptides that can theoretically be generated for this protein by tryptic cleavage. The resulting iBAQ values are generated for all proteins in a sample from regular nontargeted data acquisition, without protein‐ or peptide‐specific optimization. Absolute quantification (i.e. determination of concentrations or copy numbers of the proteins in the sample) is achieved by spiking the sample with a generic protein standard spanning a large dynamic range in terms of molecular weight and molarity, such as the commercially available Universal Proteomics Standard 2. The data are then calibrated with the iBAQ values for the standard proteins at their known concentrations. iBAQ and the related Protein Abundance Index method have been used to determine the stoichiometries of several protein complexes 86, 87, 88, including the human hPrp19/CDc5L spliceosomal complex 89. A comparison with previously published data using targeted SRM quantification with tailored synthetic peptide standards 64 showed overall good agreement between the stoichiometric values obtained. However, small ratio changes—such as the difference between 1:3 and 1:2—were difficult to determine in the published data, leaving a question mark against the accuracy of the approach. Furthermore, iBAQ works best when proteins of similar size are analyzed. Small and basic proteins such as those often found in protein–RNA complexes often lead to deviating stoichiometry values as exemplified for the ribosomal proteins 90. To overcome these limitations, Limbach et al. combined iBAQ with multiple enzymatic digestions and ion mobility separation 91. Despite these shortcomings, global label‐free quantification approaches such as iBAQ present a promising development, especially when used in combination with other non‐MS‐based methods or as a primary comparative screen, since they do not require significant prior optimization.
5. Critical steps in peptide‐based stoichiometry determination
5.1. Reference peptide generation with available technical platforms
As outlined above, the generation of proxy peptides is a prerequisite for the peptide‐based approach using reference peptides. Various technological platforms have been developed and applied for the generation of reference peptides for targeted peptide‐based quantification assays. They differ mainly in the source of the reference peptides and—in relation to this—the time point of their addition during the sample preparation workflow (Table 3) 63, 70, 72, 77, 92, 93, 94, 95, 96, 97, 98, 99.
Table 3.
Different strategies for the addition of reference peptides
| Source of the peptide | Level of labeling | Type of label | Method of quantification | Abbreviation | References |
|---|---|---|---|---|---|
| Reference peptide | Chemical synthesis using labeled amino acids | Heavy isotope labeled amino acids | Amino acid analysis Frank et al. 100, Arsene et al. 142 | AQUA (absolute quantification) | Gerber et al. 63 |
| Chemical postsynthesis tagging | Isotope‐labeled tags | Weighing | ICPL | Hochleitner et al. 70 | |
| Reference concatamer | Metabolic labeling | 15N label | Not necessary for stoichiometries | QconCAT | Beynon et al. 92 |
| Enzymatic labeling in vivo | Heavy isotope labeled amino acids | Not necessary for stoichiometries | PCS (peptide concatenated standard) | Kito et al. 77 | |
| In vitro translation incorporating labeled amino acids | Heavy isotope labeled amino acids: K | Not necessary for stoichiometries | polySIS | Anderson et al. 93 | |
| Chemical synthesis, trypsination, labeling | mTRaq | Equalization using a concatenated reporter peptide | EtEP (equimolarity through equalizer peptide) | Holzmann et al. 72 | |
| Reference protein | In vitro translation (E. coli extract) incorporating labeled amino acids | Heavy isotope labeled amino acids: R/K | Amino acid analysis | PSAQ (protein standard for absolute quantification) | Brun et al. 94 Protein synthesis: Torizawa et al. 95 |
| In vitro translation (wheat germ extract) incorporating labeled amino acids | Heavy isotope labeled amino acids: R/K | Quantification of a tag peptide after digestion using the AQUA approach | Flexiquant | Singh et al. 96 Protein synthesis: Endo and Sawasaki 97 | |
| In vitro translation (E. coli extract) incorporating labeled amino acids | Heavy isotope labeled amino acids: R/K+ selenomethionine | ICPMS quantification of selenomethionine | RISQ | Zinn et al. 98 | |
| Metabolic labeling in vivo (auxotrophic E. coli strain) or upon in vitro translation | Heavy isotope labeled amino acids: R/K | Amino acid analysis | Absolute SILAC | Hanke et al. 99 |
First, reference peptides can be synthesized chemically and added to the sample before or after digestion. Gygi and colleagues refined this method and termed it AQUA 63. The clear advantage of this strategy is that it is very flexible, as AQUA peptides for different target proteins can be combined freely. Since isotopic labeling occurs upon chemical synthesis, the position and type of label can be freely chosen. In addition, isotopically labeled versions of, for example, post‐translationally modified peptides can be synthesized and quantified along with unmodified peptides. As for any other standards, quantification using AQUA peptides is only as accurate as the determination of concentrations of synthetic peptides. Amino acid analysis 100 is still considered the gold standard for the quantification of peptides; unlike, for example, UV‐ or fluorescence‐based methods, it does not depend on specific sequence features. However, it requires relatively large amounts of peptide compared with MS and is costly to perform for large numbers of peptides. Owing to the high cost of peptide synthesis and peptide quantification, candidate sequences for AQUA peptides have to be selected carefully, and digestion efficiency and peptide stability have to be monitored thoroughly, as will be described in the last part of this review. In addition, AQUA peptides are added late in the overall workflow (Table 3), with the consequence that possible analyte losses incurred by sample processing 94 or adsorption cannot be corrected. For the determination of protein stoichiometry, however, relative quantification is sufficient, as only the ratios between the complex constituents’ concentrations are determined. Provided that the complex stoichiometry is conserved throughout sample preparation, overall losses in the total complex abundance are not necessarily problematic per se.
Alternatively, selected peptide proxies for different proteins can be concatenated into a single artificial gene that is then translated in vivo or in vitro into an artificial protein in an approach termed QconCAT (quantification concatamer, Table 3 92). In contrast to individual reference peptides, concatamer proteins have to be added before the digestion step. Because they do not share the tertiary structure of the target proteins, they do not allow classical prefractionation at the protein level 94. Following digestion, however, enrichment by classical chromatographic methods or IEF 101 is possible, in the same way as for individual reference peptides. Ideally, all the encoded reference peptides will be formed in an equimolar ratio upon enzymatic digestion of the concatamer. For complex stoichiometry determinations, this equimolarity is especially useful, because an absolute concentration is not needed and it allows an easy and precise determination of stoichiometry. However, because of the equimolarity of the reference peptides generated, no copy numbers of proteins in a complex can be determined unless the total amounts of both the intact complex and the concatamer are known. While both AQUA peptides and concatamers rely on the complete formation of the endogenous peptides (see also above), other sources of error are orthogonal. Although the accuracy of the AQUA strategy relies on the accuracy of the AQUA peptide concentration determination and the precision of pipetting and peptide handling, the concatamer strategy depends on the quantitative digestion of the concatamer 102. As concatamers do not share the higher order structure of the endogenous proteins, their digestion kinetics will often be different, in most cases faster, because of the lack of a stable fold 103. An interesting intermediate between the AQUA and QconCAT strategies is the EtEP (equimolarity through equalizer peptide 72) approach. This is based on sets of tryptic reference peptides that are all fused to the same equalizer peptide. Following tryptic digestion, the equalizer peptide's concentrations are determined by targeted MS, and by using these EtEP concentrations one can correct all EtEP reference peptides to equimolarity. Thereafter, differential isotopic labeling with a nonisobaric chemical label can be used to differentiate the native and reference peptides, making the EtEP approach a very cost‐efficient alternative to direct synthesis and quantification of AQUA peptides, especially for larger assays requiring numerous reference peptides. Alternatively, tandem peptides 104 (representing the minimal QconCAT) can be used for stoichiometry determination. Tandem peptides comprising two target peptide sequences from two subunits are optimal for ensuring equimolarity after proteolysis. This approach, which has not been widely applied so far, should work mainly for small complexes because for larger complexes it leads to a combinatorical explosion of tandem peptides needed.
While all these reference peptide strategies rely on the correct preselection of proxy reference peptides (see last section), the use of entire isotopically labeled reference proteins instead of only peptides makes this limitation irrelevant because all possible peptides from a protein can be studied at once. Isotopically labeled reference proteins can be translated in vitro or in vivo. Translation in vitro is restricted to some model translation systems such as wheat germ extract 105, rabbit reticulocyte 106, human HeLa 107, or S30 Escherichia coli lysates, or the reconstituted E. coli translation system 108; nevertheless, it has the advantage that the synthesis can easily be manipulated, for example, for labeling with isotopically labeled amino acids. Alternatively, reference proteins prepared by translation in vivo might also contain PTMs if a eukaryotic expression system is chosen. Isotope labeling of proteins biosynthesized in vivo can be performed either metabolically (e.g. by 15N labeling; 109), or more elegantly by supplying isotopically labeled amino acids to auxotrophic strains that are only available for selected organisms 99, 110. In addition, reference proteins can be labeled isotopically ex vivo by any chemical labeling following synthesis and purification (Table 3). In general, reference proteins have the advantage that they can be added upstream in the sample preparation workflow, as they are nearly identical to the endogenous target protein. Brun et al. showed that this indeed corrects for analyte losses upon purification and leads to higher measured protein concentrations compared with the AQUA or QconCAT strategy 94. Although such reference proteins should in principle exhibit the same digestion kinetics upon treatment with endoproteinase as their endogenous counterparts, this need not always be the case. A protein might exhibit different proteolysis kinetics in the free and complexed states. Also, proteins in native complexes—that is those isolated directly from cells—might behave differently from overexpressed ones. Many overexpressed proteins tend to be incorrectly folded, especially when expressed heterologously. Proper folding is often coupled to the finely tuned rate of protein synthesis, which is known to be organism‐specific 111, 112, 113. In addition, PTMs have been found to affect folding 114.
5.2. Peptide selection, peptide stability, and peptide formation
The fact that proteins are quantified via peptides—or, more generally, that the internal standard differs from the actual analyte in its unprocessed state—makes high demands on the selection of proper proxy peptides and sample treatment. Under these circumstances, acquiring more than one experimental value for a protein's concentration greatly increases the robustness of the method. As a rule of thumb, for accurate determination of protein stoichiometries and copy numbers, at least three proxy peptides per protein should be selected and used as reference peptides. This poses a challenge in particular where smaller, basic, or largely hydrophobic proteins are investigated—for example RNA‐binding or membrane proteins that contain only a limited number of suitable proxy peptides. In addition, the choice of adequate proxy peptides has to follow certain rules of peptide biochemistry (see below, Fig. 3)
Figure 3.
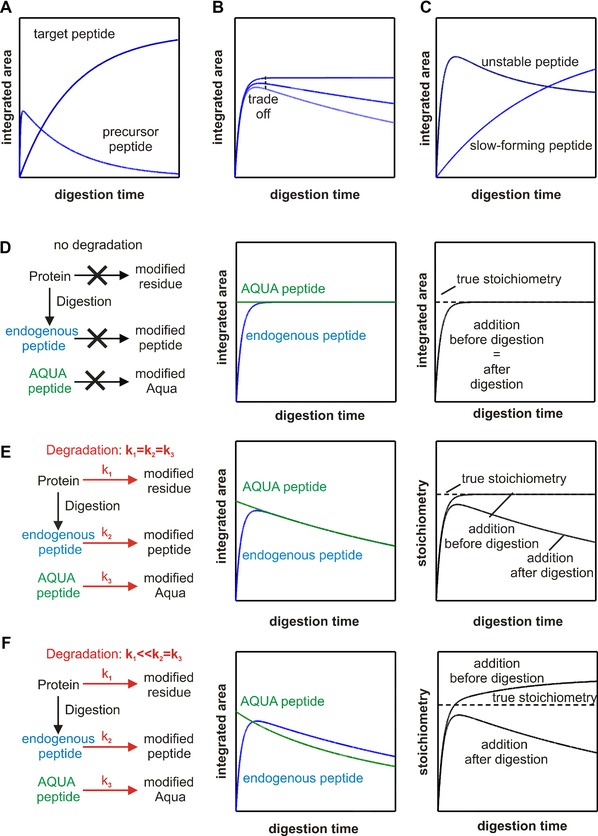
The use of time courses in evaluating the quantification accuracy. (A) Tracking the missed cleaved peptides over time helps to evaluate the completeness of the digestion with respect to the selected peptides. (B) In the case of unstable peptides even at the maximum, the signal intensity does not reflect the level of endogenous peptides. (C) When slow forming and unstable peptides are combined, there is no time point at which the integrated area ratio reflects the true stoichiometry. (D) When stable peptides are inspected, the time point of AQUA peptide addition does influence the observed stoichiometry, which equals the true stoichiometry. (E) Degradation reactions that have the same rate in the peptide and protein context decrease the observed stoichiometry when the AQUA peptide is added after the digestion. The true stoichiometry can be assessed when the AQUA peptide is added early in the workflow. (F) Degradation reactions that have faster rate or only occur in the peptide context lead to wrong stoichiometries irrespective of the time point of AQUA peptide addition. Notably, the addition prior or upon digestion will mask this problem since a stable stoichiometry is observed. To detect such degradation reaction, the addition after digestion is much more indicative.
Clearly, proxy peptides should exhibit suitable properties for MS analysis and represent unambiguously the protein of interest; these two properties were summed up as the property of “proteotypicity” 115. Candidate peptides can be selected from databases such as the PeptideAtlas (www.peptideatlas.org/), PRIDE (www.ebi.ac.uk/pride/), Human Proteinpedia (www.humanproteinpedia.org), and the Global Proteome Machine (http://gpmdb.thegpm.org/), which contain sets of tryptic peptides that are frequently observed in global proteomics experiments. As the peptide sets contained in these repositories were generated by analyzing very different sample types on different MS platforms, experimental determination of suitable peptides should always supersede, or at least complement, simple selection from databases. Peptides are only proteotypic when they are unique to that protein against the sample's background, so that following digestion the concentration of the peptide as determined equals that of the protein. Proteotypic peptides can be either computationally predicted by algorithms trained on large datasets 115, 116, 117 or else chosen from available databases 84, 118. However, Jaquinod et al. have shown that predictions of the best reference peptides for a particular protein show poor 119 or even no 81 correlation with experimental data. In contrast to the multitude of proteins in shotgun MS proteomic experiments, the set of proteins in a macromolecular complex of interest is small, which makes the experimental inspection of all possible peptides a viable alternative in many cases 82.
The central assumption that the protein concentration equals the concentration of a reference peptide is, furthermore, only valid when the proteotypic peptides are quantitatively formed from the endogenous protein upon proteolysis 120 and do not decay over time. Beynon and colleagues termed such peptides that are not only proteotypic but also well suited to represent the protein concentration “quantotypic” 121. These criteria make even higher demands on the selection of the reference peptides and on the digestion conditions 64, 122 and have prompted us to discuss tryptic proteolysis in combination with peptide stability consideration in detail.
In the initial phase of proteolytic digestion, organic solvents, chaotropes, and surfactants can help to destabilize the protein structure and thereby improve the susceptibility toward protease cleavage. In this phase, the efficiency of cleavage depends mainly on the specific folds of the respective proteins 123, 124 and their tendency to unfold, on the solubility of the proteins, and on the presence of stabilizing disulfide bridges. As these properties can vary between individual domains in a protein, it is recommended that peptides from different regions of the target protein be quantified separately and the results consolidated.
After the first phase of proteolysis, the speed and completeness of the digestion depend mainly on the local sequence contexts of the scissile bonds. In the case of trypsin, two sources of incomplete digestion can be distinguished. First, dead‐end products can be formed when the product peptides have bibasic sequences (XXXXBB) or dipeptidyl extensions (XXXXBXB), because trypsin has only weak exonuclease activity even for cationic amino acid residues. The second source of incomplete digestion is the fact that even when complete digestion is possible, the rate is strongly influenced by at least the three neighboring residues. Especially, aspartate and glutamate residues can form salt bridges with the lysines and arginines of the tryptic binding sites, and these bridges decelerate the tryptic digestion. Unfortunately, Asp and Glu also increase the detectability of peptides, so that Asp/Glu‐containing peptides are actually overrepresented in proteotypic peptides 115. The propensities of other amino acid residues are less pronounced and harder to rationalize, but new software algorithms trained on large peptide datasets can help to predict peptides with efficient cleavage sites 125, 126. When no optimal peptides are available in a given target protein, prolonged digestion times and higher concentrations of protease and/or substrate 127 are necessary in order to complete the digestion. Alternatively, tandem LysC/trypsin proteolysis protocols have shown a superior cleavage efficiency when compared with trypsin alone 128. In addition, elevated temperatures, immobilized trypsin, ultrasonication, high pressure, microwave energy, and microreactors have been shown to speed up proteolysis (reviewed in 129, 130).
Digestion protocols have to be optimized for every individual complex 120. For example, Schmidt et al. 64 demonstrated that the observed stoichiometric ratios for the human spliceosomal hPrp19/CDC5L complex were directly dependent on the protocol used for solubilization and digestion of the complex. To this end, digestion efficiency should be assessed and monitored at different stages. At the protein level, uncleaved proteins can be tracked over time by SDS‐PAGE, or after chromatographic separation by UV/VIS spectroscopy or MS 131. At the peptide level, the MS results yield the average charge states of all peptides, the overall number of identified spectra 132, 133, the relative amount of missed cleavage peptides, and the sequence coverage. As these features characterize the overall, global digestion efficiency rather than providing information about the formation of an individual target peptide, it is recommended that one complements the global analysis by monitoring the time courses of formation of the target peptides, for example by SRM. Often it is informative to track possible missed cleaved peptides and thus precursors of the target peptide simultaneously (Fig. 3A 120, 121).
In addition to being formed quantitatively, peptides should also be stable in solution throughout the course of the analysis in order to represent the target protein properly. They should be resistant to chemical degradation processes such as oxidation, deamidation, or autocleavage (reviewed by Manning et al. 134). In addition to chemical degradation processes, peptides can be physically lost owing to adsorption effects that are strongly surface‐ and peptide‐dependent 135 and can become dominant especially for hydrophobic peptides 136. In order to avoid adsorption effects, peptide solutions should be handled and stored in as concentrated a form as possible 137, in glass‐ or plastic ware optimized for this 135. In addition, carrier proteins can be used to minimize adsorption, especially at low peptide concentrations. To avoid selecting peptides that are prone to such degradation or adsorption, useful heuristic rules for the selection of peptides have been formulated 83.
In addition to these sequence‐dependent degradation processes, a peptide can be degraded by atryptic cleavage 84, 138, by unspecific labeling with iodoacetamide (which is often used to derivatize cysteines) 139, 140, or by the reaction with isocyanates 140, 141 that are present as an impurity when urea is used as a chaotrope. Because degradation processes are time‐dependent, the amount of peptides found is determined by the completeness of digestion and thus formation of the target peptide on the one hand, and potential degradation processes that remove the target peptide on the other (Fig. 3B and C). In such cases, even the highest peptide concentration attained does not reflect the theoretical protein concentration. Especially, when slow‐forming and chemically unstable peptides are combined, it is obvious (Fig. 3C) that stoichiometries cannot be correctly quantified because the available peptide concentration is strongly time‐dependent. To exclude such scenarios, it is again valuable to choose reference peptides on the basis of experimentally observed digestion kinetics. Peptides that reach a plateau and do not decay are obviously stable (Fig. 3D). Because the reference peptide has the same physicochemical properties as the endogenous tryptic peptide, it can be expected that it will undergo the same decomposition reactions and at the same speed. In practice, it is often recommended that the reference peptide be added as early as possible in the quantification workflow, in order to improve correction for physical loss or degradation (Fig. 3E). The correction by early addition works only if the endogenous proxy peptide has the same propensity toward loss or degradation in solution compared with its corresponding propensity when still in the macromolecular environment of the protein.
For a number of degradation events, such as N‐terminal cyclization, deamidation, or backbone cleavage, it is known that their kinetics depend on the higher order structure of the peptide in the protein (or in larger fragments derived from the protein) 134. In such cases, a corresponding reference peptide will be degraded much more rapidly than the endogenous peptide in the initial phase of digestion, as the latter is still shielded by its protein environment (Fig. 3F). In these cases, the amount of the endogenous peptide will therefore be overestimated, even though the time course of the stoichiometry does not necessarily reveal any degradative path. The extent of this effect depends on differences in degradation kinetics between protein and peptide and on the speed of digestion. Slower digestions will lead to larger overestimations than faster digestions 142, highlighting the importance of selecting stable reference peptides and of optimizing the conditions of digestion. In such a scenario, there is no ideal time point to add reference peptides, since concurrent and postdigestion addition both lead to incorrect stoichiometries. To exclude such scenarios, it is thus advisable to compare the stoichiometry with the pre‐ and postdigestion addition of AQUA peptides, or at least to track the endogenous peptide over time. If stable peptides cannot be found, then such degradation processes may be corrected for by kinetic modeling; otherwise, a different reference source must be used, one that resembles the endogenous protein more closely, throughout the analytical process 143.
Concatenated peptides as sources of reference proxy peptides do not share the tertiary structure of the target protein and thus have different digestion kinetics 103. In order to attain comparable cleavage efficiencies, Kito et al. included the flanking sequences of the individual concatenation peptides in the QconCAT design 77. Along the same lines, Barnidge et al. 144 investigated the use of cleavable reference peptides in order to retain the flexibility of reference peptides compared with the QconCAT approach. However, it is still unlikely that all the approaches and corrections mentioned here adequately correct for all the kinetics of peptide formation and decay. Therefore, reference proteins (Table 3) have become the gold standard because they share the same amino acid sequence and secondary and tertiary structures with the endogenous protein, albeit with the exceptions mentioned above. Consistently, Jaquinod et al. showed that with the use of reference proteins even noncanonical reference peptides (containing Met/Cys‐ or missed cleavage sites) can be successfully employed for absolute quantification 119.
Since protein concentration determinations are error‐prone per se, concatenated proteins or subunits could offer an attractive technical solution They share the advantage of the QconCAT strategy that guarantees theoretical equimolarity of reference peptides; in addition, they have higher order structures similar to those of the endogenous proteins, which helps to correct for differential digestion rates and thus extends the set of potential reference sequences 119. Comparable approaches were first applied by Isacoff and colleagues 145, who concatenated subunits of the voltage‐gated K+‐channel family to study the subunit stoichiometry and topology of receptors and ion channels (reviewed in 146). In the meantime, various validation methods to ensure the uniformity and stoichiometry of expressed protein concatamers have emerged 147. Combined with the technical progress in rapid and cost‐efficient synthesis of artificial genes, this technique could become an improved platform in cases of small‐ to medium‐sized complexes when highly accurate stoichiometry values are required.
6. Summary
Accurate and precise determination of protein stoichiometry in protein complexes remains challenging. However, the development of mass‐spectrometric technologies and their continuous improvement, together with the establishment of corresponding workflows for the introduction of quantitative standards, are beginning to allow the elucidation of protein stoichiometries in a much more precise manner than classical methods have done. Both of the MS‐based approaches—MS of intact protein complexes and the peptide‐based MS methodology—have proven their value in an increasing number of studies.
Peptide‐based MS can be easily implemented into any mass spectrometric based proteomic workflow for the following reasons: First, it is highly sensitive. Second, it is tolerant to different detergents and salts; this makes it largely orthogonal to other approaches. Third, the analytical workflow is straightforward, as it can be performed with almost any ESI‐MS. Fourth, data evaluation is also straightforward and dedicated software tools including tutorials are freely available (e.g. Skyline 148). Finally, peptide‐based MS allows the co‐quantification of protein expression levels, free ligand concentrations, PTMs, sample loss, and even whole signal cascades.
Special consideration has to be given to the question of how reference proxy peptides for such analyses are to be predicted and subsequently generated. Several approaches have emerged, each with specific advantages: global protein standards for label‐free MS such as iBAQ for comparative screening of stoichiometry values and/or determination of protein copy numbers in highly complex samples; AQUA strategies for highly flexible and accurate applications; concatamers for handling large numbers of samples in parallel, from, for example, cellular pathways; and reference proteins (or even concatenated proteins) for high‐precision quantification relying on a larger set of proxy peptides.
In addition, it is worthwhile to consider the interconnected issues of sample preparation, peptide selection, peptide stability, and especially protein digestion. Here, a deeper understanding and the optimization of protocols can help to identify optimum reference peptides and digestion conditions. In this context, the study of time courses appears to be particularly useful.
The authors have declared no conflict of interest.
Acknowledgement
The authors would like to thank Carla Schmidt for critical review of the manuscript and valuable suggestions. I. Wohlgemuth, C. Lenz, and H. Urlaub are funded by the Max Planck Society. In addition, C. Lenz and H. Urlaub are associated to the University Medical Center Göttingen, Germany.
7 References
- 1. Krogan, N. J. , Cagney, G. , Yu, H. , Zhong, G. et al., Global landscape of protein complexes in the yeast Saccharomyces cerevisiae . Nature 2006, 440, 637–643. [DOI] [PubMed] [Google Scholar]
- 2. Gavin, A. C. , Aloy, P. , Grandi, P. , Krause, R. et al., Proteome survey reveals modularity of the yeast cell machinery. Nature 2006, 440, 631–636. [DOI] [PubMed] [Google Scholar]
- 3. Robinson, C. V. , Sali, A. , Baumeister, W. , The molecular sociology of the cell. Nature 2007, 450, 973–982. [DOI] [PubMed] [Google Scholar]
- 4. Cavanagh, J. , Fairbrother, W. J. , Palmer, A. G., III , Rance, M. , Skelton, N. J. , Protein NMR Spectroscopy, Academic Press, Amsterdam, The Netherlands; 2007. [Google Scholar]
- 5. McPherson, A. , Introduction to Macromolecular Crystallography, Wiley‐Blackwell, Hoboken, USA; 2009. [Google Scholar]
- 6. Orlova, E. V. , Saibil, H. R. , Structural analysis of macromolecular assemblies by electron microscopy. Chem. Rev. 2011, 111, 7710–7748. [DOI] [PMC free article] [PubMed] [Google Scholar]
- 7. Lucic, V. , Forster, F. , Baumeister, W. , Structural studies by electron tomography: from cells to molecules. Annu. Rev. Biochem. 2005, 74, 833–865. [DOI] [PubMed] [Google Scholar]
- 8. Walzthoeni, T. , Leitner, A. , Stengel, F. , Aebersold, R. , Mass spectrometry supported determination of protein complex structure. Curr. Opin. Struct. Biol. 2013, 23, 252–260. [DOI] [PubMed] [Google Scholar]
- 9. Stengel, F. , Aebersold, R. , Robinson, C. V. , Joining forces: integrating proteomics and cross‐linking with the mass spectrometry of intact complexes. Mol. Cell. Proteomics 2012, 11, R111. 014027. doi: 10.1074/mcp.R111.014027 [DOI] [PMC free article] [PubMed] [Google Scholar]
- 10. Schmidt, C. , Robinson, C. V. , Dynamic protein ligand interactions—insights from MS. FEBS J. 2014, 281, 1950–1964. [DOI] [PMC free article] [PubMed] [Google Scholar]
- 11. Pinkse, M. W. , Maier, C. S. , Kim, J. I. , Oh, B. H. , Heck, A. J. , Macromolecular assembly of Helicobacter pylori urease investigated by mass spectrometry. J. Mass spectrum. 2003, 38, 315–320. [DOI] [PubMed] [Google Scholar]
- 12. Ori, A. , Banterle, N. , Iskar, M. , Andres‐Pons, A. et al., Cell type‐specific nuclear pores: a case in point for context‐dependent stoichiometry of molecular machines. Mol. Syst. Biol. 2013, 9, 1–20. [DOI] [PMC free article] [PubMed] [Google Scholar]
- 13. Feig, A. L. , Applications of isothermal titration calorimetry in RNA biochemistry and biophysics. Biopolymers 2007, 87, 293–301. [DOI] [PMC free article] [PubMed] [Google Scholar]
- 14. Some, D. , Light‐scattering‐based analysis of biomolecular interactions. Biophys. Rev. 2013, 5, 147–158. [DOI] [PMC free article] [PubMed] [Google Scholar]
- 15. Day, E. S. , Capili, A. D. , Borysenko, C. W. , Zafari, M. , Whitty, A. , Determining the affinity and stoichiometry of interactions between unmodified proteins in solution using Biacore. Anal. Biochem. 2013, 440, 96–107. [DOI] [PMC free article] [PubMed] [Google Scholar]
- 16. Padrick, S. B. , Brautigam, C. A. , Evaluating the stoichiometry of macromolecular complexes using multisignal sedimentation velocity. Methods 2011, 54, 39–55. [DOI] [PMC free article] [PubMed] [Google Scholar]
- 17. Saffarian, S. , Li, Y. , Elson, E. L. , Pike, L. J. , Oligomerization of the EGF receptor investigated by live cell fluorescence intensity distribution analysis. Biophys. J. 2007, 93, 1021–1031. [DOI] [PMC free article] [PubMed] [Google Scholar]
- 18. Nakajo, K. , Ulbrich, M. H. , Kubo, Y. , Isacoff, E. Y. , Stoichiometry of the KCNQ1–KCNE1 ion channel complex. Proc. Natl. Acad. Sci. USA 2010, 107, 18862–18867. [DOI] [PMC free article] [PubMed] [Google Scholar]
- 19. Wittig, I. , Braun, H. P. , Schagger, H. , Blue native PAGE. Nat. Protoc. 2006, 1, 418–428. [DOI] [PubMed] [Google Scholar]
- 20. Diaconu, M. , Kothe, U. , Schlunzen, F. , Fischer, N. et al., Structural basis for the function of the ribosomal L7/12 stalk in factor binding and GTPase activation. Cell 2005, 121, 991–1004. [DOI] [PubMed] [Google Scholar]
- 21. Barrera, N. P. , Ormond, S. J. , Henderson, R. M. , Murrell‐Lagnado, R. D. , Edwardson, J. M. , Atomic force microscopy imaging demonstrates that P2×2 receptors are trimers but that P2×6 receptor subunits do not oligomerize. J. Biol. Chem. 2005, 280, 10759–10765. [DOI] [PubMed] [Google Scholar]
- 22. Muller, S. A. , Muller, D. J. , Engel, A. , Assessing the structure and function of single biomolecules with scanning transmission electron and atomic force microscopes. Micron 2011, 42, 186–195. [DOI] [PubMed] [Google Scholar]
- 23. Bulseco, D. A. , Wolf, D. E. , Fluorescence correlation spectroscopy: molecular complexing in solution and in living cells. Methods Cell Biol. 2013, 114, 489–524. [DOI] [PubMed] [Google Scholar]
- 24. Mogridge, J. , Cunningham, K. , Collier, R. J. , Stoichiometry of anthrax toxin complexes. Biochemistry 2002, 41, 1079–1082. [DOI] [PubMed] [Google Scholar]
- 25. Winzor, D. J. , Analytical exclusion chromatography. J. Biochem. Biophys. Methods 2003, 56, 15–52. [DOI] [PubMed] [Google Scholar]
- 26. Oeffinger, M. , Two steps forward‐one step back: advances in affinity purification mass spectrometry of macromolecular complexes. Proteomics 2012, 12, 1591–1608. [DOI] [PubMed] [Google Scholar]
- 27. Barrios‐Rodiles, M. , Brown, K. R. , Ozdamar, B. , Bose, R. et al., High‐throughput mapping of a dynamic signaling network in mammalian cells. Science 2005, 307, 1621–1625. [DOI] [PubMed] [Google Scholar]
- 28. Breitkreutz, A. , Choi, H. , Sharom, J. R. , Boucher, L. et al., A global protein kinase and phosphatase interaction network in yeast. Science 2010, 328, 1043–1046. [DOI] [PMC free article] [PubMed] [Google Scholar]
- 29. Rodnina, M. V. , Fricke, R. , Wintermeyer, W. , Transient conformational states of aminoacyl‐tRNA during ribosome binding catalyzed by elongation factor Tu. Biochemistry 1994, 33, 12267–12275. [DOI] [PubMed] [Google Scholar]
- 30. Gavin, A. C. , Maeda, K. , Kuhner, S. , Recent advances in charting protein‐protein interaction: mass spectrometry‐based approaches. Curr. Opin. Biotechnol. 2011, 22, 42–49. [DOI] [PubMed] [Google Scholar]
- 31. Mousson, F. , Kolkman, A. , Pijnappel, W. W. , Timmers, H. T. , Heck, A. J. , Quantitative proteomics reveals regulation of dynamic components within TATA‐binding protein (TBP) transcription complexes. Mol. Cell. Proteomics 2008, 7, 845–852. [DOI] [PubMed] [Google Scholar]
- 32. Wang, X. , Huang, L. , Identifying dynamic interactors of protein complexes by quantitative mass spectrometry. Mol. Cell. Proteomics 2008, 7, 46–57. [DOI] [PubMed] [Google Scholar]
- 33. Kito, K. , Kawaguchi, N. , Okada, S. , Ito, T. , Discrimination between stable and dynamic components of protein complexes by means of quantitative proteomics. Proteomics 2008, 8, 2366–2370. [DOI] [PubMed] [Google Scholar]
- 34. Stark, H. , Chari, A. , Haselbach, D. , Kirves, J. M. , Methods for analyzing biological macromolecular complexes and use thereof. Patent No WO2013034160A1, 14.03.2013.
- 35. Schmeing, T. M. , Voorhees, R. M. , Kelley, A. C. , Gao, Y. G. et al., The crystal structure of the ribosome bound to EF‐Tu and aminoacyl‐tRNA. Science 2009, 326, 688–694. [DOI] [PMC free article] [PubMed] [Google Scholar]
- 36. Chari, A. , Fischer, U. , Cellular strategies for the assembly of molecular machines. Trends Biochem. Sci. 2010, 35, 676–683. [DOI] [PubMed] [Google Scholar]
- 37. Madler, S. , Barylyuk, K. , Boeri Erba, E. , Nieckarz, R. J. , Zenobi, R. , Compelling advantages of negative ion mode detection in high‐mass MALDI‐MS for homomeric protein complexes. J. Am. Soc. Mass Spectrom. 2012, 23, 213–224. [DOI] [PubMed] [Google Scholar]
- 38. Davydov, I. I. , Wohlgemuth, I. , Artamonova, I. I. , Urlaub, H. et al., Evolution of the protein stoichiometry in the L12 stalk of bacterial and organellar ribosomes. Nat. Commun. 2013, 4, 1–10. [DOI] [PubMed] [Google Scholar]
- 39. Gordiyenko, Y. , Videler, H. , Zhou, M. , McKay, A. R. et al., Mass spectrometry defines the stoichiometry of ribosomal stalk complexes across the phylogenetic tree. Mol. Cell. Proteomics 2010, 9, 1774–1783. [DOI] [PMC free article] [PubMed] [Google Scholar]
- 40. Ganem, B. , Li, Y. T. , Henion, J. D. , Detection of noncovalent receptor‐ligand complexes by mass spectrometry. J. Am. Chem. Soc. 1991, 113, 6294–6296. [Google Scholar]
- 41. Snijder, J. , Heck, A. J. , Analytical approaches for size and mass analysis of large protein assemblies. Annu. Rev. Anal. Chem. 2014, 7, 43–64. [DOI] [PubMed] [Google Scholar]
- 42. Marcoux, J. , Robinson, C. V. , Twenty years of gas phase structural biology. Structure 2013, 21, 1541–1550. [DOI] [PubMed] [Google Scholar]
- 43. Sanglier, S. , Atmanene, C. , Chevreux, G. , Dorsselaer, A. V. , Nondenaturing mass spectrometry to study noncovalent protein/protein and protein/ligand complexes: technical aspects and application to the determination of binding stoichiometries. Methods Mol. Biol. 2008, 484, 217–243. [DOI] [PubMed] [Google Scholar]
- 44. Gromiha, M. M. , Saranya, N. , Selvaraj, S. , Jayaram, B. , Fukui, K. , Sequence and structural features of binding site residues in protein‐protein complexes: comparison with protein‐nucleic acid complexes. Proteome Sci. 2011, 9(Suppl) 1), 1–6. [DOI] [PMC free article] [PubMed] [Google Scholar]
- 45. Rose, R. J. , Damoc, E. , Denisov, E. , Makarov, A. , Heck, A. J. , High‐sensitivity Orbitrap mass analysis of intact macromolecular assemblies. Nat. Methods 2012, 9, 1084–1086. [DOI] [PubMed] [Google Scholar]
- 46. Boeri Erba, E. , Investigating macromolecular complexes using top‐down mass spectrometry. Proteomics 2014, 14, 1259–1270. [DOI] [PubMed] [Google Scholar]
- 47. Tahallah, N. , Pinkse, M. , Maier, C. S. , Heck, A. J. , The effect of the source pressure on the abundance of ions of noncovalent protein assemblies in an electrospray ionization orthogonal time‐of‐flight instrument. Rapid Commun. Mass Spectrom. 2001, 15, 596–601. [DOI] [PubMed] [Google Scholar]
- 48. Sobott, F. , Hernandez, H. , McCammon, M. G. , Tito, M. A. , Robinson, C. V. , A tandem mass spectrometer for improved transmission and analysis of large macromolecular assemblies. Anal. Chem. 2002, 74, 1402–1407. [DOI] [PubMed] [Google Scholar]
- 49. Chernushevich, I. V. , Thomson, B. A. , Collisional cooling of large ions in electrospray mass spectrometry. Anal. Chem. 2004, 76, 1754–1760. [DOI] [PubMed] [Google Scholar]
- 50. Hernandez, H. , Robinson, C. V. , Determining the stoichiometry and interactions of macromolecular assemblies from mass spectrometry. Nat. Protoc. 2007, 2, 715–726. [DOI] [PubMed] [Google Scholar]
- 51. Hilton, G. R. , Benesch, J. L. , Two decades of studying non‐covalent biomolecular assemblies by means of electrospray ionization mass spectrometry. J. R. Soc. Interface. 2012, 9, 801–816. [DOI] [PMC free article] [PubMed] [Google Scholar]
- 52. Hall, Z. , Hernandez, H. , Marsh, J. A. , Teichmann, S. A. , Robinson, C. V. , The role of salt bridges, charge density, and subunit flexibility in determining disassembly routes of protein complexes. Structure 2013, 21, 1325–1337. [DOI] [PMC free article] [PubMed] [Google Scholar]
- 53. Uetrecht, C. , Rose, R. J. , van Duijn, E. , Lorenzen, K. , Heck, A. J. , Ion mobility mass spectrometry of proteins and protein assemblies. Chem. Soc. Rev. 2010, 39, 1633–1655. [DOI] [PubMed] [Google Scholar]
- 54. Morgner, N. , Robinson, C. V. , Massign: an assignment strategy for maximizing information from the mass spectra of heterogeneous protein assemblies. Anal. Chem. 2012, 84, 2939–2948. [DOI] [PubMed] [Google Scholar]
- 55. Hernandez, H. , Dziembowski, A. , Taverner, T. , Seraphin, B. , Robinson, C. V. , Subunit architecture of multimeric complexes isolated directly from cells. EMBO Rep. 2006, 7, 605–610. [DOI] [PMC free article] [PubMed] [Google Scholar]
- 56. Levy, E. D. , Boeri Erba, E. , Robinson, C. V. , Teichmann, S. A. , Assembly reflects evolution of protein complexes. Nature 2008, 453, 1262–1265. [DOI] [PMC free article] [PubMed] [Google Scholar]
- 57. Hall, Z. , Politis, A. , Robinson, C. V. , Structural modeling of heteromeric protein complexes from disassembly pathways and ion mobility‐mass spectrometry. Structure 2012, 20, 1596–1609. [DOI] [PubMed] [Google Scholar]
- 58. Peschke, M. , Verkerk, U. H. , Kebarle, P. , Features of the ESI mechanism that affect the observation of multiply charged noncovalent protein complexes and the determination of the association constant by the titration method. J. Am. Soc. Mass Spectrom. 2004, 15, 1424–1434. [DOI] [PubMed] [Google Scholar]
- 59. Hochberg, G. K. , Benesch, J. L. , Dynamical structure of alphaB‐crystallin. Prog. Biophys. Mol. Biol. 2014, 115, 11–20. [DOI] [PubMed] [Google Scholar]
- 60. Miranker, A. , Robinson, C. V. , Radford, S. E. , Aplin, R. T. , Dobson, C. M. , Detection of transient protein folding populations by mass spectrometry. Science 1993, 262, 896–900. [DOI] [PubMed] [Google Scholar]
- 61. Boeri Erba, E. , Barylyuk, K. , Yang, Y. , Zenobi, R. , Quantifying protein‐protein interactions within noncovalent complexes using electrospray ionization mass spectrometry. Anal. Chem. 2011, 83, 9251–9259. [DOI] [PubMed] [Google Scholar]
- 62. Benesch, J. L. , Ruotolo, B. T. , Sobott, F. , Wildgoose, J. et al., Quadrupole‐time‐of‐flight mass spectrometer modified for higher‐energy dissociation reduces protein assemblies to peptide fragments. Anal. Chem. 2009, 81, 1270–1274. [DOI] [PubMed] [Google Scholar]
- 63. Gerber, S. A. , Rush, J. , Stemman, O. , Kirschner, M. W. , Gygi, S. P. , Absolute quantification of proteins and phosphoproteins from cell lysates by tandem MS. Proc. Natl. Acad. Sci. USA 2003, 100, 6940–6945. [DOI] [PMC free article] [PubMed] [Google Scholar]
- 64. Schmidt, C. , Lenz, C. , Grote, M. , Luhrmann, R. , Urlaub, H. , Determination of protein stoichiometry within protein complexes using absolute quantification and multiple reaction monitoring. Anal. Chem. 2010, 82, 2784–2796. [DOI] [PubMed] [Google Scholar]
- 65. Bennett, E. J. , Rush, J. , Gygi, S. P. , Harper, J. W. , Dynamics of cullin‐RING ubiquitin ligase network revealed by systematic quantitative proteomics. Cell 2010, 143, 951–965. [DOI] [PMC free article] [PubMed] [Google Scholar]
- 66. Wepf, A. , Glatter, T. , Schmidt, A. , Aebersold, R. , Gstaiger, M. , Quantitative interaction proteomics using mass spectrometry. Nat. Methods 2009, 6, 203–205. [DOI] [PubMed] [Google Scholar]
- 67. Warnken, U. , Schleich, K. , Schnolzer, M. , Lavrik, I. , Quantification of high‐molecular weight protein platforms by AQUA mass spectrometry as exemplified for the CD95 death‐inducing signaling complex (DISC). Cells 2013, 2, 476–495. [DOI] [PMC free article] [PubMed] [Google Scholar]
- 68. Benevento, M. , Di Palma, S. , Snijder, J. , Moyer, C. L. et al., Adenovirus composition, proteolysis, and disassembly studied by in‐depth qualitative and quantitative proteomics. J. Biol. Chem. 2014, 289, 11421–11430. [DOI] [PMC free article] [PubMed] [Google Scholar]
- 69. Berko, D. , Herkon, O. , Braunstein, I. , Isakov, E. et al., Inherent asymmetry in the 26S proteasome is defined by the ubiquitin receptor RPN13. J. Biol. Chem. 2014, 289, 5609–5618. [DOI] [PMC free article] [PubMed] [Google Scholar]
- 70. Hochleitner, E. O. , Kastner, B. , Frohlich, T. , Schmidt, A. et al., Protein stoichiometry of a multiprotein complex, the human spliceosomal U1 small nuclear ribonucleoprotein: absolute quantification using isotope‐coded tags and mass spectrometry. J. Biol. Chem. 2005, 280, 2536–2542. [DOI] [PubMed] [Google Scholar]
- 71. Holzmann, J. , Fuchs, J. , Pichler, P. , Peters, J. M. , Mechtler, K. , Lesson from the stoichiometry determination of the cohesin complex: a short protease mediated elution increases the recovery from cross‐linked antibody‐conjugated beads. J. Proteome Res. 2011, 10, 780–789. [DOI] [PMC free article] [PubMed] [Google Scholar]
- 72. Holzmann, J. , Pichler, P. , Madalinski, M. , Kurzbauer, R. , Mechtler, K. , Stoichiometry determination of the MP1‐p14 complex using a novel and cost‐efficient method to produce an equimolar mixture of standard peptides. Anal. Chem. 2009, 81, 10254–10261. [DOI] [PubMed] [Google Scholar]
- 73. Ding, C. , Li, Y. , Kim, B. J. , Malovannaya, A. et al., Quantitative analysis of cohesin complex stoichiometry and SMC3 modification‐dependent protein interactions. J. Proteome Res. 2011, 10, 3652–3659. [DOI] [PMC free article] [PubMed] [Google Scholar]
- 74. Olinares, P. D. , Kim, J. , Davis, J. I. , van Wijk, K. J. , Subunit stoichiometry, evolution, and functional implications of an asymmetric plant plastid ClpP/R protease complex in Arabidopsis. Plant Cell 2011, 23, 2348–2361. [DOI] [PMC free article] [PubMed] [Google Scholar]
- 75. Nanavati, D. , Gucek, M. , Milne, J. L. , Subramaniam, S. , Markey, S. P. , Stoichiometry and absolute quantification of proteins with mass spectrometry using fluorescent and isotope‐labeled concatenated peptide standards. Mol. Cell. Proteomics 2008, 7, 442–447. [DOI] [PubMed] [Google Scholar]
- 76. Al‐Majdoub, Z. M. , Carroll, K. M. , Gaskell, S. J. , Barber, J. , Quantification of the proteins of the bacterial ribosome using QconCAT technology. J. Proteome Res. 2014, 13, 1211–1222. [DOI] [PubMed] [Google Scholar]
- 77. Kito, K. , Ota, K. , Fujita, T. , Ito, T. , A synthetic protein approach toward accurate mass spectrometric quantification of component stoichiometry of multiprotein complexes. J. Proteome Res. 2007, 6, 792–800. [DOI] [PubMed] [Google Scholar]
- 78. Kitagawa, N. , Mazon, H. , Heck, A. J. , Wilkens, S. , Stoichiometry of the peripheral stalk subunits E and G of yeast V1‐ATPase determined by mass spectrometry. J. Biol. Chem. 2008, 283, 3329–3337. [DOI] [PubMed] [Google Scholar]
- 79. Simmons, D. A. , Wilson, D. J. , Lajoie, G. A. , Doherty‐Kirby, A. , Konermann, L. , Subunit disassembly and unfolding kinetics of hemoglobin studied by time‐resolved electrospray mass spectrometry. Biochemistry 2004, 43, 14792–14801. [DOI] [PubMed] [Google Scholar]
- 80. Vis, H. , Dobson, C. M. , Robinson, C. V. , Selective association of protein molecules followed by mass spectrometry. Protein Sci. 1999, 8, 1368–1370. [DOI] [PMC free article] [PubMed] [Google Scholar]
- 81. Stergachis, A. B. , MacLean, B. , Lee, K. , Stamatoyannopoulos, J. A. , MacCoss, M. J. , Rapid empirical discovery of optimal peptides for targeted proteomics. Nat. Methods 2011, 8, 1041–1043. [DOI] [PMC free article] [PubMed] [Google Scholar]
- 82. Bereman, M. S. , MacLean, B. , Tomazela, D. M. , Liebler, D. C. , MacCoss, M. J. , The development of selected reaction monitoring methods for targeted proteomics via empirical refinement. Proteomics 2012, 12, 1134–1141. [DOI] [PMC free article] [PubMed] [Google Scholar]
- 83. Lange, V. , Picotti, P. , Domon, B. , Aebersold, R. , Selected reaction monitoring for quantitative proteomics: a tutorial. Mol. Syst. Biol. 2008, 4, 1–14. [DOI] [PMC free article] [PubMed] [Google Scholar]
- 84. Picotti, P. , Aebersold, R. , Selected reaction monitoring‐based proteomics: workflows, potential, pitfalls and future directions. Nat. Methods 2012, 9, 555–566. [DOI] [PubMed] [Google Scholar]
- 85. Schwanhäusser, B. , Busse, D. , Li, N. , Dittmar, G. et al., Global quantification of mammalian gene expression control. Nature 2011, 473, 337–342. [DOI] [PubMed] [Google Scholar]
- 86. Fabre, B. , Lambour, T. , Garrigues, L. , Ducoux‐Petit, M. et al., Label‐free quantitative proteomics reveals the dynamics of proteasome complexes composition and stoichiometry in a wide range of human cell lines. J. Proteome Res. 2014, 13, 3027–3037. [DOI] [PubMed] [Google Scholar]
- 87. van Nuland, R. , Smits, A. H. , Pallaki, P. , Jansen, P. W. et al., Quantitative dissection and stoichiometry determination of the human SET1/MLL histone methyltransferase complexes. Mol. Cell. Biol. 2013, 33, 2067–2077. [DOI] [PMC free article] [PubMed] [Google Scholar]
- 88. Brendel, J. , Stoll, B. , Lange, S. J. , Sharma, K. et al., A complex of Cas proteins 5, 6, and 7 is required for the biogenesis and stability of clustered regularly interspaced short palindromic repeats (crispr)‐derived rnas (crrnas) in Haloferax volcanii . J. Biol. Chem. 2014, 289, 7164–7177. [DOI] [PMC free article] [PubMed] [Google Scholar]
- 89. Smits, A. H. , Jansen, P. W. , Poser, I. , Hyman, A. A. , Vermeulen, M. , Stoichiometry of chromatin‐associated protein complexes revealed by label‐free quantitative mass spectrometry‐based proteomics. Nucleic Acids Res. 2013, 41, e28. [DOI] [PMC free article] [PubMed] [Google Scholar]
- 90. Arike, L. , Valgepea, K. , Peil, L. , Nahku, R. et al., Comparison and applications of label‐free absolute proteome quantification methods on Escherichia coli . J. Proteomics 2012, 75, 5437–5448. [DOI] [PubMed] [Google Scholar]
- 91. Dator, R. P. , Gaston, K. W. , Limbach, P. A. , Multiple enzymatic digestions and ion mobility separation improve quantification of bacterial ribosomal proteins by data independent acquisition liquid chromatography‐mass spectrometry. Anal. Chem. 2014, 86, 4264–4270. [DOI] [PMC free article] [PubMed] [Google Scholar]
- 92. Beynon, R. J. , Doherty, M. K. , Pratt, J. M. , Gaskell, S. J. , Multiplexed absolute quantification in proteomics using artificial QCAT proteins of concatenated signature peptides. Nat. Methods 2005, 2, 587–589. [DOI] [PubMed] [Google Scholar]
- 93. Anderson, L. , Hunter, C. L. , Quantitative mass spectrometric multiple reaction monitoring assays for major plasma proteins. Mol. Cell Proteomics 2006, 5, 573–588. [DOI] [PubMed] [Google Scholar]
- 94. Brun, V. , Dupuis, A. , Adrait, A. , Marcellin, M. et al., Isotope‐labeled protein standards: toward absolute quantitative proteomics. Mol. Cell. Proteomics 2007, 6, 2139–2149. [DOI] [PubMed] [Google Scholar]
- 95. Torizawa, T. , Shimizu, M. , Taoka, M. , Miyano, H. , Kainosho, M. , Efficient production of isotopically labeled proteins by cell‐free synthesis: a practical protocol. J. Biomol. NMR 2004, 30, 311–325. [DOI] [PubMed] [Google Scholar]
- 96. Singh, S. , Kirchner, M. , Steen, J. A. , Steen, H. , A practical guide to the FLEXIQuant method. Methods Mol. Biol. 2012, 893, 295–319. [DOI] [PubMed] [Google Scholar]
- 97. Endo, Y. , Sawasaki, T. , High‐throughput, genome‐scale protein production method based on the wheat germ cell‐free expression system. J. Struct. Funct. Genomics 2004, 5, 45–57. [DOI] [PubMed] [Google Scholar]
- 98. Zinn, N. , Winter, D. , Lehmann, W. D. , Recombinant isotope labeled and selenium quantified proteins for absolute protein quantification. Anal. Chem. 2010, 82, 2334–2340. [DOI] [PubMed] [Google Scholar]
- 99. Hanke, S. , Besir, H. , Oesterhelt, D. , Mann, M. , Absolute SILAC for accurate quantitation of proteins in complex mixtures down to the attomole level. J. Proteome Res. 2008, 7, 1118–1130. [DOI] [PubMed] [Google Scholar]
- 100. Frank, H. , Nicholson, G. J. , Bayer, E. , Enantiomer labelling, a method for the quantitative analysis of amino acids. J. Chromatogr. 1978, 167, 187–196. [DOI] [PubMed] [Google Scholar]
- 101. Austin, R. J. , Chang, D. K. , Holstein, C. A. , Lee, L. W. et al., IQcat: multiplexed protein quantification by isoelectric QconCAT. Proteomics 2012, 12, 2078–2083. [DOI] [PMC free article] [PubMed] [Google Scholar]
- 102. Mirzaei, H. , McBee, J. K. , Watts, J. , Aebersold, R. , Comparative evaluation of current peptide production platforms used in absolute quantification in proteomics. Mol. Cell. Proteomics 2008, 7, 813–823. [DOI] [PMC free article] [PubMed] [Google Scholar]
- 103. Rivers, J. , Simpson, D. M. , Robertson, D. H. , Gaskell, S. J. , Beynon, R. J. , Absolute multiplexed quantitative analysis of protein expression during muscle development using QconCAT. Mol. Cell. Proteomics 2007, 6, 1416–1427. [DOI] [PubMed] [Google Scholar]
- 104. Winter, D. , Hung, C. W. , Jaskolla, T. W. , Karas, M. , Lehmann, W. D. , Enzyme‐cleavable tandem peptides for quantitative studies in MS‐based proteomics. Proteomics 2012, 12, 3470–3474. [DOI] [PubMed] [Google Scholar]
- 105. Madin, K. , Sawasaki, T. , Kamura, N. , Takai, K. et al., Formation of circular polyribosomes in wheat germ cell‐free protein synthesis system. FEBS Lett. 2004, 562, 155–159. [DOI] [PubMed] [Google Scholar]
- 106. Pelham, H. R. , Jackson, R. J. , An efficient mRNA‐dependent translation system from reticulocyte lysates. Eur. J. Biochem. 1976, 67, 247–256. [DOI] [PubMed] [Google Scholar]
- 107. Mikami, S. , Kobayashi, T. , Masutani, M. , Yokoyama, S. , Imataka, H. , A human cell‐derived in vitro coupled transcription/translation system optimized for production of recombinant proteins. Protein Express. Purif. 2008, 62, 190–198. [DOI] [PubMed] [Google Scholar]
- 108. Shimizu, Y. , Ueda, T. , PURE technology. Methods Mol. Biol. 2010, 607, 11–21. [DOI] [PubMed] [Google Scholar]
- 109. Oda, Y. , Huang, K. , Cross, F. R. , Cowburn, D. , Chait, B. T. , Accurate quantitation of protein expression and site‐specific phosphorylation. Proc. Natl. Acad. Sci. USA 1999, 96, 6591–6596. [DOI] [PMC free article] [PubMed] [Google Scholar]
- 110. Kirchner, M. , Selbach, M. , In vivo quantitative proteome profiling: planning and evaluation of SILAC experiments. Methods Mol. Biol. 2012, 893, 175–199. [DOI] [PubMed] [Google Scholar]
- 111. Siller, E. , DeZwaan, D. C. , Anderson, J. F. , Freeman, B. C. , Barral, J. M. , Slowing bacterial translation speed enhances eukaryotic protein folding efficiency. J. Mol. Biol. 2010, 396, 1310–1318. [DOI] [PubMed] [Google Scholar]
- 112. Kimchi‐Sarfaty, C. , Oh, J. M. , Kim, I. W. , Sauna, Z. E. et al., A “silent” polymorphism in the MDR1 gene changes substrate specificity. Science 2007, 315, 525–528. [DOI] [PubMed] [Google Scholar]
- 113. Zhang, G. , Hubalewska, M. , Ignatova, Z. , Transient ribosomal attenuation coordinates protein synthesis and co‐translational folding. Nat. Struct. Mol. Biol. 2009, 16, 274–280. [DOI] [PubMed] [Google Scholar]
- 114. Tokmakov, A. A. , Kurotani, A. , Takagi, T. , Toyama, M. et al., Multiple post‐translational modifications bear upon heterologous protein synthesis. J. Biol. Chem. 2012, 287, 27106–27116. [DOI] [PMC free article] [PubMed] [Google Scholar]
- 115. Mallick, P. , Schirle, M. , Chen, S. S. , Flory, M. R. et al., Computational prediction of proteotypic peptides for quantitative proteomics. Nat. Biotechnol. 2007, 25, 125–131. [DOI] [PubMed] [Google Scholar]
- 116. Eyers, C. E. , Lawless, C. , Wedge, D. C. , Lau, K. W. et al., CONSeQuence: prediction of reference peptides for absolute quantitative proteomics using consensus machine learning approaches. Mol. Cell. Proteomics 2011, 10, (11):M110.003384. [DOI] [PMC free article] [PubMed] [Google Scholar]
- 117. Fusaro, V. A. , Mani, D. R. , Mesirov, J. P. , Carr, S. A. , Prediction of high‐responding peptides for targeted protein assays by mass spectrometry. Nat. Biotechnol. 2009, 27, 190–198. [DOI] [PMC free article] [PubMed] [Google Scholar]
- 118. Deutsch, E. W. , Lam, H. , Aebersold, R. , PeptideAtlas: a resource for target selection for emerging targeted proteomics workflows. EMBO Rep. 2008, 9, 429–434. [DOI] [PMC free article] [PubMed] [Google Scholar]
- 119. Jaquinod, M. , Trauchessec, M. , Huillet, C. , Louwagie, M. et al., Mass spectrometry‐based absolute protein quantification: PSAQ strategy makes use of “noncanonical” proteotypic peptides. Proteomics 2012, 12, 1217–1221. [DOI] [PubMed] [Google Scholar]
- 120. Proc, J. L. , Kuzyk, M. A. , Hardie, D. B. , Yang, J. et al., A quantitative study of the effects of chaotropic agents, surfactants, and solvents on the digestion efficiency of human plasma proteins by trypsin. J. Proteome Res. 2010, 9, 5422–5437. [DOI] [PMC free article] [PubMed] [Google Scholar]
- 121. Brownridge, P. , Beynon, R. J. , The importance of the digest: proteolysis and absolute quantification in proteomics. Methods 2011, 54, 351–360. [DOI] [PubMed] [Google Scholar]
- 122. Peng, M. , Taouatas, N. , Cappadona, S. , van Breukelen, B. et al., Protease bias in absolute protein quantitation. Nat. Methods 2012, 9, 524–525. [DOI] [PubMed] [Google Scholar]
- 123. Hubbard, S. J. , Beynon, R. J. , Thornton, J. M. , Assessment of conformational parameters as predictors of limited proteolytic sites in native protein structures. Protein Eng. 1998, 11, 349–359. [DOI] [PubMed] [Google Scholar]
- 124. Kazanov, M. D. , Igarashi, Y. , Eroshkin, A. M. , Cieplak, P. et al., Structural determinants of limited proteolysis. J. Proteome Res. 2011, 10, 3642–3651. [DOI] [PMC free article] [PubMed] [Google Scholar]
- 125. Keil, B. , Specificity of Proteolysis. Springer‐Verlag, Berlin/Heidelberg/New York; 1992, p. 335. [Google Scholar]
- 126. Lawless, C. , Hubbard, S. J. , Prediction of missed proteolytic cleavages for the selection of surrogate peptides for quantitative proteomics. Omics J. Integr. Biol. 2012,16, 449–456. [DOI] [PMC free article] [PubMed] [Google Scholar]
- 127. Quadroni, M. , James, P. , Proteomics and automation. Electrophoresis 1999, 20, 664–677. [DOI] [PubMed] [Google Scholar]
- 128. Glatter, T. , Ludwig, C. , Ahrne, E. , Aebersold, R. et al., Large‐scale quantitative assessment of different in‐solution protein digestion protocols reveals superior cleavage efficiency of tandem Lys‐C/trypsin proteolysis over trypsin digestion. J. Proteome Res. 2012, 11, 5145–5156. [DOI] [PubMed] [Google Scholar]
- 129. Hustoft, H. K. , Reubsaet, L. , Greibrokk, T. , Lundanes, E. , Malerod, H. , Critical assessment of accelerating trypsination methods. J. Pharm. Biomed. Anal. 2011, 56, 1069–1078. [DOI] [PubMed] [Google Scholar]
- 130. Capelo, J. L. , Carreira, R. , Diniz, M. , Fernandes, L. et al., Overview on modern approaches to speed up protein identification workflows relying on enzymatic cleavage and mass spectrometry‐based techniques. Anal. Chim. Acta. 2009, 650, 151–159. [DOI] [PubMed] [Google Scholar]
- 131. Strader, M. B. , Tabb, D. L. , Hervey, W. J. , Pan, C. , Hurst, G. B. , Efficient and specific trypsin digestion of microgram to nanogram quantities of proteins in organic‐aqueous solvent systems. Anal. Chem. 2006, 78, 125–134. [DOI] [PubMed] [Google Scholar]
- 132. Hervey, W. J. T. , Strader, M. B. , Hurst, G. B. , Comparison of digestion protocols for microgram quantities of enriched protein samples. J. Proteome Res. 2007, 6, 3054–3061. [DOI] [PubMed] [Google Scholar]
- 133. Klammer, A. A. , MacCoss, M. J. , Effects of modified digestion schemes on the identification of proteins from complex mixtures. J. Proteome Res. 2006, 5, 695–700. [DOI] [PMC free article] [PubMed] [Google Scholar]
- 134. Manning, M. C. , Chou, D. K. , Murphy, B. M. , Payne, R. W. , Katayama, D. S. , Stability of protein pharmaceuticals: an update. Pharm. Res. 2010, 27, 544–575. [DOI] [PubMed] [Google Scholar]
- 135. Goebel‐Stengel, M. , Stengel, A. , Tache, Y. , Reeve, J. R., Jr. , The importance of using the optimal plasticware and glassware in studies involving peptides. Anal. Biochem. 2011, 414, 38–46. [DOI] [PMC free article] [PubMed] [Google Scholar]
- 136. Kraut, A. , Marcellin, M. , Adrait, A. , Kuhn, L. et al., Peptide storage: are you getting the best return on your investment? Defining optimal storage conditions for proteomics samples. J. Proteome Res. 2009, 8, 3778–3785. [DOI] [PubMed] [Google Scholar]
- 137. Bark, S. J. , Hook, V. , Differential recovery of peptides from sample tubes and the reproducibility of quantitative proteomic data. J. Proteome Res. 2007, 6, 4511–4516. [DOI] [PubMed] [Google Scholar]
- 138. Picotti, P. , Aebersold, R. , Domon, B. , The implications of proteolytic background for shotgun proteomics. Mol. Cell. Proteomics 2007, 6, 1589–1598. [DOI] [PubMed] [Google Scholar]
- 139. Norrgran, J. , Williams, T. L. , Woolfitt, A. R. , Solano, M. I. et al., Optimization of digestion parameters for protein quantification. Anal. Biochem. 2009, 393, 48–55. [DOI] [PubMed] [Google Scholar]
- 140. Yang, Z. , Attygalle, A. B. , LC/MS characterization of undesired products formed during iodoacetamide derivatization of sulfhydryl groups of peptides. J. Mass Spectrom. 2007, 42, 233–243. [DOI] [PubMed] [Google Scholar]
- 141. Stark, G. R. , Reactions of cyanate with functional groups of proteins. II. Formation, decomposition, and properties of N‐carbamylimidazole. Biochemistry 1965, 4, 588–595. [DOI] [PubMed] [Google Scholar]
- 142. Arsene, C. G. , Ohlendorf, R. , Burkitt, W. , Pritchard, C. et al., Protein quantification by isotope dilution mass spectrometry of proteolytic fragments: cleavage rate and accuracy. Anal. Chem. 2008, 80, 4154–4160. [DOI] [PubMed] [Google Scholar]
- 143. Shuford, C. M. , Sederoff, R. R. , Chiang, V. L. , Muddiman, D. C. , Peptide production and decay rates affect the quantitative accuracy of protein cleavage isotope dilution mass spectrometry (PC‐IDMS). Mol. Cell. Proteomics 2012, 11, 814–823. [DOI] [PMC free article] [PubMed] [Google Scholar]
- 144. Barnidge, D. R. , Hall, G. D. , Stocker, J. L. , Muddiman, D. C. , Evaluation of a cleavable stable isotope labeled synthetic peptide for absolute protein quantification using LC‐MS/MS. J. Proteome Res. 2004, 3, 658–661. [DOI] [PubMed] [Google Scholar]
- 145. Isacoff, E. Y. , Jan, Y. N. , Jan, L. Y. , Evidence for the formation of heteromultimeric potassium channels in Xenopus oocytes. Nature 1990, 345, 530–534. [DOI] [PubMed] [Google Scholar]
- 146. Minier, F. , Sigel, E. , Techniques: use of concatenated subunits for the study of ligand‐gated ion channels. Trends Pharmacol. Sci. 2004, 25, 499–503. [DOI] [PubMed] [Google Scholar]
- 147. Sack, J. T. , Shamotienko, O. , Dolly, J. O. , How to validate a heteromeric ion channel drug target: assessing proper expression of concatenated subunits. J. Gen. Physiol. 2008, 131, 415–420. [DOI] [PMC free article] [PubMed] [Google Scholar]
- 148. MacLean, B. , Tomazela, D. M. , Shulman, N. , Chambers, M. et al., Skyline: an open source document editor for creating and analyzing targeted proteomics experiments. Bioinformatics 2010, 26, 966–968. [DOI] [PMC free article] [PubMed] [Google Scholar]