

Abstract
Tissue factor (TF) triggers the extrinsic blood coagulation cascade and is highly expressed in various types of cancer. In this study, we investigated the antitumor effect of an antibody–drug conjugate (ADC) consisting of an anti‐TF monoclonal antibody and monomethyl auristatin E (MMAE). MMAE was conjugated to an anti‐human TF or anti‐mouse TF antibody using a valine‐citrulline linker that could be potentially hydrolyzed by cathepsin B in the acidic environment of the lysosome. The cytotoxic and antitumor effects of the ADCs against four pancreatic cancer cell lines were analyzed. Both the ADC with the anti‐human TF antibody and that with the anti‐mouse TF antibody were stable under physiological conditions. The anti‐human ADC was internalized in TF‐expressing human tumor cell lines, followed by effective MMAE release. The half maximal inhibitory concentration (IC50) of MMAE was approximately 1 nM for all of the cell lines used. Meanwhile, the IC50 of anti‐human ADC was 1.15 nM in the cell lines showing high TF expression, while exceeding 100 nM in the cells showing low TF expression levels. Anti‐human ADC with passive and active targeting ability exerted significant suppression of tumor growth as compared to that observed in the saline group (p < 0.01). Also significant tumor growth suppressions were seen at the anti‐mouse ADC and control ADC groups compared to the saline group (p < 0.01) due to EPR effect. Because various clinical human cancers express highly amount of TF, this new anti‐TF ADC may deserve a clinical evaluation.
Keywords: antibody drug conjugate, tissue factor, pancreatic cancer, dual targeting, DDS
Short abstract
What's new?
Tissue factor (TF) triggers normal blood coagulation, and is also highly expressed in various types of tumor, including pancreatic, malignant glioma, and gastric cancer. In this study, the authors developed a new antibody‐drug conjugate (ADC) consisting of an anti‐TF monoclonal antibody linked to monomethyl auristatin E (MMAE). The ADC accumulated selectively within tumors, and caused significant suppression of tumor growth in vivo. Because it penetrates tumors via their leaky vasculature, but is too large to pass through normal vessel walls, this ADC may provide a promising therapeutic strategy.
Abbreviations
- ADC
antibody–drug conjugate
- ARDS
acute respiratory distress syndrome
- BSA
bovine serum albumin
- CAST
cancer stromal target
- CBB
Coomassie brilliant blue
- DAPI
4′6‐diamidino‐2‐phenylindole‐2HCl
- DDS
drug delivery system
- DTNB
5,5′‐dithiobis(2‐nitrobenzoic acid)
- DW
distilled water
- EDTA
ethylenediaminetetraacetic acid
- EPR
enhanced permeability and retention
- GEM
gemcitabine
- HPLC
high‐performance liquid chromatography
- mAb
monoclonal antibody
- MMAE
monomethyl auristatin E
- PABC
para‐amino benzyl carbamate
- PBS
phosphate‐buffered saline
- PI
propidium iodide
- PVDF
polyvinylidene fluoride
- RU
resonance units
- SD
standard deviation
- SDS
sodium dodecyl sulfate
- SPR
surface plasmon resonance
- STR
short tandem repeat
- TBS
tris‐buffered saline
- TF
tissue factor
Pancreatic cancer is one of the major malignancies in the world. Almost three‐fourth of the patients with pancreatic cancer are diagnosed at an advanced stage with lymph node or distant metastases, while the percentage of patients with localized pancreatic cancer at diagnosis is <10%.1 The 5‐year survival rate for all cases of pancreatic cancer is only 6%; moreover, the 5‐year survival rate for pancreatic cancer is less than 40% even if the cancer is diagnosed at a localized stage.1, 2 Because pancreatic cancer usually cannot be cured by surgery alone, an effective chemotherapy regimen is important. Gemcitabine (GEM) is a key drug in the treatment of pancreatic cancer.3 Several combination therapies based on GEM have been studied in several clinical trials, but the data were far from satisfactory.4, 5, 6
The association between cancer and thrombosis was first reported in the nineteenth century by the clinicians Trousseau7 and Billroth.8 To date, several basic studies have indicated the involvement of blood coagulation in tumor progress.9, 10 Clinical evidence also shows that patients with cancer have twice the incidence of venous thromboembolism, pulmonary embolism and deep venous thrombosis as patients without cancer.11 Cancer cells can produce procoagulant molecules to activate blood coagulation, and one of the well‐characterized procoagulants associated with cancer is tissue factor (TF).12 TF is 47‐kDa single chain transmembrane glycoprotein consisting of 263 amino acids,13 and it acts as both a surface receptor and cofactor for the activated coagulation protease factor VII (VIIa). Upon binding of factor VIIa to TF, the extrinsic blood coagulation pathway is initiated with the downstream generation of activated coagulation serine proteases, factor Xa and factor IIa (thrombin). TF is highly expressed in various kinds of tumors especially pancreatic cancer, malignant glioma and gastric cancer.14 TF is also highly expressed in normal tissues such as epidermis of skin, mucosa of gut and myocardium of heart,15 because TF presence throughout the body is reasonable to stop the bleeding at any place following vascular injury. Meanwhile, TF is rarely or weakly expressed in various kinds of normal cells including endothelial cells of normal vessels and ductal cells of pancreas which are origin of pancreatic ductal adenocarcinoma.16 Although TF is rarely expressed in normal tissue, monocytes and endothelial cells, which are stimulated under the inflammatory or cancerous conditions, can be induced to synthesize and express TF on their membranes in addition to cancer cells.17
Antibody–drug conjugates (ADCs) were reported as a cancer therapeutic in late 1980s. However, there were several issues that needed to be resolved, such as the immunogenicity of antibodies, the low toxicity of the payloads and unstable linkers in the blood stream.18, 19 The antibodies should target a cancer‐specific antigen that is expressed on the cellular membrane and be internalized into the cancer cells by an endosome. The drugs should be a high potential cytotoxic agent, and the linkers should be stable in the plasma and should release the drugs in its active form.20 Macromolecules including high molecular protein and nanoparticles are too large to pass through the normal vessel walls but can extravasate through a gap in the tumor vessels and be retained in the tumor tissue based on the enhanced permeability and retention (EPR) effect.21 The particle size of the ADC is almost 10 nm, and the ADC thus both passively and actively targets cancer tissue.
From the standpoint of a drug delivery system (DDS), an ADC is a promising strategy because of its size, stability and selective targeting of cancer cells. As for the ADCs that specifically use an anti‐TF antibody, the ADCs may possibly target both the tumor cells and the tumor vascular endothelium. Therefore, this present study investigates the antitumor effect of an ADC that consists of an anti‐human and ‐mouse TF monoclonal antibody (mAb) conjugated to monomethyl auristatin E (MMAE).
Material and Methods
Human pancreatic cancer cell lines
The human pancreatic cancer cell lines BxPC‐3, Capan‐1, Panc‐1 and PSN‐1 were obtained from the American Type Culture Collection (ATCC, Manassas, VA). All cell lines were authenticated by short tandem repeat (STR) DNA profiling in 2014 by JCRB Cell Bank (Osaka, Japan). Cells were maintained at 37°C in a humidified atmosphere with 5% CO2 and grown in an RPMI‐1640 (Wako, Osaka, Japan) medium containing 10% fetal bovine serum (FBS, Gibco, Grand Island, NY), 100 U/mL penicillin, 100 μg/mL streptomycin and 0.25 μg/mL amphotericin B (Wako).
TF copy number in human pancreatic cancer cell lines
TF copy number was calculated by quantitative real‐time reverse transcription‐polymerase chain reaction (RT‐PCR). Total RNA was extracted from the cells using an RNeasy mini kit (Qiagen, Valencia, CA) and complementary DNA (cDNA) was synthesized using a ReverTra Ace (Toyobo, Osaka, Japan) in accordance with the manufacturer's instructions. Briefly, each cell was dissolved in 1 ml of QIAzol (Qiagen). Thereafter, 200 μL of chloroform was added, the mixture was vortexed vigorously for 15 sec and incubated for 3 min at room temperature, and then centrifuged at 13,000g for 15 min at 4°C. The upper aqueous phase was transferred to a 1.5‐ml tube, and same volume of 70% ethanol was added. The solution was mixed thoroughly by pipetting and transferred to an RNeasy spin column, and the columns were centrifuged at 7,000g for 15 sec at room temperature. After washing, total RNA was eluted in RNase‐free water (1 × 10⁵ cells/μL). The cDNA synthesis mixture consisted of 1 μL of total RNA, 2 μL of RT buffer, 0.5 μL of RT enzyme mix, 0.5 μL of Primer mix and 6 μL of distilled water (DW) was incubated at 37°C for 15 min and 98°C for 5 min. The reaction mixture for the real‐time PCR analysis was consisted of 1 μL of a template cDNA, 10 μL of TaqMan Fast Universal PCR Master Mix (Applied Biosystems) and 1 μL of 20 × primer/probe mixture in a total reaction volume of 20 μL. Real‐time PCR was performed with precycling heat activation at 95°C for 20 sec, followed by 40 cycles of denaturation at 95°C for 3 sec, and annealing/extension at 60°C for 30 sec, in an Applied Biosystems 7500 Fast Real‐Time PCR System (Applied Biosystems). Several concentrations of plasmid DNA cloned with human TF gene were used for standard curve.
Anti‐TF antibodies, linkers, cytotoxic drugs and ADC
Extracellular domains of human or mouse TF without a signal peptide were cloned into the pET21b(+) vector (Merck‐Millipore, Darmstadt, Germany), and purified human or mouse TF proteins were obtained after transfection of the expression vectors into DH5α cells (Toyobo). The anti‐human TF mAb‐producing hybridoma (clone 1849) and the anti‐mouse TF mAb‐producing hybridoma (clone 1157) were established in our laboratory from rats that were immunized with a purified human or mouse TF protein, respectively.22 Control mAb (clone 372) which recognized neither human TF nor mouse TF was also established in our laboratory. The linker and the drug was composed of a maleimide that serves as the connection to the mAb, Mal‐PEG12‐OSu (Quanta Biodesign, San Diego, CA) to increase polarity, a valine‐citrulline (Val‐Cit) dipeptide to trigger cleavage by intracellular proteases, a para‐amino benzyl carbamate (PABC) that functions as a self‐immolative spacer to release the drug efficiently and the drug payload MMAE (MedChem Express, Prinston, NJ). To connect the mAb to the linker, interchain disulfides of the mAb were reduced with 1 mM DTT (Sigma, St. Louis, MO) at 26°C for 30 min. The number of free thiols was quantified with 5,5′‐dithiobis(2‐nitrobenzoic acid) (DTNB, Sigma). To conjugate to the maleimide‐linker‐MMAE prodrug, reduced mAbs were then incubated in a phosphate‐buffered saline (PBS) solution containing 5 mM ethylenediaminetetraacetic acid (EDTA, pH 6.4) first at room temperature for 1 hr and then at 4°C overnight. The concentrations of the anti‐human TF mAb conjugated with MMAE (anti‐human ADC), the anti‐mouse TF mAb conjugated with MMAE (anti‐mouse ADC) and control mAb conjugated with MMAE (control ADC) were measured using a NanoDrop ND‐1000 spectrometer (ThermoFisher Scientific, Wilmington, DE). The numbers of residual thiols were quantified with DTNB. The drug (MMAE)/antibody ratio was determined by comparing the numbers of free and residual thiols.
Biochemical characteristics of anti‐TF mAb or ADC
The sizes of anti‐TF mAbs (including anti‐human and mouse TF mAbs) and ADCs (including anti‐human and ‐mouse ADCs) were measured using the DelsaNano HC particle analyzer (Beckman Coulter, Brea, CA) according to the manufacturer's instruction. To analyze the molecular weight, 5 μg of anti‐TF mAb and ADC denatured in a 1% sodium dodecyl sulfate (SDS) buffer were electrophoresed in a polyacrylamide gel (SDS‐PAGE). The proteins were then transferred to a polyvinylidene fluoride (PVDF) membrane, and the membrane was stained by Coomassie brilliant blue (CBB).
To investigate the in vitro release behavior of the MMAE from the ADC, the ADC was incubated for 0, 3, 6, 24 and 48 hr at 37°C in either a tris‐buffered saline (TBS, pH 7.5) or a TBS (pH 4.0) solution added with 0.1 mg/mL cathepsin B (Sigma). The samples were filtered through the Ultrafree‐MC centrifugal filter devices (Millipore). Reverse‐phase high‐performance liquid chromatography (HPLC) was conducted on a Capcell Pac C18 AQ column (4.6 mm × 100 mm; Shiseido, Tokyo, Japan). The samples were then injected into a Nexera HPLC system (Shimadzu, Kyoto, Japan). The detector was set at 227 nm for MMAE.
The interactions between the mAbs and the TF proteins were analyzed with a Biacore T200 surface plasmon resonance (SPR) sensor (GE Healthcare, Uppsala, Sweden) according to the manufacturer's instruction. Ten resonance units (RU) of the purified TF protein were immobilized onto the sensor surface of a Biacore sensor chip CM5 (GE Healthcare). The 3–24 μg/mL (20–160 nM) concentrations of the mAbs were then flowed through the sensor chip. The interactions between the ADCs and the TF protein were analyzed by the same method. The affinity (KD) was calculated using following formula: KD = Kd/Ka, where Kd stands for the dissociation rate constant and Ka for the association rate constant.
The affinity and internalization of anti‐TF mAbs and ADCs for various cells
To analyze the affinity and internalization of the anti‐TF mAbs and ADCs, the mAbs and ADCs were directly conjugated with Alexa647 using a monoclonal antibody labeling kit (Invitrogen) according to manufacturer's instruction. The affinities of the mAbs and the ADCs against pancreatic cancer cells were analyzed by flow cytometry. Inside a 2 ml tubes, 2 × 10⁵ harvested cells were incubated with 0.2 μg of each Alexa647‐conjugated mAbs and ADCs for 30 min at 4°C. After washing with PBS containing 0.5% bovine serum albumin (BSA) and 2 mM EDTA (B. E. PBS), the cells were nuclear stained with a propidium iodide (PI) solution (Invitrogen, Eugene, OR). The stained cells were analyzed by flow cytometry using Guava easyCyte (Millipore, Billerica, MA).
To analyze the internalization of the anti‐TF ADC into cancer cells, 3 × 10³ cells of BxPC‐3 were pre‐cultured in flat‐bottomed 96‐well tissue culture plates (Corning, Corning, NY) overnight. Then, 0.2 μg of Alexa647‐conjugated ADC were added to the cells and incubated at 37°C for 0 and 3 hr. To identify the lysosomes, the cells were also incubated for 1 hr with 50 nM of LysoTracher (Invitrogen). After rinsing with PBS, the cells were fixed with 4% paraformaldehyde (Wako) for 10 min and then nuclear stained with a 4′6‐diamidino‐2‐phenylindole‐2HCl (DAPI) solution (Roche, Basel, Switzerland).
In vitro cytocidal effect
After pre‐culturing 3 × 10³ cells of several pancreatic cancer cell lines in 96‐well plates (Corning) and draining off the growth medium, the cells were then incubated in a growth medium containing varying concentrations of anti‐human ADC, anti‐mouse ADC, and MMAE for 72 hr at 37°C. The cell viability was analyzed using the Cell Counting Kit‐8 (Dojindo, Kumamoto, Japan) according to manufacturer's instruction.
Experimental mice model
Six‐week‐old female BALB/c nude mice (Charles River Laboratories Japan, Yokohama, Japan) were used in this study. The animals were maintained in cages under specific pathogen‐free conditions, provided with standard food, and given free access to sterilized water. All animal procedures were carried out in compliance with the Guidelines for the Care and Use of Experimental Animals established by the Committee for Animal Experimentation from the National Cancer Center, Japan. These guidelines meet the ethical standards required by law and also comply with the guidelines for the use of experimental animals in Japan.
Anesthetized mice were subcutaneously inoculated with 1 × 10⁷ BxPC‐3 or Capan‐1 cells suspended in 100 μL of PBS on the right back. The mice were used in several experiments when the tumor volume reached approximately 200 mm3. The tumor volume (TV) was calculated with the following formula using the length (L) and width (W) of the subcutaneous tumor: TV = (L × W 2)/2.
The distribution and localization of the ADCs in the tumor tissue
To evaluate the distribution of the ADCs in the tumor tissue, 100 μg (5 mg/kg) of Alexa647‐conjugated anti‐human, anti‐mouse TF and control ADC were injected intravenously into the tail vein. The biodistributions of the ADCs were analyzed by in vivo imaging system OV‐110 (Olympus, Tokyo, Japan) up to 7 days after injection.
To evaluate the localization of the ADCs in the tumor tissue, 300 μg (15 mg/kg) of Alexa647‐conjugated anti‐human, anti‐mouse TF and control ADC were injected intravenously into the tail vein. Twenty‐four hours after the injection, the tumor was excised from the mice under deep anesthesia. The tumor tissues were embedded in an OCT compound (Sakura Finetek, Tokyo, Japan) and quickly frozen in liquid nitrogen. For immunohistochemical analysis, 10‐μm‐thick frozen sections were prepared using a Tissue Tek Cryo3 (Sakura Finetek) and fixed with 4% paraformaldehyde in PBS (Wako) for 30 min at 4°C. After blocking, the sections were incubated with an anti‐CD31 goat antibody for endothelial cells (2 μg/mL; R&D Systems, Minneapolis, MN) for 1 hr at room temperature. After washing with PBS, the sections were incubated with an Alexa488‐conjugated donkey anti‐goat IgG secondary antibody (1 μg/mL; Invitrogen) for 30 min at room temperature and nuclear stained with a DAPI solution.
In vivo growth inhibition assay
To evaluate tumor growth inhibition, the mice were randomly divided into several treatment groups consisting of five mice per group (Day 0). ADCs, mAbs and saline (0.9% NaCl solution) were administered intravenously on Days 0, 4 and 8. The anti‐human ADC was administered at 1, 5, 10 or 20 mg/kg/day in the first experiment. Anti‐human ADC, anti‐mouse ADC, control ADC, anti‐human TF mAb, anti‐mouse TF mAb and control mAb were administered at 20 mg/kg/day in the second experiment. The saline was administered as an untreated control. Tumor volume and body weight were measured twice a week.
Statistical analysis
All data are expressed as the mean ± standard deviation (SD). The tumor growth inhibition assay was analyzed by a two‐sided Dunnett t test. Statistical analyses were performed using SPSS Statistics Ver. 19 (IBM, Armonk, NY). p < 0.05 was considered statistically significant.
Results
Structure of the ADC and biochemical characteristics of the anti‐TF mAb and ADC
The structure of the ADC had a maleimide connecting the linker and the drug to the mAb, PEG12 for polarity, a Val‐Cit dipeptide to trigger cleavage by lysosomal proteases, a PABC as a self‐immolative spacer to efficiently release the drug payload MMAE (Fig. 1 a). Approximately three molecules of MMAE were conjugated to each anti‐human TF, ‐mouse TF mAb or control mAb. Mean sizes of the hTF and mTF mAbs were 9.5 nm ± 2.3 nm (mean ± SD) and 7.6 nm ± 2.6 nm, respectively (Fig. 1 b). Meanwhile, mean sizes of the anti‐human and anti‐mouse ADCs were 12.0 nm ± 3.1 nm (mean ± SD) and 12.6 nm ± 2.8 nm, respectively. Molecular weights (MW) of the mAbs and ADCs were approximately 150 kDa (Fig. 1 c). The ADCs were partially digested to a smaller size by DTT reduction. The percentage of free MMAEs released from the anti‐human ADC and the anti‐mouse ADC in an acidic buffer with cathepsin B at 37°C in 24 hr was 72.2% or 70.8%, respectively (Fig. 1 d). Meanwhile, no free MMAE was released from the ADCs in a neutral buffer without cathepsin B at 37°C for up to 48 hr. While the ADCs were stable under physiological conditions without cathepsin B, free MMAEs were sufficiently released from the ADCs under an acidic condition with cathepsin B. The association rate constants (Ka) of the anti‐human TF mAb and the anti‐human ADC to the hTF protein were 4.20 × 10⁵ M− 1 S− 1 and 1.53 × 10⁴ M− 1 S− 1, respectively, while the dissociation rate constants (Kd) were 3.84 × 10⁻⁵ S− 1 and 4.83 × 10⁻⁵ S− 1, respectively (Table 1). The affinities (KD) of the anti‐human TF mAb and the anti‐human ADC to the hTF protein were therefore 9.14 × 10⁻¹¹ M and 3.16 × 10⁻⁹ M, respectively. Meanwhile, the Ka of the anti‐mouse TF mAb and the anti‐mouse ADC to mTF protein were 1.19 × 10⁴ M− 1 S− 1 and 1.44 × 10⁴ M− 1 S− 1, respectively, and the Kd were 4.60 × 10⁻⁵ S− 1 and 4.57 × 10⁻⁵ S− 1, respectively. The KD of the anti‐mouse TF mAb and the anti‐mouse ADC to the mTF protein were therefore 3.85 × 10⁻⁹ M and 3.18 × 10⁻⁹ M, respectively. Control mAb and control ADC did not react to both human and mouse TF proteins.
Figure 1.
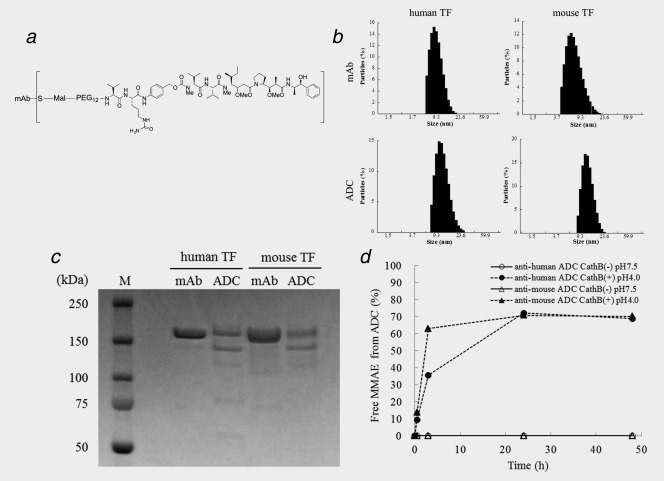
Preparation and characterization of ADCs. (a) Structure of ADC. Approximately three molecules of MMAE were conjugated to one antibody by a valine‐citrulline dipeptide linker. (b) Particle size of mAbs and ADCs. The mean particle sizes of mAbs were 9.5 nm (anti‐human mAb) and 7.6 nm (anti‐mouse mAb) and the mean particle sizes of ADCs were 12.0 nm (anti‐human ADC) and 12.6 nm (anti‐mouse ADC). (c) SDS‐PAGE of mAbs and ADCs. M: molecular markers. D) Releasing of MMAE from ADCs. The rates of free MMAE released from the anti‐human and ‐mouse ADCs in an acidic buffer with cathepsin B at 37 °C for 24 hr was 72.2% and 70.8%, respectively. None of the free MMAE was released from both the anti‐human and ‐mouse ADCs in a neutral buffer without cathepsin B at 37 °C for up to 48 hr.
Table 1.
Intramolecular interaction of anti‐TF mAb and ADC
| Human TF | Mouse TF | |||||
|---|---|---|---|---|---|---|
| Samples | Ka (M− 1 S− 1) | Kd (S− 1) | KD (M) | Ka (M− 1 S− 1) | Kd (S− 1) | KD (M) |
| Anti‐human TF mAb | 4.20 × 10⁵ | 3.84 × 10⁻⁵ | 9.14 × 10⁻¹¹ | N/A | N/A | N/A |
| Anti‐human ADC | 1.53 × 10⁴ | 4.83 × 10⁻⁵ | 3.16 × 10⁻⁹ | N/A | N/A | N/A |
| Anti‐mouse TF mAb | N/A | N/A | N/A | 1.19 × 10⁴ | 4.60 × 10⁻⁵ | 3.85 × 10⁻⁹ |
| Anti‐mouse ADC | N/A | N/A | N/A | 1.44 × 10⁴ | 4.57 × 10⁻⁵ | 3.18 × 10⁻⁹ |
| Control mAb | N/A | N/A | N/A | N/A | N/A | N/A |
| Control ADC | N/A | N/A | N/A | N/A | N/A | N/A |
TF: tissue factor, mAb: monoclonal antibody, ADC: antibody drug conjugate, Ka: association rate constant, Kd: dissociation rate constant, KD: affinity, N/A: not applicable.
The affinity and internalization of mAbs and the ADCs by various cells
hTF copy number calculated by real‐time RT‐PCR in BxPC‐3, PSN‐1, Capan‐1 and Panc‐1 cells was 1114.8 copies/cell, 91.9 copies/cell, 10.2 copies/cell and 4.3 copies/cell, respectively (Table 2). TF protein expressions on the surface of the pancreatic cancer cell lines were also analyzed by a flow cyotometry (Fig. 2 a). Relative TF expression in BxPC‐3, PSN‐1, Capan‐1 and Panc‐1, normalized by a negative control, were 244.2, 45.2, 7.8 and 3.7, respectively. The BxPC‐3 cell line was therefore used as cells with a high TF expression, PSN‐1 was used as cells with a moderate TF expression, and Capan‐1 and Panc‐1 were the cells with low TF expression. The affinities of the mAbs or ADCs to BxPC‐3 cells were analyzed by a flow cyotometry (Fig. 2 b). Anti‐human TF mAb and anti‐human ADC were reacted to BxPC‐3 cells. However, anti‐mouse TF mAb, anti‐mouse ADC, control mAb and control ADC did not recognize the human cells. Although anti‐human TF mAb was located in cell surface membrane at 0 hr incubation, the mAb was sufficiently internalized into the cytoplasm after 3 hr incubation at 37°C and colocalized with the lysosome (Fig. 2 c).
Table 2.
IC50 values of MMAE, anti‐human ADC and anti‐mouse ADC in various human pancreatic cancer cell lines
| Cell lines | TF expression (copies/cell) | MMAE (nM) | MMAE in anti‐human ADC (nM) | MMAE in anti‐mouse ADC (nM) |
|---|---|---|---|---|
| BxPC‐3 | 1114.8 | 0.97 ± 0.10 | 1.15 ± 0.47 | N/A |
| PSN‐1 | 91.9 | 0.99 ± 0.09 | 15.53 ± 2.39 | N/A |
| Capan‐1 | 10.2 | 1.10 ± 0.44 | 105.65 ± 37.43 | 165.24 ± 28.00 |
| Panc‐1 | 4.3 | 1.16 ± 0.49 | N/A | N/A |
IC50: half maximal inhibitory concentration, TF: tissue factor, MMAE: monomethyl auristatin E, ADC: antibody drug conjugate, MMAE in anti‐human ADC: MMAE concentration of anti‐human ADC, MMAE in anti‐mouse ADC: MMAE concentration of anti‐mouse ADC, N/A: not applicable.
All of the IC50 data were analyzed in quadruplicate and shown as the mean ± standard deviation.
Figure 2.
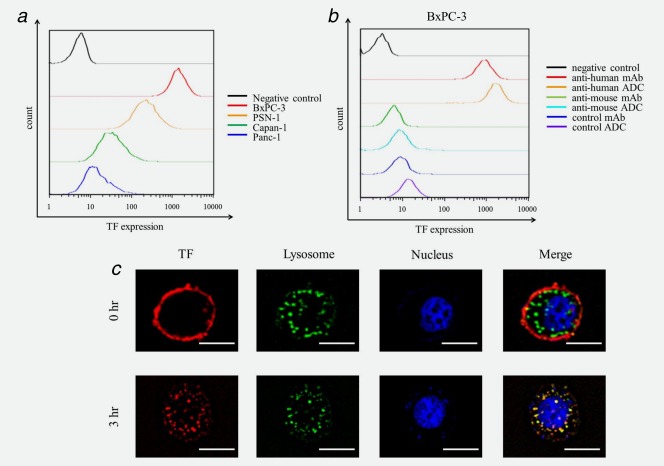
Affinity and Internalization of ADCs. (a) TF expression in the four human pancreatic cancer cell lines. Relative TF expression in BxPC‐3, PSN‐1, Capan‐1 and Panc‐1, normalized by a negative control, were 244.2, 45.2, 7.8 and 3.7, respectively, thus showing that BxPC‐3 cells had a high TF expression, PSN‐1 had a moderate TF expression and Capan‐1 and Panc‐1 had low TF expression. (b) Affinity of mAbs and ADCs to pancreatic cancer cells. Anti‐human mAb and anti‐human ADC were reacted to BxPC‐3 cells. Meanwhile anti‐mouse mAb, anti‐mouse ADC, control mAb and control ADC did not recognize human cells. (c) Internalization of ADC. The anti‐human ADC was sufficiently internalized into the cytoplasm after a 3‐hr incubation at 37°C and localized in a lysosome. Anti‐human ADC and lysosomes were indicated red and green, respectively. Colocalization of anti‐human ADC and lysosomes was merged as yellow. Scale bar represents 10 μm.
In vitro cytotoxicity of MMAE and ADC
The half maximal inhibitory concentration (IC50) of MMAE for BxPC‐3, PSN‐1, Capan‐1 and Panc‐1 were 0.97 nM ± 0.10 nM (mean ± SD), 0.99 nM ± 0.09 nM, 1.10 nM ± 0.44 nM and 1.16 nM ± 0.49 nM, respectively (Table 2). The IC50 of MMAE for each cell line was almost equal. Meanwhile, the IC50 of the anti‐human ADC for BxPC‐3, PSN‐1 and Capan‐1 were 1.15 nM ± 0.47 nM, 15.53 nM ± 2.39 nM and 105.65 nM ± 37.43 nM (at the MMAE equivalent dose), respectively. The IC50 of the anti‐human ADC for Panc‐1 was not calculated because cell inhibitory rate of 200 nM of the anti‐human ADC did not reached 50%. Cytocidal effects of the anti‐human ADC for these cells appeared to depend on the cell surface TF expression levels. The IC50 of the anti‐mouse ADC for all of these cell lines, except of Capan‐1, were not calculated because cell inhibitory rate of 200 nM of the anti‐mouse ADC did not reached 50%.
Drug localization and antitumor effect in vivo
Anti‐human ADC, anti‐mouse ADC and control ADC were accumulated in the BxPC‐3 tumor by EPR effect (passive targeting) at 3 days after injection (Fig. 3 a). At seven days after injection, only anti‐human ADC was sustained in the tumor by specific conjugation (active targeting). In the immunohistochemical section, the anti‐human ADC extravasated from the tumor vessels and was localized at periphery of the BxPC‐3 tumor lesion (Fig. 3 b). The ADC did not reach the center of the tumor. By contrast, the anti‐mouse ADC and control ADC were localized in the cancer stroma.
Figure 3.
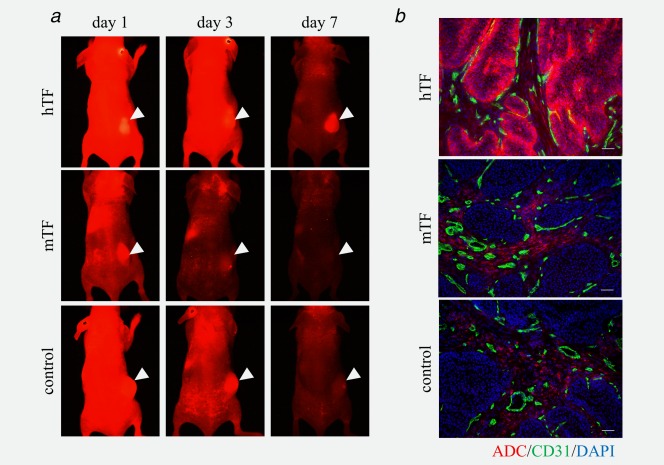
Distribution and localization of ADCs in the BxPC‐3 xenograft tumors. (a) In vivo imaging of ADCs in BxPC‐3 tumor. All ADCs were accumulated in the BxPC‐3 tumor by EPR effect (passive targeting) at 3 days after injection. Only anti‐human ADC was sustained in the tumor by specific conjugation (active targeting) at 7 days after injection. Arrow heads indicated subcutaneous tumors. (b) Localization of the ADCs in the BxPC‐3 tumor. The anti‐human ADC extravasated from the tumor vessels and was localized at the periphery of the tumor lesion and did not sufficiently reach the center of the tumor. Meanwhile the anti‐mouse ADC and control ADC were localized in the cancer stroma. The ADCs, endothelial cells and nucleus were indicated red, green and blue, respectively. Scale bar represents 100 μm.
The BxPC‐3 tumor growth in the two groups treated with 10 mg/kg or 20 mg/kg of anti‐human ADC were significantly suppressed compared with that in the saline group after Day 14 or Day 11, respectively (p < 0.01; Fig. 4 a). There was no significant difference between the groups treated with 1 mg/kg, 5 mg/kg of anti‐human ADC and saline. In the second treatment, the BxPC‐3 tumor growth in the 20 mg/kg of anti‐human ADC (p < 0.01; after Day 14), 20 mg/kg of anti‐mouse ADC (p < 0.01; after Day 18) or 20 mg/kg of control ADC (p < 0.01; after Day 14) treatment groups were significantly suppressed compared with that in the saline group (Fig. 4 c). There was no significant difference between the group using 20 mg/kg of mAbs and the saline group. Also the BxPC‐3 tumor growth in the anti‐human ADC treatment group was significantly suppressed compared with that in the anti‐mouse ADC group (p < 0.01; after Day 18) and control ADC group (p < 0.05; after Day 18). On the other hand, the Capan‐1 tumor growth in the 20 mg/kg of anti‐human ADC (p < 0.05; after Day 7) and anti‐mouse ADC (p < 0.05; after Day 7) treatment groups were significantly suppressed compared with that in the saline group (Fig. 4 e). Body weight loss was not seen in any of the treatment groups (Figs. 4 b, 4 d and 4 f).
Figure 4.

The antitumor effect and body weight change in mice bearing BxPC‐3 tumor xenografts. (a) Changes in the BxPC‐3 tumor volume in anti‐human ADC dose escalation experiment (N = 7 for each group). Tumor growth in the two groups treated with either 10 mg/kg or 20 mg/kg of anti‐human ADC were significantly suppressed compared with that in the saline group (p < 0.01). (b) Body weight loss was not seen in all the treatment groups in anti‐human ADC dose escalation experiment. (c) Changes in the BxPC‐3 tumor volume by the treatment of several mAbs and ADCs (N = 7 for each group). Tumor growth in the three groups treated with either 20 mg/kg of anti‐human ADC, 20 mg/kg of anti‐mouse ADC or 20 mg/kg of control ADC were significantly suppressed compared with that in the saline group (p < 0.01). (d) Body weight loss was not seen in all the treatment groups. (e) Changes in the Capan‐1 tumor volume (N = 4 for each group). Tumor growth in the 20 mg/kg of anti‐human ADC (p < 0.001) and anti‐mouse ADC (p = 0.001) treatment groups were significantly suppressed compared with that in the saline group. (f) Body weight loss was not seen in all the treatment groups.
Discussion
The mAbs employed in ADCs should possess both a high affinity for the TF antigen and high internalization ability for the target cells. In this study, the affinities (KD) of the anti‐human and ‐mouse TF mAbs were 9.14 × 10⁻¹¹ M and 3.85 × 10⁻⁹ M, respectively. On the other hand, KD of anti‐human ADC and ‐mouse ADC were 3.16 × 10⁻⁹ M and 3.18 × 10⁻⁹ M, respectively. To establish ADC, mAbs were reduced by DTT; thus, Ka of anti‐human ADC might be decreased compared with anti‐human TF mAb. This decreasing affinity was seen only for anti‐human TF mAb (clone 1849) not for anti‐mouse TF mAb (clone 1157) and it might be clone specific reaction. However, KD of anti‐human ADC was still high for cancer cell targeting treatment. Also, the internalization ability of the anti‐TF mAbs was evident. Regarding the linker construction, the val‐cit linker has been reported to be stable in human and mouse plasma and cleaved efficiently by cathepsin B in acidic conditions, such as inside the lysosome of cells.23 Similar to the previous study, the linker constructed by us was stable under physiological conditions and cleaved by cathepsin B in an acidic condition. Also, PEG12 was used for stealth effect to escape from the reticuloendothelial system of the liver and spleen. Lastly, MMAE, which was chosen as the payload in this study, could suppress cell growth via inhibition of microtubulin. The effective concentration of this drug for the inhibition of cancer cell growth was less than 1 nM, which means that an unrealistically amount of the ADC is not necessary for the treatment.24 The actual values of the IC50 of MMAE in the four pancreatic cancer cell lines were ranged from 0.97 nM to 1.16 nM. Although the IC50 of MMAE in these four pancreatic cancer cell lines were almost same, the low TF‐expressing cells (Capan‐1 and Panc‐1) were more resistant to the anti‐human ADC compared with the high TF‐expressing cells (BxPC‐3). This result indicated that TF expression levels should be analyzed before the application of the ADC.
The size of the ADC was approximately 10 nm which was almost equal to the size of mAb. High molecular weight drugs that range from 10 nm to 1,000 nm in size can use passive targeting via the EPR effect.21 Indeed, the anti‐human ADC can extravasate from tumor vessels, reaching through the cancer stromal barrier to periphery of the tumor tissues, and can be retained up to 1 week by active targeting. Likely due to the high affinity of the ADC for tumor tissues, anti‐human ADC that reached the periphery of the tumor lesion became trapped in the outer regions of the tumor and could not penetrate into the center of tumor lesion. An effective antitumor effect was, however, still observed. Mechanism of the cytotoxic action of the ADC is considered to be both a result of direct and bystander effects.25 The active form of MMAE (free MMAE) could be released from the anti‐human ADC in peripheral cancer cells, and this small molecule could penetrate into the center of tumor. The anti‐human ADC, therefore, had an effective antitumor effect.
Meanwhile, the anti‐mouse ADC and control ADC were located in the cancer stroma. Although the anti‐mouse ADC might be captured by the cancer stroma cells or extracellular components of tumor stroma, control ADC was also located in the cancer stroma due to EPR effect. In the human cancer tissue, the hTF was highly expressed in cancer stromal cells, such as fibroblasts, pericytes and endothelial cells of tumor vessels, and inflammatory cells.17 Unexpectedly, the expressions of mTF in the cancer stroma cells were not very high in the experimental subcutaneous tumor model using human cancer cells. Indeed, the biodistribution, location and antitumor effect using the anti‐mouse ADC and control ADC were almost same probably based on EPR effect.
We previously reported that the clone 1849 could inhibit both the cell signal pathway via PAR2 and the blood coagulation cascade via factor VII.22 The antitumor effect of the anti‐human TF mAb used in this study was not effective compared to that of saline group, thus, this might be a result of the cytotoxic drug MMAE not a result of the direct effect of the mAb clone 1849. Similar result was observed in a phase 3 trial of the trastuzumab emtansine (T‐DM1).26 The patients enrolled in the phase 3 trial were previously treated with a taxane and trastuzumab. One of the causes of resistance to trastuzumab is the active mutation of PIK3CA. In the EMILIA trial, PIK3CA mutations were associated with shorter median progression‐free survival in the lapatinib plus capecitabine treatment group; however, PIK3CA mutations did not significantly affect the T‐DM1 treatment group. These data indicate that the antibody component of the ADC was used as a drug carrier regardless of its own antitumor effect.
More recently, the ADC conjugated with anti‐human TF mAb in several solid tumors was reported.27 On the other hand, in this study, we investigated the antitumor activity of ADC conjugated with not only anti‐human TF mAb but also anti‐mouse TF mAb. Recently, we reported a cancer stromal target (CAST) therapy consisted of the anticancer drug and mAb against cancer stroma, such as collagen IV or insoluble fibrin.28, 29, 30 The anti‐mouse ADC used in this study was also categorized by the CAST therapy because the anti‐mouse ADC appeared to damage the host tumor vessels located in the tumor stroma. We think that the anti‐TF ADC may become a dual targeting drug in human use because of the present clear evidence that anti‐human ADC could damage cancer cells and anti‐mouse ADC could damage tumor vessels in the cancer stroma.
Acknowledgements
The authors thank Ms. Misato Kanzaki for her technical assistance and Ms. Kaoru Shiina for her secretarial assistance.
References
- 1. Siegel R, Naishadham D, Jemal A. Cancer statistics, 2013. CA Cancer J Clin 2013;63:11–30. [DOI] [PubMed] [Google Scholar]
- 2. Matsuda T, Ajiki W, Marugame T, Ioka A, Tsukuma H, Sobue T. Research Group of Population‐Based Cancer Registries of J . Population‐based survival of cancer patients diagnosed between 1993 and 1999 in japan: a chronological and international comparative study. Jpn J Clin Oncol 2011;41:40–51. [DOI] [PubMed] [Google Scholar]
- 3. Burris HA,3, Moore MJ, Andersen J, Green MR, Rothenberg ML, Modiano MR, Cripps MC, Portenoy RK, Storniolo AM, Tarassoff P, Nelson R, Dorr FA, et al. Improvements in survival and clinical benefit with gemcitabine as first‐line therapy for patients with advanced pancreas cancer: a randomized trial. J Clin Oncol 1997;15:2403–13. [DOI] [PubMed] [Google Scholar]
- 4. Cunningham D, Chau I, Stocken DD, Valle JW, Smith D, Steward W, Harper PG, Dunn J, Tudur‐Smith C, West J, Falk S, Crellin A, et al. Phase III randomized comparison of gemcitabine versus gemcitabine plus capecitabine in patients with advanced pancreatic cancer. J Clin Oncol 2009;27:5513–8. [DOI] [PubMed] [Google Scholar]
- 5. Colucci G, Labianca R, Costanzo D, Gebbia F, Carteni V, Massidda G, Dapretto B, Manzione E, Piazza L, Sannicolo E, Ciaparrone M, Cavanna ML, et al. Randomized phase III trial of gemcitabine plus cisplatin compared with single‐agent gemcitabine as first‐line treatment of patients with advanced pancreatic cancer: the GIP‐1 study. J Clin Oncol 2010;28:1645–51. [DOI] [PubMed] [Google Scholar]
- 6. Philip PA, Benedetti J, Corless CL, Wong R, O'Reilly EM, Flynn PJ, Rowland KM, Atkins JN, Mirtsching BC, Rivkin SE, Khorana AA, Goldman B, et al. Phase III study comparing gemcitabine plus cetuximab versus gemcitabine in patients with advanced pancreatic adenocarcinoma: southwest oncology Group‐directed intergroup trial S0205. J Clin Oncol 2010;28:3605–10. [DOI] [PMC free article] [PubMed] [Google Scholar]
- 7. Trousseau A. Phlegmasia alba dolens. Clinique Medicale De l'Hotel‐Dieu De Paris 1865;3:654–712. [Google Scholar]
- 8. Billroth T. Lectures on surgical pathology and therapeutics: a handbook for students and practitioners, 8th ed, vol. 2 London: The New Sydenham Society, 1878. [Google Scholar]
- 9. Matsumura Y, Kimura M, Yamamoto T, Maeda H. Involvement of the kinin‐generating cascade in enhanced vascular permeability in tumor tissue. Jpn J Cancer Res 1988;79:1327–34. [DOI] [PMC free article] [PubMed] [Google Scholar]
- 10. Dvorak HF. Vascular permeability factor/vascular endothelial growth factor: a critical cytokine in tumor angiogenesis and a potential target for diagnosis and therapy. J Clin Oncol 2002;20:4368–80. [DOI] [PubMed] [Google Scholar]
- 11. Stein PD, Beemath A, Meyers FA, Skaf E, Sanchez J, Olson RE. Incidence of venous thromboembolism in patients hospitalized with cancer. Am J Med 2006;119:60–8. [DOI] [PubMed] [Google Scholar]
- 12. Ruf W. Molecular regulation of blood clotting in tumor biology. Haemostasis 2001;31Suppl1:5–7. [PubMed] [Google Scholar]
- 13. Bazan JF. Structural design and molecular evolution of a cytokine receptor superfamily. Proc Natl Acad Sci USA 1990;87:6934–8. [DOI] [PMC free article] [PubMed] [Google Scholar]
- 14. van den Berg YW, Osanto S, Reitsma PH, Versteeg HH. The relationship between tissue factor and cancer progression: insights from bench and bedside. Blood 2012;119:924–32. [DOI] [PubMed] [Google Scholar]
- 15. Drake TA, Morrissey JH, Edgington TS. Selective cellular expression of tissue factor in human tissues. Implications for disorders of hemostasis and thrombosis. Am J Pathol 1989;134:1087–97. [PMC free article] [PubMed] [Google Scholar]
- 16. Flossel C, Luther T, Muller M, Albrecht S, Kasper M. Immunohistochemical detection of tissue factor (TF) on paraffin sections of routinely fixed human tissue. Histochemistry 1994;101:449–53. [DOI] [PubMed] [Google Scholar]
- 17. Lorenzet R, Napoleone E, Celi A, Pellegrini G, Di Santo A. Cell‐cell interaction and tissue factor expression. Blood Coagul Fibrinolysis 1998;9Suppl1:S49–59. [PubMed] [Google Scholar]
- 18. Teicher BA, Chari RV. Antibody conjugate therapeutics: challenges and potential. Clin Cancer Res 2011;17:6389–97. [DOI] [PubMed] [Google Scholar]
- 19. Thudium K, Bilic S, Leipold D, Mallet W, Kaur S, Meibohm B, Erickson H, Tibbitts J, Zhao H, Gupta M. American Association of Pharmaceutical Scientists National Biotechnology Conference Short Course: Translational Challenges in Developing Antibody–Drug Conjugates: May 24, 2012, San Diego, CA. MAbs 2013;5:5–12. [DOI] [PMC free article] [PubMed] [Google Scholar]
- 20. Flygare JA, Pillow TH, Aristoff P. Antibody–drug conjugates for the treatment of cancer. Chem Biol Drug Des 2013;81:113–21. [DOI] [PubMed] [Google Scholar]
- 21. Matsumura Y, Maeda H. A new concept for macromolecular therapeutics in cancer chemotherapy: mechanism of tumoritropic accumulation of proteins and the antitumor agent smancs. Cancer Res 1986;46:6387–92. [PubMed] [Google Scholar]
- 22. Saito Y, Hashimoto Y, Kuroda J, Yasunaga M, Koga Y, Takahashi A, Matsumura Y. The inhibition of pancreatic cancer invasion‐metastasis cascade in both cellular signal and blood coagulation cascade of tissue factor by its neutralisation antibody. Eur J Cancer 2011;47:2230–9. [DOI] [PubMed] [Google Scholar]
- 23. Ducry L, Stump B. Antibody–drug conjugates: linking cytotoxic payloads to monoclonal antibodies. Bioconjug Chem 2010;21:5–13. [DOI] [PubMed] [Google Scholar]
- 24. Katz J, Janik JE, Younes A. Brentuximab vedotin (SGN‐35). Clin Cancer Res 2011;17:6428–36. [DOI] [PubMed] [Google Scholar]
- 25. Okeley NM, Miyamoto JB, Zhang X, Sanderson RJ, Benjamin DR, Sievers EL, Senter PD, Alley SC. Intracellular activation of SGN‐35, a potent anti‐CD30 antibody–drug conjugate. Clin Cancer Res 2010;16:888–97. [DOI] [PubMed] [Google Scholar]
- 26. Verma S, Miles D, Gianni L, Krop IE, Welslau M, Baselga J, Pegram M, Oh DY, Dieras V, Guardino E, Fang L, Lu MW, et al. Trastuzumab emtansine for HER2‐positive advanced breast cancer. N Engl J Med 2012;367:1783–91. [DOI] [PMC free article] [PubMed] [Google Scholar]
- 27. Breij EC, de Goeij BE, Verploegen S, Schuurhuis DH, Amirkhosravi A, Francis J, Miller VB, Houtkamp M, Bleeker WK, Satijn D, Parren PW. An Antibody–drug conjugate that targets tissue factor exhibits potent therapeutic activity against a broad range of solid tumors. Cancer Res 2014;74:1214–26. [DOI] [PubMed] [Google Scholar]
- 28. Yasunaga M, Manabe S, Tarin D, Matsumura Y. Cancer‐stroma targeting therapy by cytotoxic immunoconjugate bound to the collagen 4 network in the tumor tissue. Bioconjug Chem 2011;22:1776–83. [DOI] [PubMed] [Google Scholar]
- 29. Yasunaga M, Manabe S, Tarin D, Matsumura Y. Tailored immunoconjugate therapy depending on a quantity of tumor stroma. Cancer Sci 2013;104:231–7. [DOI] [PMC free article] [PubMed] [Google Scholar]
- 30. Matsumura Y. Cancer stromal targeting (CAST) therapy. Adv Drug Deliv Rev 2012;64:710–9. [DOI] [PubMed] [Google Scholar]