

Summary
Background
Previous studies have demonstrated significant variability in the processes of care and outcomes of chronic obstructive pulmonary disease (COPD) exacerbations. The AUDIPOC is a Spanish nationwide clinical audit that identified large between‐hospital variations in care and clinical outcomes. Here, we test the hypothesis that these variations can be attributed to either patient characteristics, hospital characteristics and/or the so‐called hospital‐clustering effect, which indicates that patients with similar characteristics may experience different processes of care and outcomes depending on the hospital to which they are admitted.
Methods
A clinical audit of 5178 COPD patients consecutively admitted to 129 Spanish public hospitals was performed, with a 90‐day follow‐up. Multilevel regression analysis was conducted to model the probability of patients experiencing adverse outcomes. For each outcome, an empty model (with no independent variables) was fitted to assess the clustering effect, followed by a model adjusted for the patient‐ and hospital‐level covariables. The hospital‐clustering effect was estimated using the intracluster correlation coefficient (ICC); the cluster heterogeneity was estimated with the median odds ratio (MOR), and the coefficients of predictors were estimated with the odds ratio (OR).
Results
In the empty models, the ICC (MOR) for inpatient mortality and the follow‐up mortality and readmission were 0.10 (1.80), 0.08 (1.65) and 0.01 (1.24), respectively. In the adjusted models, the variables that most represented the patients’ clinical conditions and interventions were identified as outcome predictors and further reduced the hospital variations. By contrast, the resource factors were primarily unrelated with outcomes.
Conclusions
This study demonstrates a noteworthy reduction in the observed crude between‐hospital variation in outcomes after accounting for the hospital‐cluster effect and the variables representing patient's clinical conditions. This emphasises the predictor importance of the patients’ clinical conditions and interventions, and understates the impacts of hospital resources and organisational factors.
What's known
Patients with chronic obstructive pulmonary disease (COPD) frequently suffer from acute exacerbations (AECOPD) during the course of the disease, and hospitalisation is often required. Previous studies have shown that there is significant variability in AECOPD processes of care and outcomes across hospitals and countries. These variations can be primarily attributed to the patient characteristics, the hospital characteristics and the hospital‐clustering effect. To guarantee correct and consistent clinical care, it is crucial to understand the determinants of these variations and their potential impacts on clinical outcomes.
What's new
This study is the result of the AUDIPOC study, a nationwide clinical audit on AECOPD conducted in Spain. The variables that most represented the patients’ clinical conditions and interventions are identified as outcome predictors. This study demonstrates a noteworthy reduction in the observed crude between‐hospital variation in outcomes after accounting for the hospital‐cluster effect and the variables representing patient's clinical conditions. By contrast, the resource factors were unrelated with outcomes.
Introduction
Patients with chronic obstructive pulmonary disease (COPD) frequently suffer from acute exacerbations (AECOPD) during the course of the disease, and hospitalisation is often required. These exacerbations are associated with significant patient mortality and morbidity 1, 2 and are responsible for most of the social and economic burdens of COPD 3. Thus, correct and standardised clinical care should be provided to these patients. However, previous studies have shown that there is significant variability in AECOPD processes of care and outcomes across hospitals 4, 5, 6, 7, 8, 9 and countries 10. The AUDIPOC study, a nationwide clinical audit on AECOPD conducted in Spain from 2008 to 2009 11, included 129 Spanish public general hospitals 12. The study confirmed that relevant variations in patient demographics and clinical characteristics, hospital resources and organisational variables, diagnostic and therapeutic interventions, and outcomes occurred among the participating hospitals 13.
To guarantee correct and consistent clinical care, it is crucial to understand the determinants of these variations and their potential impacts on clinical outcomes. This study builds on the hypothesis that these variations can be primarily attributed to three effects: the patient‐level effect (patient characteristics), hospital‐level effect (hospital characteristics) and hospital‐clustering effect. The cluster effect indicates that patients with similar characteristics may experience different processes of care and outcomes, depending on the hospital to which they are admitted because they are subject to distinct common contextual influences. Accordingly, the objectives of this study were to determine: (i) how much of the between‐hospital variations observed in AUDIPOC are explained by the hospital‐clustering effect; (ii) whether any features concerning the hospital's structure and organisation, the patient's demographics and clinical conditions and the processes of care represent outcome predictors; and (iii) the extent to which these predictors further reduce the between‐hospital variation in AECOPD outcomes.
Methods
The AUDIPOC study methodology has been extensively described elsewhere 11. Briefly, the AUDIPOC comprised a clinical audit, with prospective case ascertainment and retrospective data acquisition of all consecutive AECOPD hospital admissions between 1 November and 31 December 2008. Sampling was performed in two stages: first the hospitals and then the patients in the hospitals. As described in the methodological paper 11, the institutions included in the AUDIPOC study represented all of the main types of Spanish public hospitals in a fairly homogeneous manner. However, private centres were excluded 11. Hence, the AUDIPOC dataset has a hierarchical, multilevel structure with patients clustered within the hospitals. Among the 225 public general hospitals with acute medical care, 129 hospitals representing all Spanish regions (57%) voluntarily joined the study. These hospitals covered an estimated 70% of the general population. During the study period, based on a controlled vocabulary of 13 commonly used clinical tags, local investigators reviewed the admission forms of all consecutive emergency room admissions daily to identify the potential AECOPD patients. Upon discharge, the discharge reports and clinical records were searched for a primary diagnosis of AECOPD as the cause of admission. Ultimately, 5178 patients (45% of the 11,564 patients who were initially considered to be potentially eligible for the study) were enroled as definite study cases. During the study period, over 750 variables were recorded, with information regarding the hospital resources, patient characteristics and processes of care for every participant centre and clinical case included 11.
The study was designed and supervised by a scientific committee. The field work at each participating hospital was performed by a local research group that was predominately composed of clinicians. An Internet‐based information system, which allowed close monitoring and data quality control, was created for online and on‐time data registration. A central office was created to supervise the entire project and to support and monitor the web‐based database for quality. Patient data were gathered from the medical records. The data related to the hospitals’ resources and organisation characteristics were assembled from the Spanish National Health System Registry 14 and the Hospital General Management Offices. Guideline adjustments were obtained by benchmarking the information recorded against an 8‐item check list that was based on the Global Initiative for Obstructive Lung Disease (GOLD) 2008 update, as follows: (i) the spirometry result was available at admission; (ii) the arterial blood gas test was performed at admission; (iii) a chest radiograph was performed at admission; (iv) controlled oxygen therapy was used; (v) systemic corticosteroids were administered; (vi) antibiotics were administered if the GOLD 2008 criteria were met; (vii) NIV was administered if the pH was < 7.35 and PaCO2 was > 6 kPa; and (viii) IMV was administered if the pH was < 7.25 and PaCO2 was > 8 kPa. Good compliance was identified as those patients with a total score ≥ 5 items.
The ethics committee of each participating hospital approved the study protocol. According to the regulations, all data were de‐identified in the database, which was dissociated and encrypted. Because of the non‐interventional nature of the study and the need to blindly evaluate the clinical performance, informed consent was waived.
Statistical analysis
Following the completion of the field work, a data cleaning operation was attempted on the complete dataset to identify and correct missing and extremely unlikely values as well as inconsistencies 15. Despite this data cleaning, a number of missing values continued to affect many variables. To avoid potential selection bias, we did not delete the concerned cases; instead, we stratified the affected variables and set aside a specific stratum for the missing data.
According to the dataset structure, logistic multivariable multilevel regression analysis was conducted to model the patient's probability of experiencing (i) all‐cause death during the index admission, (ii) all‐cause death within the 90‐day follow‐up period and (iii) all‐cause readmission within the follow‐up period. In the present analysis, we acknowledge that all patients admitted to any given hospital for a specific clinical issue would get similar cares, which might in turn be different from those delivered by another institution. This phenomenon may be explained by the existence of specific hospital‐linked factors. Such variables may include, but are not limited to, socioeconomic status, demographics, environmental characteristics, usage of health services and clinical practice styles. We hypothesised that such differences among distinct participating hospitals (i.e. cluster effect) might exert a significant influence on outcomes.
Multivariable multilevel regression analysis enables the estimation and quantification of the hospital‐cluster effect and provides unbiased estimates of the regression coefficients; it can also concurrently include the predictor variables at both the patient‐level and hospital‐level 16. In this analysis, the coefficients of the predictor variables were transformed into odds ratios (OR), with 95% confidence intervals (CI). In addition, the hospital‐cluster effect was evaluated and quantified by two indicators: (i) the intracluster correlation coefficient (ICC) adapted to the logistic regression 17 and (ii) the median OR (MOR) with 95% CI 18, 19. The ICC quantifies the fraction of the total variability in the outcomes attributable to the clustering effect. The ICC ranges from 0 to 1, and a smaller ICC indicates a lower cluster effect. The MOR is a measure of cluster heterogeneity and is defined as the median value of the distribution of ORs obtained when two individuals from different hospitals (i.e. one individual from the highest risk hospital and one individual from the lowest risk hospital) were randomly selected and compared. Simplified, the MOR can be interpreted as the median increased odds of reaching the outcome if an individual was admitted to another hospital with a greater risk of that outcome. The measure is always ≥ 1, where the MOR equals 1 when there is no between‐cluster variation and increases as the variation becomes larger. Interestingly, the MOR is statistically independent of the prevalence of the outcome, can be easily computed, and is directly comparable with the coefficients of the individual‐ and hospital‐level predictors. To plot the reduction in the between‐hospital outcome variations after accounting for the cluster effect and the predictor variables, the crude estimates of probability were transformed to the logit scale for comparisons.
In the present analysis, two multivariable multilevel regression analyses were conducted for each outcome: first, an empty model, which included only the hospital‐cluster effect, was used. In this model, the individual probability of reaching the outcome is only a function of the hospital to which the patient has been admitted. Second, an adjusted model was used, which included the clustering effect as well as the variables at the patient‐level and hospital‐level that were associated with the specific outcome. The variables tested in the adjusted model were selected from multilevel bivariate logistic regression analysis using a forward selection procedure based on the Wald test. The models were estimated by maximum likelihood using the adaptive Gaussian quadrature approximation to the log likelihood (with seven quadrature points) and were implemented using Stata statistical software (StataCorp LP, College Station, TX, USA) version 12.1 20.
Results
Bivariate analysis
Tables S1–S4 describe the patients’ characteristics, demographics and clinical conditions, as well as the bivariate association between the outcomes and the variables related to the hospital resources and organisation, diagnostic and therapeutic interventions performed at admission and the therapeutic interventions used during admission and at discharge. The majority of the patient‐level variables were associated with the outcomes, whereas the majority of the hospital‐level variables were not. Figure 1 represents the relationship between the number of patients recruited by each hospital and the clinical outcomes. The probability of each outcome scatters considerably as the number of patients decreases.
Figure 1.
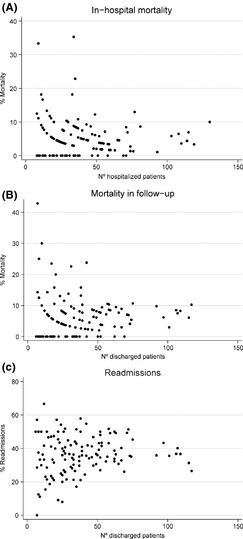
Relationship between the number of patients recruited by each hospital and the clinical outcomes
Multivariable analysis
For in‐hospital mortality (Table 1), the empty model exhibited a significant cluster effect (ICC = 0.10) and cluster heterogeneity (MOR = 1.80). The adjusted model retained a number of covariables as outcome predictors, the majority of which was linked to the patient‐level (e.g. older age, an increased number of comorbidities, poor performance status and raised serum creatinine levels, poor respiratory conditions – i.e. previous admission for AECOPD, home oxygen therapy and acidosis at admission – or more intense treatments – i.e. intravenous methylxanthines and ventilation support upon admission) were predictors of adverse outcomes. Interestingly, guideline compliance was a strong predictor of a favourable outcome. Only one variable linked to the hospital‐level (i.e., the large hospital COPD volume, the number of COPD patients admitted to the hospital the year prior to admission) was retained in the model as a predictor of a favourable outcome. The inclusion of all predictors further reduced the residual cluster variability. The ICC and the MOR were reduced to 0.04 and 1.46, respectively. To explain the between‐hospital variability in outcomes, all patient variables, with the exception of age (OR = 1.34) and the Charlson index (OR = 1.09), displayed an OR that was larger than the MOR and, therefore, must be of greater relevance compared with the cluster‐hospital effect. Some unrecorded (missing values) strata showed significant associations, which are naturally open to interpretation.
Table 1.
The correlations between the patient and hospital characteristics and in‐hospital mortality, with variations and clustering
| In‐hospital mortality | Empty model | Adjusted model, OR (95% CI) |
|---|---|---|
| Patient level | ||
| Age (in decades) | 1.34 (1.14–1.57) | |
| Previous admissions for AECOPD | 1.62 (1.11–2.36) | |
| Home oxygen therapy prior to admission | ||
| No | Reference | |
| Yes | 1.57 (1.08–2.28) | |
| Not recorded | 0.50 (0.35–0.73) | |
| Acidosis, pH < 7.35 | 2.23 (1.59–3.12) | |
| Charlson index (0–15) | 1.09 (1.01–1.16) | |
| Performance status | ||
| No limitation | Reference | |
| Moderate limitation | 2.41 (1.38–4.21) | |
| Self‐care severely limited | 9.05 (5.35–15.30) | |
| Not recorded | 3.54 (2.11–5.94) | |
| Creatinine (mg/dl) | ||
| ≤ 1.32 | Reference | |
| > 1.32 | 2.04 (1.48–2.83) | |
| Not recorded | 2.84 (1.86–4.34) | |
| Intravenous methylxanthines at admission | 2.79 (1.81–4.31) | |
| Ventilary support at admission | 2.13 (1.44–3.16) | |
| Clinical Practice Guidelines score (5–8 vs. 0–4) | 0.10 (0.07–0.15) | |
| Hospital level | ||
| Number of COPD patients admitted in 2007 (N/100) | 1.03 |
0.97 (0.93–1.00) IOR 80 (0.47–1.98) |
| Hospital‐clustering effect | ||
| ICC | 0.10 | 0.04 |
| MOR (95% CI) | 1.80 (1.54–2.23) | 1.46 (1.24–1.94) |
Likelihood Model: Wald χ2 test (14) = 343.26; p > χ2 = 0.0000. OR, odds ratio; CI, confidence interval; ICC, intra‐cluster correlation coefficient; MOR, median odds ratio.
For mortality during the follow‐up (Table 2), the empty mortality model displayed an ICC of 0.08 and a MOR of 1.65. In the adjusted model, age, maleness, weak general health (poor performance status, low levels of haemoglobin and pedal oedema) and poor respiratory conditions (home‐based oxygen therapy and ventilatory support) were retained as the predictors of a bad outcome. No specific drug treatment was correlated with this outcome. Only one variable linked to the hospital‐level (i.e. the availability of a nursing home for referral of patients) was maintained as a relatively strong predictor of a good outcome. The inclusion of these predictors further reduced the between‐hospital cluster variability. The ICC and MOR dropped to 0.04 and 1.51, respectively. All patient‐level variables, with the exception of age, were larger compared with the MOR and were considered to be of greater importance compared with the cluster effect in explaining the between‐hospital outcome variations. The unrecorded (missing values) strata remained in the model, but this association was not significant.
Table 2.
Correlations between the patient and hospital characteristics and mortality during the 90‐day follow‐up, with variations and clustering
| Variables | Empty model | Adjusted model, OR (95% CI) |
|---|---|---|
| Patient characteristics | ||
| Male | 1.92 (1.21–3.04) | |
| Age (in decades) | 1.40 (1.21–1.62) | |
| Performance status | ||
| No limitation | Reference | |
| Moderate limitation | 1.81 (1.26–2.61) | |
| Self‐care severely limited | 3.33 (2.26–4.90) | |
| Not recorded | 1.25 (0.86–1.83) | |
| Haemoglobin, mg/dl | ||
| > 11.5 | Reference | |
| ≤ 11.5 | 1.75 (1.35–2.28) | |
| Not recorded | 1.35 (0.85–2.15) | |
| Pedal oedema | 1.52 (1.18–1.97) | |
| Home‐based ventilatory support | 1.66 (1.17–2.35) | |
| Home‐based oxygen therapy | 2.12 (1.62–2.78) | |
| Hospital characteristics | ||
| Availability of a nursing home for referral of patients | 0.71 (0.53–0.98) | |
| Hospital‐clustering effect | ||
| ICC | 0.08 | 0.05 |
| MOR (95% CI) | 1.65 (1.40–2.12) | 1.51 (1.27–2.00) |
Likelihood Model: Wald χ2 test (14) = 190.15; p > χ2 = 0.0000. OR, odds ratio; CI, confidence interval; ICC, intra‐cluster correlation coefficient; MOR, median odds ratio.
For hospital readmissions during follow‐up (Table 3), the ICC and the MOR were not reduced after accounting for both the hospital effect and the predictor variables. Male gender, general clinical conditions (comorbidity, poor performance status, comorbidity and anaemia) and poor respiratory status (previous admissions for AECOPD, airway obstruction and domiciliary oxygen treatment) were all associated with adverse outcomes. Treatment with methylxanthines and systemic steroids at discharge were associated with adverse outcomes, although a confounder effect cannot be discounted. All variables in the model, with the exception of the degree of obstruction (FEV1), were more relevant that the cluster effect in explaining the residual between‐hospital variations. No hospital‐level variables were retained in the model. The unrecorded (missing values) strata remained in the model, but this association was not significant.
Table 3.
Correlations between the patient and hospital characteristics and readmission during the 90‐day follow‐up, with variations and clustering
| Variables | Empty model | Adjusted model, OR (95% CI) |
|---|---|---|
| Patient level | ||
| Male | 1.39 (1.14–1.68) | |
| Previous admissions for ECOPD | 1.79 (1.54–2.09) | |
| FEV 1 (%) | ||
| > 55 | Reference | |
| ≤ 55 | 1.14 (0.95–1.38) | |
| Not recorded | 0.96 (0.79–1.16) | |
| Home oxygen therapy | ||
| No | Reference | |
| Yes | 1.39 (1.18–1.62) | |
| Not recorded | 0.96 (0.83–1.12) | |
| Performance status | ||
| No or slight limitation | Reference | |
| Moderate limitation | 1.51 (1.27–1.78) | |
| Self‐care severely limited | 1.68 (1.35–2.08) | |
| Not recorded | 1.46 (1.24–1.71) | |
| Charlson index (0–15) | 1.06 (1.02–1.10) | |
| Haemoglobin (mg/dl) | ||
| > 11.5 | Reference | |
| ≤ 11.5 | 1.31 (1.14–1.51) | |
| Not recorded | 1.05 (0.84–1.32) | |
| Methylxanthines at discharge | 1.31 (1.08–1.59) | |
| Systemic steroids at discharge | 1.24 (1.08–1.44) | |
| Hospital‐clustering effect | ||
| ICC | 0.01 | 0.01 |
| MOR (95% CI) | 1.24 (1.15–1.38) | 1.23 (1.14–1.39) |
Likelihood Model: Wald χ2 test (13) = 262.95; p > χ2 = 0.0000. OR, odds ratio; CI, confidence interval; ICC, intra‐cluster correlation coefficient; MOR, median odds ratio.
Figure 2 shows a graphic representation of the progressive decrease in between‐hospital outcome variations as the analysis transitioned from the crude data to the adjusted model. In this figure, the hospitals are sorted by region. No variation pattern was observed between the regions.
Figure 2.
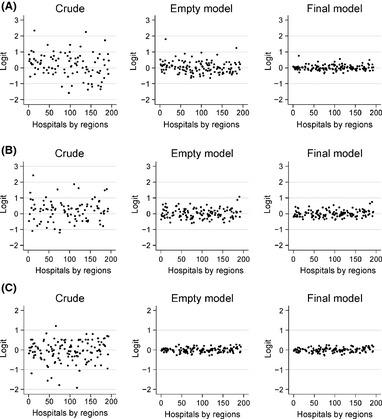
Decreased between‐hospital outcome variations after accounting for the cluster effect and the predictor variables
Discussion
This study shows that accounting for the hospital‐cluster effect, the patient‐level and hospital‐level predictor variables, remarkably reduced the residual, unexplained between‐hospital variation in outcomes. Besides, it identified a number of variables as outcome predictors at the patient and hospital levels. Most predictors were linked to the patient‐level, mostly related to general and respiratory clinical conditions and some were of greater relevance than the hospital‐clustering effect in explaining the between‐hospital variations in outcomes.
Interpretation of results
Hospital‐clustering effect
A number of factors affected the reduced hospital variability because of a contextual, hospital‐clustering effect. The concurrence of the hospital sample size and the binomial distribution of the outcomes may be a plausible explanation, as shown in Figure 1. Accordingly, the number of admissions in each specific centre is relevant for understanding the results. In addition, each hospital's admission selection process, resources, organisation, or standards of care, as well as the contextual/geographical characteristics of the hospital catchment area, such as socioeconomic status 21, 22, utilisation of health services 23 or COPD hospitalisation criteria 24, 25, may also affect this hospital‐clustering effect. Ultimately, after accounting for the contextual factors, the between‐hospital variation in outcomes appears to be remarkably reduced, although significant.
Outcomes predictors
Regarding in‐hospital mortality, note that the adherence to clinical guidelines was a strong predictor of a favourable outcome. In a recent European COPD Audit, a considerable variability in the adjustment to all of the 10 key recommendations outlined in the GOLD guidelines was observed 26. In our study, methylxanthine treatment at admission can potentially be interpreted as confounding a poor clinical status. Similarly, home‐based oxygen therapy and ventilatory support prescribed at discharge can be considered confounders of poor clinical status (e.g. mortality) during the follow‐up. The same argument can be made for the prescription of methylxanthines and systemic steroids (i.e. regarding their association with readmission). The majority of patient‐level predictors is important and is often of greater importance than the cluster (hospital) effect for further reducing between‐hospital variations.
Only 2 of the 21 hospital‐level variables examined were retained in the model as predictors of outcomes: the number of COPD patients admitted to the hospital (hospital volume of COPD), which was considered to be a proxy for the experience of the hospital in managing AECOPD patients and for the accessibility of a hospital for a patient's referral at discharge; however, none of the variables explained the residual hospital‐cluster variability. The small number of resources and organisational hospital variables ultimately retained as predictors of outcomes is intriguing. It is conceivable that this finding is the result of a relative small hospital sample size (N = 129). It is also conceivable that the seriousness of the clinical conditions in the AUDIPOC case series might be overpowering, thereby preventing other variables from entering the final model. There are other potential explanations. For instance, the in‐hospital COPD treatment does not require complex interventions; thus, the majority of hospitals fulfil these requirements. One cannot discount the fact that the unrecorded hospital‐level variables, such as hospital spending 27, nurse staffing 28, supported discharge programs 29 and/or evidence‐based practices for COPD care at discharge, may play a role 30. However, given the small amount of cluster variability left unexplained in the analysis, it is unlikely that relevant hospital‐level variables were not revealed.
Previous studies
Previous studies have shown large between‐hospital 4, 5, 6, 7, 8, 9 and between‐country 10 variations in resources, management and outcomes. A number of studies are consistent with our findings that the clinical aspect appears to be the most relevant of all potential determinants of in‐hospital mortality. In‐hospital mortality is most clearly related to a patient's acute physiological state 31 and to the development of acute comorbidity. Postdischarge mortality particularly reflects the severity of the underlying COPD, as well as specific comorbidities, particularly cardiac disease 32. Factors that influence the frequency of readmission include functional limitation and poor health related quality of life 33, 34. According to the 2007 UK National Audit, poor performance status, acidosis, and the presence of leg oedema were the best significant independent predictors of death, while the lowest FEV1 tertile, previous admission and readmissions with ≥ 5 medications were the best predictors of readmission 35. Other studies have noted that comorbidities adversely affect a range of short‐term patient outcomes related to acute admission and that the recognition of relevant accompanying diseases at admission provides an opportunity for specific interventions that may improve short‐term prognosis 36.
Roberts et al. have suggested that a hospital's resources and organisational factors are potential components of the unexplained variation in outcomes 35; the authors reported that higher mortality was associated with fewer doctors and fewer patients under the care of a specialist physician 37. In reference to the UK National COPD Audit 2003, Price et al. examined the association between the outcomes of resources and the organisation of care provided by hospitals 38. They used logistic regression analysis to obtain a set of patient case mixed predictors and then entered these predictors into random effects logistic regression models; these models assessed the correlation of unit resources and organisation with the outcomes of inpatient mortality and readmissions during 90 days of follow‐up after the index admission, as well as the length of hospital stay. The hospital‐cluster effect was significant for all outcomes, with ICC values of 0.043 (death within 90 days), 0.059 (inpatient death) and 0.084 (readmission). According to the results, a greater number of medical and nursing staff was identified as a protective factor for intra‐hospital mortality but not for cumulative mortality within 90 days of admission. Other factors, such as the organisational score, catchment population, volume of COPD patients, and number of hospital beds, were not associated with mortality or readmissions. In this regard, our study identified only the hospital‐level variables, the COPD hospital volume as a predictor of inpatient mortality and the referral hospital at discharge as a predictor of mortality after discharge, although this association may result from underreporting mortality in the reference hospital.
Walker et al. 8 have recently shown that 30‐day mortality after hospitalisation is characterised by a high variability that makes it unreliable as an annual measure of hospital COPD care. Indeed, this parameter shows a considerable year‐on‐year variation which is chiefly related to different case mixes rather than to care delivery per se. However, it was not our aim to distinguish between avoidable and inevitable deaths nor we were willing to rate the quality of the participating hospitals based on their mortality rates.
On the basis of our results, we agree with the authors who argue that improving the clinical care and outcomes of AECOPD patients primarily relies on a better understanding of the pathobiology of the disease, early diagnosis of AECOPD 39, development of novel therapeutic strategies 7, 40 and dissemination and application of properly updated Clinical Guidelines. Our observation that adherence to clinical guidelines was associated with lower inpatient mortality highlights the value of targeting continuous medical and nursing education to reduce medical practice variations and improve outcomes. Nonetheless, note that most guidelines do not provide explicit guidance on treating patients with comorbidities, particularly for discordant combinations 41.
Strengths and weaknesses
The AUDIPOC describes standard clinical practices for treating AECOPD patients in a sample of hospitals that accounts for 70% of the Spanish population; thus, it can be considered to be the first nationwide cross‐sectional study of a clinical audit in Spain. In addition, a multilevel analysis was performed, which particularly meaningful when comparing patient outcomes across hospitals. However, the AUDIPOC does have some limitations. First, its dataset contains some information gaps in the form of missing values. Second, the relatively small number of participating hospitals may have prevented some hospital‐level variables from entering the final multivariable model. Further studies with a larger number of hospitals would be of interest to confirm the results described in this work.
Conclusions
This study demonstrates that the most important factor underlying the between‐hospital variations in the mortality and re‐admission of patients hospitalised for AECOPD lies in the patient‐clinician domain. Based on this finding, it follows that efforts to improve patient quality of care and outcomes should be directed towards this domain, including the development of novel therapeutic strategies and the dissemination and application of properly updated Clinical Guidelines, with a special emphasis on identifying and treating comorbidities.
Supporting information
Data S1. List of researchers in the AUDIPOC Spain study group.
Table S1. Bivariate analysis of the associations between the hospital resources and organizational variables and the outcomes.
Table S2. Bivariate analysis of the associations between the patients’ demographic and clinical characteristics and the outcomes.
Table S3. Bivariate analysis of the associations between the diagnostic interventions and the outcomes.
Table S4. Bivariate analysis of the associations between the patient treatments at discharge and the three outcomes analyzed.
Acknowledgements
Authors thank all participating institutions for their willingness to contribute to medical research aimed at reducing medical practice variations, improving the quality of care provided. Supported by the Spanish Ministry of Health, Instituto de Salud Carlos III, FIS project numbers: PI07/90129, PI07/90309, PI07/90486, PI07/90503, PI07/90516, PI07/90721, PI08/90129, PI08/90578, PI08/90251, PI08/90529, PI08/90129, PI07/90403, PI08/90447, PI08/90457, PI08/90486 and PI08/90550, the Centro de Investigación Biomédica en Red de Enfermedades Respiratorias (CIBERES) and the Spanish Society of Respiratory and Thoracic Surgey (SEPAR).
Disclosures None.
References
- 1. Miravitlles M, Ferrer M, Pont A et al. Effect of exacerbations on quality of life in patients with chronic obstructive pulmonary disease: a 2 year follow up study. Thorax 2004; 59: 387–95. [DOI] [PMC free article] [PubMed] [Google Scholar]
- 2. Soler‐Cataluna JJ, Martinez‐Garcia MA, Roman Sanchez P et al. Severe acute exacerbations and mortality in patients with chronic obstructive pulmonary disease. Thorax 2005; 60: 925–31. [DOI] [PMC free article] [PubMed] [Google Scholar]
- 3. Perera PN, Armstrong EP, Sherrill DL, Skrepnek GH. Acute exacerbations of COPD in the United States: inpatient burden and predictors of costs and mortality. COPD 2012; 9: 131–41. [DOI] [PubMed] [Google Scholar]
- 4. Hosker H, Anstey K, Lowe D et al. Variability in the organisation and management of hospital care for COPD exacerbations in the UK. Respir Med 2007; 101: 754–61. [DOI] [PubMed] [Google Scholar]
- 5. Agabiti N, Belleudi V, Davoli M et al. Profiling hospital performance to monitor the quality of care: the case of COPD. Eur Respir J 2010; 35: 1031–8. [DOI] [PubMed] [Google Scholar]
- 6. Pretto JJ, McDonald VM, Wark PA, Hensley MJ. Multicentre audit of inpatient management of acute exacerbations of chronic obstructive pulmonary disease: comparison with clinical guidelines. Intern Med J. 2012; 42: 380–7. [DOI] [PubMed] [Google Scholar]
- 7. Lindenauer PK, Pekow P, Gao S et al. Quality of care for patients hospitalized for acute exacerbations of chronic obstructive pulmonary disease. Ann Intern Med 2006; 144: 894–903. [DOI] [PubMed] [Google Scholar]
- 8. Walker PP, Thompson E, Crone H et al. Use of mortality within 30 days of a COPD hospitalisation as a measure of COPD care in UK hospitals. Thorax 2013; 68: 968–70. [DOI] [PubMed] [Google Scholar]
- 9. Liaaen ED, Henriksen AH, Stenfors N. A Scandinavian audit of hospitalizations for chronic obstructive pulmonary disease. Respir Med 2010; 104: 1304–9. [DOI] [PubMed] [Google Scholar]
- 10. Lopez‐Campos JL, Hartl S, Pozo‐Rodriguez F et al. Variability of hospital resources for acute care of COPD patients: the European COPD Audit. Eur Respir J 2014; 43: 754–62. [DOI] [PubMed] [Google Scholar]
- 11. Pozo‐Rodriguez F, Alvarez CJ, Castro‐Acosta A et al. Clinical audit of patients admitted to hospital in Spain due to exacerbation of COPD (AUDIPOC study): method and organisation. Arch Bronconeumol 2010; 46: 349–57. [DOI] [PubMed] [Google Scholar]
- 12. Ilowite J, Webb R, Friedman B et al. Addition of montelukast or salmeterol to fluticasone for protection against asthma attacks: a randomized, double‐blind, multicenter study. Ann Allergy Asthma Immunol 2004; 92: 641–8. [DOI] [PubMed] [Google Scholar]
- 13. Pozo‐Rodriguez F, Lopez‐Campos JL, Alvarez‐Martinez CJ et al. Clinical audit of COPD patients requiring hospital admissions in Spain: AUDIPOC study. PLoS ONE 2012; 7: e42156. [DOI] [PMC free article] [PubMed] [Google Scholar]
- 14. Donohue JF, Kalberg C, Emmett A et al. A short‐term comparison of fluticasone propionate/salmeterol with ipratropium bromide/albuterol for the treatment of COPD. Treat Respir Med 2004; 3: 173–81. [DOI] [PubMed] [Google Scholar]
- 15. Cody R. Cody's Data Cleaning Techniques using SAS Software. Cary, NY: SAS Institute, 2005. [Google Scholar]
- 16. Gelman A, Hill L. Data Analysis Using Regression ans Multilevel/Hierarchical Models. New York: Cambridge University Press, 2007. [Google Scholar]
- 17. Snidjers T, Bosker R. Multilevel Analysis: An Introduction to Basic and Advanced Multilevel Modeling. Thousand Oaks, CA:SAGE; 1999. [Google Scholar]
- 18. Merlo J. Multilevel analytical approaches in social epidemiology: measures of health variation compared with traditional measures of association. J Epidemiol Community Health 2003; 57: 550–2. [DOI] [PMC free article] [PubMed] [Google Scholar]
- 19. Merlo J, Chaix B, Ohlsson H et al. A brief conceptual tutorial of multilevel analysis in social epidemiology: using measures of clustering in multilevel logistic regression to investigate contextual phenomena. J Epidemiol Community Health 2006; 60: 290–7. [DOI] [PMC free article] [PubMed] [Google Scholar]
- 20. Rabe‐Hesketh S. Multilevel and Longitudinal Modeling Using Stata. College Station, TX: Stata Press, 2008: 2008. [Google Scholar]
- 21. Joynt KE, Orav EJ, Jha AK. Thirty‐day readmission rates for Medicare beneficiaries by race and site of care. JAMA 2011; 305: 675–81. [DOI] [PMC free article] [PubMed] [Google Scholar]
- 22. Eisner MD, Blanc PD, Omachi TA et al. Socioeconomic status, race and COPD health outcomes. J Epidemiol Community Health 2011; 65: 26–34. [DOI] [PMC free article] [PubMed] [Google Scholar]
- 23. Koehn V, Paccaud F. Assessment of regional differences in utilisation of health services: inherent statistical problems. Sozial‐Und Praventivmedizin 1996; 41: 63–9. [DOI] [PubMed] [Google Scholar]
- 24. Holt JB, Zhang X, Presley‐Cantrell L, Croft JB. Geographic disparities in chronic obstructive pulmonary disease (COPD) hospitalization among Medicare beneficiaries in the United States. Int J Chron Obstruct Pulmon Dis 2011; 6: 321–8. [DOI] [PMC free article] [PubMed] [Google Scholar]
- 25. Calderon‐Larranaga A, Carney L, Soljak M et al. Association of population and primary healthcare factors with hospital admission rates for chronic obstructive pulmonary disease in England: national cross‐sectional study. Thorax 2011; 66: 191–6. [DOI] [PubMed] [Google Scholar]
- 26. Roberts CM, Lopez‐Campos JL, Pozo‐Rodriguez F et al. European hospital adherence to GOLD recommendations for chronic obstructive pulmonary disease (COPD) exacerbation admissions. Thorax 2013; 68: 1169–71. [DOI] [PubMed] [Google Scholar]
- 27. Stukel TA, Fisher ES, Alter DA et al. Association of hospital spending intensity with mortality and readmission rates in Ontario hospitals. JAMA 2012; 307: 1037–45. [DOI] [PMC free article] [PubMed] [Google Scholar]
- 28. Needleman J, Buerhaus P, Pankratz VS et al. Nurse staffing and inpatient hospital mortality. N Engl J Med 2011; 364: 1037–45. [DOI] [PubMed] [Google Scholar]
- 29. Utens CM, Goossens LM, Smeenk FW et al. Early assisted discharge with generic community nursing for chronic obstructive pulmonary disease exacerbations: results of a randomised controlled trial. BMJ Open 2012; 2: e001684. [DOI] [PMC free article] [PubMed] [Google Scholar]
- 30. Kastelik JA, Lowe D, Stone RA et al. National audit of supported discharge programmes for management of acute exacerbations of chronic obstructive pulmonary disease 2008. Thorax 2012; 67: 371–3. [DOI] [PubMed] [Google Scholar]
- 31. Bustamante‐Fermosel A, De Miguel‐Yanes JM, Duffort‐Falco M, Munoz J. Mortality‐related factors after hospitalization for acute exacerbation of chronic obstructive pulmonary disease: the burden of clinical features. Am J Emerg Med 2007; 25: 515–22. [DOI] [PubMed] [Google Scholar]
- 32. Holguin F, Folch E, Redd SC, Mannino DM. Comorbidity and mortality in COPD‐related hospitalizations in the United States, 1979 to 2001. Chest 2005; 128: 2005–11. [DOI] [PubMed] [Google Scholar]
- 33. Slenter RH, Sprooten RT, Kotz D et al. Predictors of 1‐year mortality at hospital admission for acute exacerbations of chronic obstructive pulmonary disease. Respiration 2013; 85: 15–26. [DOI] [PubMed] [Google Scholar]
- 34. Steer J, Gibson GJ, Bourke SC. Predicting outcomes following hospitalization for acute exacerbations of COPD. QJM 2010; 103: 817–29. [DOI] [PubMed] [Google Scholar]
- 35. Roberts CM, Lowe D, Bucknall CE et al. Clinical audit indicators of outcome following admission to hospital with acute exacerbation of chronic obstructive pulmonary disease. Thorax 2002; 57: 137–41. [DOI] [PMC free article] [PubMed] [Google Scholar]
- 36. Roberts CM, Stone RA, Lowe D et al. Co‐morbidities and 90‐day Outcomes in Hospitalized COPD Exacerbations. COPD 2011; 8: 354–61. [DOI] [PubMed] [Google Scholar]
- 37. Roberts CM, Barnes S, Lowe D, Pearson MG. Evidence for a link between mortality in acute COPD and hospital type and resources. Thorax 2003; 58: 947–9. [DOI] [PMC free article] [PubMed] [Google Scholar]
- 38. Price LC, Lowe D, Hosker HS et al. UK National COPD Audit 2003: impact of hospital resources and organisation of care on patient outcome following admission for acute COPD exacerbation. Thorax 2006; 61: 837–42. [DOI] [PMC free article] [PubMed] [Google Scholar]
- 39. Lange P, Marott JL, Dahl M et al. Substantial need for early diagnosis, rehabilitation and treatment of chronic obstructive pulmonary disease. Dan Med J 2012; 59: A4396. [PubMed] [Google Scholar]
- 40. Nishimura K, Yasui M, Nishimura T, Oga T. Clinical pathway for acute exacerbations of chronic obstructive pulmonary disease: method development and five years of experience. Int J Chron Obstruct Pulmon Dis 2011; 6: 365–72. [DOI] [PMC free article] [PubMed] [Google Scholar]
- 41. Lugtenberg M, Burgers JS, Clancy C et al. Current guidelines have limited applicability to patients with comorbid conditions: a systematic analysis of evidence‐based guidelines. PLoS ONE 2011; 6: e25987. [DOI] [PMC free article] [PubMed] [Google Scholar]
Associated Data
This section collects any data citations, data availability statements, or supplementary materials included in this article.
Supplementary Materials
Data S1. List of researchers in the AUDIPOC Spain study group.
Table S1. Bivariate analysis of the associations between the hospital resources and organizational variables and the outcomes.
Table S2. Bivariate analysis of the associations between the patients’ demographic and clinical characteristics and the outcomes.
Table S3. Bivariate analysis of the associations between the diagnostic interventions and the outcomes.
Table S4. Bivariate analysis of the associations between the patient treatments at discharge and the three outcomes analyzed.