

Abstract
Objective
Assays for classifying HIV infections as ‘recent’ or ‘non-recent’ for incidence surveillance fail to simultaneously achieve large mean durations of ‘recent’ infection (MDRIs) and low ‘false-recent’ rates (FRRs), particularly in virally suppressed persons. The potential for optimizing recent infection testing algorithms (RITAs), by introducing viral load criteria and tuning thresholds used to dichotomize quantitative measures, is explored.
Design
The Consortium for the Evaluation and Performance of HIV Incidence Assays characterized over 2000 possible RITAs constructed from seven assays (LAg, BED, Less-sensitive Vitros, Vitros Avidity, BioRad Avidity, Architect Avidity and Geenius) applied to 2500 diverse specimens.
Methods
MDRIs were estimated using regression, and FRRs as observed ‘recent’ proportions, in various specimen sets. Context-specific FRRs were estimated for hypothetical scenarios. FRRs were made directly comparable by constructing RITAs with the same MDRI through the tuning of thresholds. RITA utility was summarized by the precision of incidence estimation.
Results
All assays produce high FRRs amongst treated subjects and elite controllers (10%-80%). Viral load testing reduces FRRs, but diminishes MDRIs. Context-specific FRRs vary substantially by scenario – BioRad Avidity and LAg provided the lowest FRRs and highest incidence precision in scenarios considered.
Conclusions
The introduction of a low viral load threshold provides crucial improvements in RITAs. However, it does not eliminate non-zero FRRs, and MDRIs must be consistently estimated. The tuning of thresholds is essential for comparing and optimizing the use of assays. The translation of directly measured FRRs into context-specific FRRs critically affects their magnitudes and our understanding of the utility of assays.
Introduction
The reliable measurement of HIV incidence is essential for monitoring the epidemic, and targeting and assessing interventions. However, traditional methods for estimating incidence often require cumbersome and costly longitudinal studies or multiple studies over time, or they rely on highly uncertain model inputs. Consequently, over the last twenty years, there has been much discourse on the estimation of HIV incidence from a single cross-sectional survey and a few well-estimable parameters [1-13]. This has been made possible by the advent of incidence assays, or, more generally, potentially complex multi-component recent infection testing algorithms (RITAs), which are used to classify the HIV infections detected in the incidence survey as ‘recently’ or ‘non-recently’ acquired.
In 2011, inconsistent methodologies led to the establishment of an independent body: the Consortium for the Evaluation and Performance of HIV Incidence Assays (CEPHIA), funded by the Bill & Melinda Gates Foundation, was tasked to coordinate efforts and conduct independent evaluations of RITAs [14]. Recent work by CEPHIA [12] indicates that currently prominent incidence assays, applied according to developers' previously published guidelines, fail to meet the requirements outlined in a widely-referenced Target Product Profile (TPP) [10, 15]. The TPP calls simultaneously for a sufficiently enduring state of ‘recent infection’ – averaging more than 6 months – and low probability of (false) ‘recent’ results at large times post infection – ideally zero, but definitely below 2% [16, 17]. The analyses showed that the assays produced extremely high false-recent rates (10%-80%) in virally-suppressed antiretroviral-treated subjects and elite controllers (ECs) [12]. These findings led to questions about the potential for optimizing the design of RITAs that utilize these immunoassays, including through the introduction of viral load criteria, as investigated in this work.
Results are provided below for the five incidence immunoassays previously described [12] – namely, Limiting Antigen (LAg) [18, 19], BED [20, 21], Detuned or Less-Sensitive (LS) Vitros [22], Vitros Avidity [22] and BioRad Avidity [23] – as well as the two immunoassays that have subsequently completed a full CEPHIA evaluation – Architect Avidity [24, 25] and Geenius [26, 27].
In this analysis, each RITA utilizes a single incidence immunoassay (IA) and, potentially, a viral load (VL) measure. As before, an IA measurement below some chosen IA threshold is interpreted as indicative of ‘recent’ infection, although this threshold is now allowed to vary. If supplemental VL testing is included, the VL measurement must additionally be above the chosen VL threshold to confirm the ‘recent’ result (which is otherwise changed to ‘non-recent’).
Two test characteristics are required to translate the incidence survey data, namely counts of HIV-negative, ‘recently’ infected HIV-positive and ‘non-recently’ infected HIV-positive subjects, into incidence estimates [11]:
The Mean Duration of ‘Recent’ Infection (MDRI) is the average time spent ‘recently’ infected within some time T after infection.
The False-Recent Rate (FRR) is the context-specific probability that an individual who is infected for longer than T will produce a ‘recent’ result.
Increasing the post-infection time cut-off T, which allows for consistent definitions of the MDRI and FRR, will generally appear to improve test performance – by increasing the MDRI and typically decreasing the FRR. However, a large T presents a number of limitations, including that the measured incidence represents an incidence averaged far into the past, and the MDRI becomes difficult to estimate and prone to varying by time and place (see supplementary content of [11] for a further discussion of T).
In this analysis, the test characteristics of the RITAs are estimated for each of a number of subpopulations. Different RITAs are constructed by varying the IA thresholds and VL thresholds, and considering a few values for the cut-off T. For a RITA to be of utility for incidence estimation, its MDRI should be large and FRR small, preferably zero [10, 15-17]. To illustrate the context-dependence of the FRR, demonstrative FRRs are calculated in hypothetical scenarios. A balanced comparison of the assays' FRRs is obtained by selecting IA thresholds so that all RITAs produced a similar MDRI.
Summary figures and tables of data and results are provided below, and a more exhaustive collection of analysis outputs is provided in Supplemental Digital Content 1 and 2 (SDC 1 and SDC 2).
Methods
The Specimen Set
The CEPHIA specimen repository, previously described [12], currently includes over 25000 HIV-1 positive specimens (about 12000 of which are plasma) drawn from approximately 3000 well-characterized subjects. In this work, RITAs were assessed using a carefully-selected subset of 2500 plasma specimens, termed the ‘Evaluation Panel’. In this panel, each of 928 subjects contribute 1 to 13 specimens drawn at different times post infection, and subjects are from the USA (52%), Zambia (20%), Rwanda (11%), Uganda (8%), Brazil (3%), South Africa (3%) and Kenya (3%). Viral load data was provided by the contributing studies for 1995 of the specimens.
Laboratory Procedures
All incidence IAs were applied independently in CEPHIA laboratories (at Blood Systems Research Institute, San Francisco and Public Health England, London) using standard operating procedures. The laboratory technicians were trained by the developers and blinded to the specimen background information, and controls were tested regularly to ensure stability of the assays and procedures. Testing protocols are available on the CEPHIA website [14].
Five assays have been previously summarized [12]: LAg aims to describe the avidity of HIV antibodies through a Normalized Optical Density (ODn) [18, 19]; BED captures the relative amount of immunoglobulin G that is specific to HIV, also as a Normalized Optical Density (ODn) [20, 21]; LS-Vitros quantifies the level of HIV antibodies as a Signal-to-Cutoff (S/C) value [22]; and Vitros Avidity [22] and BioRad Avidity [23] each measure antibody avidity as an Avidity Index (AI), reported as a percentage.
The Architect Avidity and Geenius assays, which have not been previously described, are summarized below.
Architect Avidity is based on a modification of the ARCHITECT HIV Ag/Ab Combo assay (Abbott Diagnostics; Wiesbaden; Germany) [24, 25], which is a chemiluminescent microparticle immunoassay for the detection of p24 antigens and HIV-1/2 antibodies. Each specimen is tested in the presence and absence of a chaotropic agent (guanidine), and the ratio of the reactivity (treated to untreated) produces an Avidity Index (AI), with measurements below 80% conventionally interpreted as representing ‘recent’ infection.
The Geenius HIV 1/2 Supplemental Assay (Bio-Rad Laboratories, Inc.; Hercules; CA) is a immunochromatographic assay in the form of a rapid test [26, 27]. The amount of HIV antibody that is specific to each of a number of antigens – namely gp36 and gp140 for HIV-2; and p31, gp160, p24 and gp41 for HIV-1 – is reported as a band intensity. For ‘recent’ infection testing, the developer proposes the use of a single summary quantitative measure, equal to the sum of the intensities for p31, gp160 and gp41, divided by the intensity for the control line. Referred to as the Geenius Index (GI), GI values below 1.5 are then interpreted as indicating ‘recent’ infection.
Tunable RITA Parameters
In this analysis, a RITA consists of a single incidence IA and a VL measure: ‘recent’ infection is identified by both the IA measurement being below the (tunable) IA threshold and the VL measurement being above the (tunable) VL threshold (effectively set to 0 in the case of no VL criteria).
Each RITA is defined by specifying which of the seven incidence IAs is used and selecting values for the three tunable parameters – the IA threshold, VL threshold and time cut-off T. Since the cut-off T is not viewed as a parameter that would be finely tuned in practice, values of 1, 2 and 3 years were considered. For each IA, a large number of IA thresholds were investigated, and VL thresholds of 0, 75, 250, 400, 1000 and 2000 copies/ml were used, allowing MDRI estimates to range from about a month to one and a half years and accommodating the varying limits of detection on viral load assays that may be used in practice.
Data Analysis: Data Preparation
CEPHIA repository and assay results data is stored in a MySQL relational database, and the analysis was performed in Matlab (R2014b, the MathWorksInc.).
In this analysis, a subject is considered to be ‘detectably infected’ if testing positive on an HIV viral lysate-based western blot assay. For each of the 56% of subjects with sufficient data (521 subjects), the subject's testing history was used to obtain the estimated (earliest) date of detectable infection (EDDI). These subjects had recorded dates of last HIV-negative and first HIV-positive diagnoses, at most 120 days apart, together with data on the types of diagnostic tests used. The EDDI was obtained using published delays between earliest detections of HIV by different diagnostic tests [28, 29]. 5% of these subjects also have recorded acute retroviral syndrome onset dates, which were instead used to estimate the EDDIs (refer to Methods in [12]). Field application requires adjustment of test characteristic estimates, most notably the MDRI estimates, according to the specific diagnostic protocol used (in this analysis, a western blot assay is considered to be used).
Data Analysis: Estimation of MDRIs and FRRs in Subpopulations
The test characteristics were evaluated in each of a number of subpopulations – created by stratifying by treatment history, subtype (based on country when not assay-confirmed), time since infection, VL and CD4+ T-cell count. The Study of the Consequences of the Protease Inhibitor Era (SCOPE) [30], which contributed specimens to the Evaluation Panel, purposefully recruited subjects who are virally suppressed in the absence of treatment, and these ECs were analyzed separately.
The MDRI was estimated by fitting a binomial regression model to the probability of testing ‘recent’, accounting for the subject-level clustering of data in the bootstrap construction of the 95% confidence intervals – see [12] for details. In addition to the primary parametric form of the model, two alternative forms were also fitted by way of a sensitivity analysis. In the primary analysis, all data points beyond after infection were discarded before model fitting, although a data exclusion cut-off of 2 × T was also considered in the sensitivity analysis.
A proxy FRR was estimated as the proportion of subjects infected for longer than T who test ‘recent’, using the majority classification for subjects with multiple results, and reporting Clopper-Pearson 95% confidence intervals.
Data Analysis: Context-Specific FRRs and RITA Performance
The FRRs estimated directly from the repository specimens do not represent any particular population-level FRR, which would depend in detail on the population's demographic and epidemiological history. To illustrate this context-dependence, FRRs were estimated for some demonstrative hypothetical scenarios, as outlined in detail in SDC 1. Furthermore, to allow for a fair comparison of the different assays within a scenario, IA thresholds were chosen so that the MDRI estimates for all RITAs were equal to some chosen value and then the corresponding context-dependent FRRs calculated. In a chosen scenario, for any specific MDRI value, the incidence assay with the lowest FRR provides the best RITA.
Such an analysis falls short of indicating which assay and IA threshold is optimal – where one could naturally define optimal as providing the most precise incidence estimation [16, 17]. Such an optimization warrants extensive additional analysis; in this work, the utility and potential of the RITAs is reported as the precision of the incidence estimator in chosen scenarios.
In summary of the methodology, scenarios were defined by specifying the (i) percentage of the long-infected population on treatment, termed the treatment coverage c; (ii) average time, in years, since infection in the untreated long-infected population at the time of the survey, m; and (iii) VL threshold used in the RITA (the time cut-off T equals 2 years). For each scenario, for each of the seven incidence assays, for each chosen MDRI value (ranging from 50 to 400 days, and obtained by appropriately selecting the IA threshold): a context-specific FRR was then calculated as a weighted average of the FRR amongst treated subjects (measured directly from the CEPHIA specimens) and FRR amongst untreated subjects (estimated by combining CEPHIA data with the times since infection existing in the hypothetical population) – see SDC 1 for further details.
The context-specific precision of the incidence estimator was then calculated, assuming exactly known RITA characteristics, an incidence survey size of 4000 subjects, and specifying HIV incidence and prevalence values for the scenarios (using the Delta method, shown to be highly accurate for this application in [11]). The precision is reported as two metrics: (i) the Relative Standard Error (RSE) of the incidence estimator; and (ii) the probability of obtaining an incidence estimate that lies within 0.5%, in absolute terms, of the true incidence. Lower RSEs and higher probabilities represent more reliable incidence estimation.
Due to the relatively simple scenario constructions (see SDC 1), uncertainties around estimates have not been formally quantified, and results should not be over interpreted. The scenarios, inspired by knowledge of real-word settings, are described alongside the results below.
Results
The data for Architect Avidity and Geenius are presented in Figure 1; 40% and 53% respectively of the specimens drawn within six months of infection are already ‘non-recent’, suggesting more transient states of ‘recent’ infection compared to the five previously reported assays [12] (at published IA thresholds). Treated subjects and SCOPE ECs again notably contribute ‘false-recent’ results.
Figure 1. Architect Avidity and Geenius Incidence Assay Results over Time since Infection.
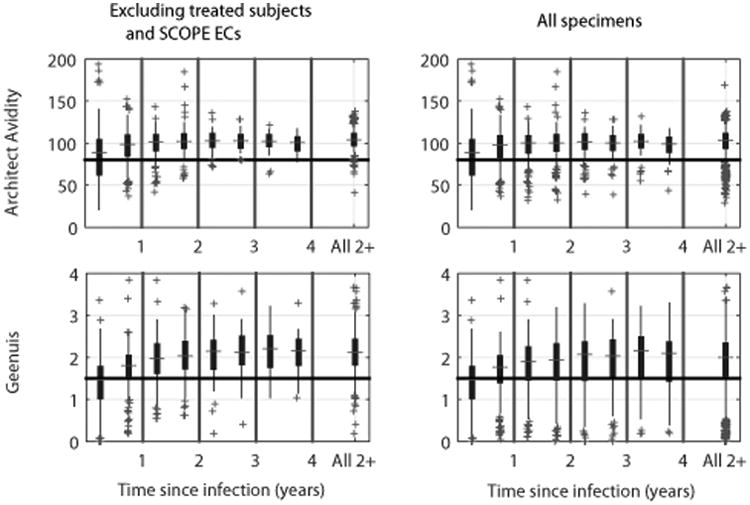
Box-and-whisker plots of assay measurements for each 6-month interval after infection until 4 years, and then for specimens drawn more than 2 years after infection. Left plots exclude treated subjects and SCOPE elite controllers. For each interval, the box and dividing line capture the central 50% and median of the measurements respectively; whiskers and crosses extend out to the remaining data points and outliers respectively (40-1000 data points per time interval). Based on developers' guidelines, measurements below the horizontal lines indicate ‘recent’ infections.
Tables 1 and 2 provide estimated test characteristics for each assay, for selected subpopulations and a few demonstrative values of the tunable RITA parameters. Results for all values of tunable parameters and subpopulations considered, as well as the MDRI sensitivity analyses, are provided in SDC 2.
Table 1. Estimated Mean Duration of Recent Infection (MDRI) and 95% confidence interval (days) for each assay – for demonstrative incidence immunoassay thresholds, viral load thresholds, and values of T; excluding treated subjects and SCOPE elite controllers.
| Assay (unit of measurement) | IA threshold | Ta = 2 years | T = 1 year | T = 3 years | ||
|---|---|---|---|---|---|---|
|
|
|
|||||
| No VL | VL threshold = 75 | VL threshold = 1000 | VL threshold = 75 | |||
| Lag (ODn) | 0.75 | 97 (82-115) | 88 (74-104) | 71 (58-85) | 82 (69-95) | 88 (74-105) |
| 1.5* | 184 (161-208) | 173 (151-195) | 141 (123-160) | 150 (134-166) | 176 (153-200) | |
| 3 | 405 (373-436) | 390 (360-420) | 346 (316-376) | 269 (251-286) | 453 (410-497) | |
| BED (ODn) | 0.4 | 172 (149-195) | 159 (138-181) | 129 (112-147) | 138 (122-154) | 173 (146-202) |
| 0.8* | 300 (270-329) | 286 (257-314) | 245 (219-272) | 220 (202-238) | 332 (292-375) | |
| 1.2 | 408 (377-440) | 393 (362-425) | 350 (319-382) | 270 (252-287) | 464 (417-513) | |
| LS-Vitros (S/C) | 10 | 186 (159-215) | 175 (149-202) | 141 (118-167) | 125 (108-143) | 220 (178-265) |
| 20* | 302 (270-335) | 288 (256-319) | 246 (217-278) | 197 (178-217) | 364 (313-416) | |
| 30 | 405 (370-439) | 390 (355-424) | 345 (311-380) | 253 (234-271) | 504 (448-560) | |
| Vitros Avidity (AI as %) | 40 | 127 (106-149) | 119 (99-141) | 93 (76-111) | 89 (75-103) | 138 (109-169) |
| 60* | 282 (250-313) | 268 (238-299) | 228 (199-258) | 193 (174-213) | 324 (279-373) | |
| 70 | 399 (366-431) | 384 (352-417) | 339 (307-372) | 255 (237-273) | 478 (427-531) | |
| BioRadAvidity (AI as %) | 10 | 129 (113-146) | 124 (109-140) | 111 (95-127) | 111 (97-124) | 133 (114-153) |
| 30* | 293 (263-323) | 280 (252-309) | 248 (221-277) | 216 (198-235) | 310 (274-347) | |
| 60 | 414 (382-445) | 400 (369-432) | 356 (326-389) | 279 (263-296) | 467 (423-514) | |
| Architect Avidity AI as %) | 70 | 88 (69-109) | 83 (64-103) | 75 (57-96) | 70 (56-85) | 86 (65-109) |
| 80* | 128 (106-152) | 122 (100-146) | 109 (89-133) | 100 (84-118) | 130 (104-158) | |
| 100 | 389 (356-423) | 375 (342-408) | 328 (294-361) | 226 (206-247) | 507 (457-556) | |
| Geenius (GI) | 1.25 | 110 (88-134) | 97 (78-118) | 72 (57-88) | 73 (59-88) | 110 (88-134) |
| 1.5* | 179 (154-205) | 163 (141-186) | 129 (110-148) | 123 (107-140) | 201 (174-229) | |
| 1.75 | 327 (299-355) | 311 (285-338) | 267 (241-293) | 212 (195-229) | 390 (355-426) | |
AI, avidity index; GI, Geenius index; IA, immunoassay; ODn, normalized optical density; S/C, signal-to-cutoff; VL, viral load (in copies/ml);
threshold based on developer guidelines.
Number of subjects (number of data points) used in estimation: 283 (627) for T = 1 year, 397 (965) for T = 2 years and 408 (1187) for T = 3 years.
Table 2. Estimated False-Recent Rate (FRR) and 95% confidence interval (%) for each assay – for demonstrative incidence immunoassay thresholds, viral load thresholds, and values of T; for different subpopulations.
| Assay (unit) | IA threshold | Subgroupb | Ta = 2 years | T = 1 year | T = 3 years | ||
|---|---|---|---|---|---|---|---|
|
|
|
||||||
| No VL | VL threshold = 75 | VL threshold = 1000 | VL threshold = 75 | ||||
| Lag (ODn) | 1.5* | Not Tx/EC | 1.5 (0.3-4.4) | 1.5 (0.3-4.4) | 1.5 (0.3-4.4) | 4.7 (2.7-7.5) | 1.7 (0.2-5.8) |
| Tx | 58.8 (49.2-68.0) | 0c | 0 | 0 | 0 | ||
| EC | 14.3 (4.0-32.7) | 0 | 0 | 0 | 0 | ||
| 3 | Not Tx/EC | 14.4 (9.8-20.1) | 13.6 (9.2-19.2) | 12.4 (8.1-17.8) | 24.4 (19.9-29.4) | 7.0 (3.2-13.1) | |
| BED (ODn) | 0.8* | Not Tx/EC | 9.1 (5.5-14.0) | 8.3 (4.9-13.1) | 7.6 (4.3-12.2) | 13.4 (9.9-17.5) | 5.4 (2.1-11.0) |
| Tx | 65.9 (56.4-74.6) | 0 | 0 | 0 | 0 | ||
| EC | 21.4 (8.3-41.0) | 0 | 0 | 0 | 0 | ||
| 1.2 | Not Tx/EC | 14.4 (9.8-20.1) | 13.6 (9.2-19.2) | 12.6 (8.3-18.1) | 23.5 (19.0-28.4) | 9.5 (4.9-16.2) | |
| LS-Vitros (S/C) | 20* | Not Tx/EC | 13.1 (8.8-18.6) | 12.4 (8.1-17.8) | 10.6 (6.7-15.8) | 16.7 (12.9-21.2) | 10.3 (5.5-17.2) |
| Tx | 76.1 (67.2-83.6) | 0 | 0 | 0 | 0 | ||
| EC | 46.4 (27.5-66.1) | 0 | 0 | 0 | 0 | ||
| 30 | Not Tx/EC | 21.2 (15.7-27.6) | 20.5 (15.1-26.8) | 17.9 (12.9-24.0) | 27.0 (22.3-32.1) | 17.8 (11.4-25.8) | |
| Vitros Avidity (AI as %) | 60* | Not Tx/EC | 9.8 (6.1-14.9) | 9.1 (5.5-14.0) | 8.1 (4.7-12.8) | 13.3 (9.8-17.4) | 10.3 (5.5-17.2) |
| Tx | 72.6 (63.4-80.5) | 0 | 0 | 0 | 0 | ||
| EC | 32.1 (15.9-52.4) | 0 | 0 | 0 | 0 | ||
| 70 | Not Tx/EC | 17.4 (12.4-23.4) | 16.7 (11.8-22.6) | 14.1 (9.6-19.8) | 24.7 (20.2-29.7) | 15.7 (9.7-23.4) | |
| BioRadAvidity (AI as %) | 30* | Not Tx/EC | 7.1 (3.9-11.6) | 6.6 (3.5-11.0) | 6.6 (3.5-11.0) | 11.9 (8.6-15.9) | 3.3 (0.9-8.2) |
| Tx | 42.4 (33.1-52.1) | 0 | 0 | 0 | 0 | ||
| EC | 10.7 (2.3-28.2) | 0 | 0 | 0 | 0 | ||
| 60 | Not Tx/EC | 18.2 (13.1-24.3) | 17.4 (12.4-23.4) | 16.9 (12.0-22.9) | 25.6 (21.0-30.7) | 13.2 (7.8-20.6) | |
| Architect Avidity (AI as %) | 80* | Not Tx/EC | 1.5 (0.3-4.4) | 1.5 (0.3-4.4) | 1.5 (0.3-4.4) | 2.6 (1.1-4.9) | 2.9 (0.7-7.7) |
| Tx | 33.6 (25.0-43.1) | 0 | 0 | 0 | 0 | ||
| EC | 10.7 (2.3-28.2) | 0 | 0 | 0 | 0 | ||
| 100 | Not Tx/EC | 33.3 (26.8-40.4) | 32.1 (25.6-39.1) | 30.6 (24.2-37.5) | 34.6 (29.5-40.0) | 34.3 (25.9-43.5) | |
| Geenius (GI) | 1.5* | Not Tx/EC | 6.1 (3.2-10.3) | 5.1 (2.4-9.1) | 5.1 (2.4-9.1) | 6.5 (4.1-9.7) | 7.0 (3.2-13.1) |
| Tx | 66.4 (56.9-75.0) | 0 | 0 | 0 | 0 | ||
| EC | 33.9 (17.2-54.2) | 0 | 0 | 0 | 0 | ||
| 1.75 | Not Tx/EC | 13.6 (9.2-19.2) | 12.9 (8.6-18.4) | 11.4 (7.3-16.6) | 17.0 (13.1-21.5) | 11.6 (6.5-18.7) | |
AI, avidity index; EC, elite controller; GI, Geenius index; IA, immunoassay; ODn, normalized optical density; S/C, signal-to-cutoff; Tx, treated; VL, viral load (in copies/ml);
threshold based on developer guidelines
‘Not Tx/EC’ excludes treated subjects and SCOPE elite controllers, ‘Tx’ subjects have had at least 3 months of uninterrupted treatment, ‘EC’ contains elite controllers identified in the SCOPE cohort.
Number of subjects (number of data points) used in estimation: 332 (873) for Not Tx/Ec, 140 (247) for Tx, 28 (86) for EC for T = 1 year; 198 (448), 112 (185) and 28 (82) respectively for T = 2 years; 121 (226), 91 (144) and 28 (72) respectively for T = 3 years.
False-recent rates amongst Tx and EC are zero, by repository design, once a VL threshold is introduced.
For T = 2 years, the MDRI estimates reduce by 3%-11% when introducing a VL threshold of 75 copies/ml, and by 13%-35% for a VL threshold of 1000 copies/ml. However, FRR estimates for the ‘non-challenge’ subpopulation are barely impacted by the introduction of any viral load criteria. By repository design, the ‘challenge’ specimens from treated subjects and ECs have undetectable, rather than just low, VLs, and therefore there is a dramatic drop in FRRs to zero using a VL threshold of 75 copies/ml. These MDRI and FRR results together suggest that the optimal VL threshold is one that is very low, as the primary reduction in the FRR is already seen, and any further increases in the threshold simply diminish the MDRI.
When considering the post-infection time cut-off T, the ‘non-challenge’ FRR estimates decrease substantially moving from 1 year to 2 years, with marginal benefit obtained from further increases in T. The remainder of the analysis and interpretation considers a cut-off T of 2 years, as proposed in earlier CEPHIA reports [12].
The results in Tables 1 and 2 highlight how differently the developer IA thresholds have been selected, in terms of the resulting test characteristics. For example, the MDRI and ‘non-challenge’ FRR estimates for Architect Avidity are 122 days and 1.5% respectively, while they are much larger for LS-Vitros at 288 days and 12.4% respectively (for a VL threshold of 75 copies/ml) – leading to seemingly very differently behaving incidence assays. However, by increasing the Architect Avidity IA threshold and/or decreasing the LS-Vitros threshold appropriately, one can obtain almost identical test characteristics for the two assays (see SDC 2).
Figure 2 shows rough context-specific FRR estimates, as a function of the MDRI (encoding IA threshold), for hypothetical Scenarios A-F. Additional scenarios are presented in SDC 1. The assays performing the best – that is, providing the lowest lines – vary by scenario and even MDRI value.
Figure 2. Context-specific FRR, by MDRI value, per assay, for Scenarios A-F.

Each scenario has the specified: treatment coverage c, VL threshold used in the RITA (copies/ml), and mean years since infection in the untreated population m. For each incidence assay, the IA threshold is varied to obtain the chosen MDRI (x-axis), and corresponding FRR calculated (y-axis). The circles correspond to developers' proposed IA thresholds.
Scenarios A and B, in which there is neither treatment nor VL criteria, illustrate how the ‘non-challenge’ FRR estimated directly from a sample of specimens does not necessarily represent any real-world population, and specimen data needs to be weighted by the times since infection expected in the population. For example, at the developer BioRad Avidity IA threshold, the FRR estimate decreases from 7.1% (Table 2) to 0.8% (Scenario A) or 2.2% (Scenario B).
Scenarios C and D, in which treatment is introduced but there is still no VL criteria, illustrate the escalation in the overall FRR through viral suppression in the population. Different assays become the frontrunners in different scenarios, but none would be of utility at high treatment coverage rates.
Scenarios E and F, which additionally introduce VL criteria, illustrate how the FRR is then driven down. Paradoxically, a higher treatment coverage produces a lower overall FRR because the FRR amongst treated subjects, who are all virally-suppressed by sample design, is 0%.
Table 3 provides the context-specific FRRs for selected values of the MDRI, together with IA thresholds and the implied precision of incidence estimation, for Scenarios I to III. Scenario I captures a recent outbreak of HIV; Scenario II, a sustained epidemic with some treatment; and Scenario III, declining incidence and high treatment coverage.
Table 3. Context-specific False-Recent Rates (FRRs) and precision of incidence estimation, for demonstrative Mean Duration of Recent Infection (MDRI) values (with corresponding immunoassay thresholds), per assay, in hypothetical Scenarios I-III.
| MDRI | Assay | Scenario I: No treatment, no VL, mean time infected m = 5 years, incidence = 3% per person year, prevalence = 12% |
Scenario II: Treatment coverage c = 20%, VL threshold = 75 copies/ml, mean time infected m = 10 years, incidence = 2% per person year, prevalence = 20% |
Scenario III: Treatment coverage c = 80%, VL threshold = 75 copies/ml, mean time infected m = 5 years, incidence = 1% per person year, prevalence = 40% |
|||||||||
|---|---|---|---|---|---|---|---|---|---|---|---|---|---|
|
|
|
|
|||||||||||
| IA Threshold |
FRR (%) |
RSE (%)a |
Within 0.5% (%)b |
IA Threshold |
FRR (%) |
RSE (%)a |
Within 0.5% (%)b |
IA Threshold |
FRR (%) |
RSE (%)a |
Within 0.5% (%)b |
||
| 200 | LAg | 1.7 | 0.9 | 13.8 | 77.1 | 1.9 | 0.2 | 17.4 | 84.8 | 1.9 | 0.2 | 30.2 | 90.2 |
| BED | 0.5 | 2.8 | 15.3 | 72.5 | 0.5 | 0.9 | 18.8 | 81.5 | 0.5 | 0.6 | 36.7 | 82.7 | |
| LS-Vitros | 11.3 | 6.3 | 18.5 | 63.4 | 12.5 | 1.7 | 20.5 | 77.7 | 12.5 | 1.1 | 43.8 | 74.6 | |
| Vitros Avidity | 49.0 | 4.8 | 17.0 | 67.3 | 50.9 | 1.5 | 20.0 | 78.8 | 50.9 | 1.0 | 41.9 | 76.7 | |
| BioRad Avidity | 14.7 | 1.2 | 14.0 | 76.5 | 15.6 | 0.4 | 17.8 | 84.1 | 15.6 | 0.3 | 31.8 | 88.4 | |
| Architect Avidity | 89.6 | 5.6 | 17.8 | 65.1 | 90.3 | 1.9 | 20.9 | 76.9 | 90.3 | 1.2 | 44.8 | 73.5 | |
| Geenius | 1.5 | 5.6 | 17.8 | 65.0 | 1.6 | 1.7 | 20.6 | 77.6 | 1.6 | 1.2 | 44.0 | 74.4 | |
| 300 | LAg | 2.5 | 4.3 | 12.4 | 82.2 | 2.5 | 1.3 | 15.3 | 89.8 | 2.5 | 0.9 | 29.7 | 90.8 |
| BED | 0.8 | 6.2 | 13.2 | 79.5 | 0.8 | 1.8 | 15.9 | 88.5 | 0.8 | 1.2 | 32.1 | 88.0 | |
| LS-Vitros | 19.9 | 8.0 | 14.0 | 76.6 | 20.8 | 2.3 | 16.4 | 87.3 | 20.8 | 1.6 | 34.6 | 85.2 | |
| Vitros Avidity | 61.6 | 7.7 | 13.8 | 77.1 | 62.8 | 2.2 | 16.2 | 87.6 | 62.8 | 1.5 | 33.9 | 86.0 | |
| BioRad Avidity | 32.0 | 2.8 | 11.8 | 84.2 | 35.7 | 0.8 | 14.8 | 90.9 | 35.7 | 0.6 | 27.5 | 93.1 | |
| Architect Avidity | 95.6 | 12.8 | 16.7 | 68.3 | 96.2 | 4.3 | 18.6 | 82.1 | 96.2 | 2.8 | 42.7 | 75.8 | |
| Geenius | 1.7 | 8.5 | 14.2 | 75.9 | 1.7 | 2.5 | 16.6 | 86.8 | 1.7 | 1.7 | 35.4 | 84.3 | |
FRR, false-recent rate; IA, immunoassay; MDRI, mean duration of ‘recent’ infection; RSE, relative standard error; VL, viral load.
The standard deviation of the incidence estimator divided by its mean.
The probability of a single incidence estimate lying within 0.5% (in absolute terms) of the true incidence value.
Discussion
As highlighted by earlier work by CEPHIA and other groups [6-8, 10, 12, 31, 32], incidence IAs used in stand-alone form fail to simultaneously achieve usefully large MDRIs and consistently low FRRs, and produce high FRRs in virally suppressed subpopulations. Also, previously proposed assay thresholds, for distinguishing ‘recent’ from ‘non-recent’ HIV infections, may be significantly suboptimal; and there is a need to choose an appropriate post-infection time cut-off T which completes the definition of the required test characteristics.
This work therefore investigated the characteristics of RITAs that identify ‘recent’ infection by an IA measurement below an IA threshold and VL measurement above a VL threshold, for a number of values of the tunable parameters. Each of the first seven assays that have completed a full CEPHIA evaluation were presented, namely LAg, BED, LS-Vitros, Vitros Avidity, BioRad Avidity, Architect Avidity and Geenius. To demonstrate the context-dependence of FRRs and directly compare the assays, results were also presented as context-specific FRR estimates, for each of a number of hypothetical scenarios, with IA thresholds chosen so that all RITAs have the same MDRI. The context-dependent RITA performance, as measured by the precision of incidence estimation, was also shown.
Results highlight that the inclusion of VL measurements is essential for moving the current incidence assays into regimes of utility. The VL threshold should be low, as further increasing the threshold reduces the MDRI with little impact on the FRR. In practice, the minimum viral loads that are detectable by available assays would likely drive the choice of VL threshold. The reduction in MDRI from VL criteria also highlights the importance of estimating the MDRI consistently with the RITA design – a point sometimes missed in the focus on FRR reduction. While the introduction of viral load criteria, by repository design, produces a zero FRR in the virally suppressed subpopulations, non-zero FRRs persist in the remaining subpopulations, even at high VL thresholds.
Large values of the post-infection time cut-off T generally appear to improve test performance, but present a number of practical limitations. For current incidence assays, a default value for T of 2 years appears reasonable, subject to review in light of data on any specific RITA.
While published studies of incidence assays suggest that they have very different characteristics, this analysis shows that sensible tuning of IA thresholds, away from previous developer recommendations, reveals relatively similar performance of the assays.
The context-specific FRRs, when constructing the RITAs to have similar MDRIs, and precision of incidence estimation, suggest that BioRad Avidity and LAg appear to be the frontrunners, although performance is context-dependent and other assays can follow closely.
While a general approach for better understanding the characteristics and utility of assays in the real-world is presented in this work, in the analysis of real cross-sectional data obtained at substantial cost, more sophistication should be applied in blending available data into context-specific FRRs with a credible uncertainty estimate. Additionally, data on subpopulations currently not in the CEPHIA repository – such as treated subjects who are not yet, or failing to remain, virally suppressed – should be considered.
Numerous such details remain to be further explored – including test refinements from possible combinations of serological or other markers in addition to viral load. This is part of ongoing work within and beyond CEPHIA [33, 34].
The importance of viral load as a marker of HIV infection is not just limited to its use in incidence estimation. The greater care required in the handling of specimens for reliable viral load determination, and the increased need for well-preserved specimens in advanced studies, such as next generation sequencing, reinforces that specimens should be processed quickly after collection and stored appropriately.
While this surveillance approach offers solutions to some of the obstacles posed by traditional incidence estimation methods, this work highlights that there remains a number of conceptual complexities and nuances to be understood by users. Further promise of this approach arises from the potential use of these assays to both diagnosis HIV infection as well as provide information on the staging of infection, using the same specimen.
In conclusion: (1) VL testing provides a crucial advance in the performance of currently available RITAs, but this does not eliminate the non-zero FRRs and the MDRI must be estimated consistently with the RITA design. (2) Tuning of thresholds is essential for balanced comparison of assays and the optimization of RITA performance. (3) The translation of FRR estimates, measured directly from samples of specimens, into context-specific FRR estimates greatly changes their magnitudes and is critical for the application of the assays.
Supplementary Material
Supplemental Digital Content 1: ‘SDC1_ContextFRRs.pdf’
Supplemental Digital Content 2: ‘SDC2_Outputs.xlsx’
Supplemental Digital Content 3: ‘SDC3_Acknowledgments.pdf’
Acknowledgments
GM, AW, MPB and CPD conceived the study design and sourced funding. RK and AW led the consolidation of data; and the data analysis design, implementation and interpretation. CDP, SNF, SJL, MAP, JNM, EGK and FMH led on specimen acquisition and related data collection. GM, MPB, SMK and EM led on assay performance and quality, and assay results reporting. RK drafted and edited the article and supplementary material. All authors assisted in the interpretation of findings, provided input and suggestions for analysis, contributed to and reviewed the article. Funding for this project was provided by the Bill and Melinda Gates Foundation (grant OPP1017716).
The authors acknowledge with thanks Mila Lebedeva and Eve Draper for laboratory testing; Bio-Rad Laboratories, Inc. for providing reagents, as well as Paul Contestable and Ortho Clinical Diagnostics, Inc.; David Matten for database support and Eduard Grebe for administering the execution of select program scripts; the assay developers who supplied training in their assays; and the CEPHIA steering group for their advice and suggestions on the data outputs of this work. Members of CEPHIA and individuals contributing to the overall project, not appearing as authors, are listed in Supplementary Digital Content 3.
IAVI's work is made possible by generous support from many donors including: the Bill & Melinda Gates Foundation; the Ministry of Foreign Affairs of Denmark; Irish Aid; the Ministry of Finance of Japan; the Ministry of Foreign Affairs of the Netherlands; the Norwegian Agency for Development Cooperation (NORAD); the United Kingdom Department for International Development (DFID); and the United States Agency for International Development (USAID). The full list of IAVI donors is available at www.iavi.org. This report is made possible by the generous support of the American people through USAID. The contents are the responsibility of the International AIDS Vaccine Initiative and do not necessarily reflect the views of USAID or the United States Government. Funding was also provided by the OPEC Fund for International Development (OFID), a development finance institution of the OPEC Member States, established to provide financial support for socio-economic development, particularly for low-income countries.
The San Diego Primary Infection Cohort acknowledges funding by the National Institutes of Health (NIH, grants AI43638, AI74621, AI106039, MH100974 and IA036214), and the California HIV-1 Research Program (CHRP, grant RN07-SD-702).
The São Paulo Cohort acknowledges funding by the Brazilian Ministry of Health, Brazilian Program for STD and AIDS (grant 914/BRA/3014-UNESCO) and the São Paulo City Health Department (grant 2004-0.168.922–7).
The SCOPE Study received funding from the NIH (grants P30 AI027763 and R24 AI067039).
The AMPLIAR and Options Cohorts also received funding from the NIH (grants P01 AI071713 and R01 HD074511).
Conflicts of interest and sources of funding: All authors, as members or collaborators of the Consortium for the Evaluation and Performance of HIV Incidence Assays (CEPHIA), are supported by a grant from the Bill and Melinda Gates Foundation (OPP1017716). Specimen collection was funded in part by grants from the US National Institutes of Health (P01 AI071713, R01 HD074511, P30 AI027763, R24 AI067039, R34 MH096606, AI43638, AI74621, AI106039, MH100974 and AI036214); California HIV-1 Research Program (RN07-SD-702); Brazilian Program for STD and AIDS, Ministry of Health (914/BRA/3014-UNESCO); and São Paulo City Health Department (2004-0.168.922–7).
CDP has an ongoing grant from Bio-Rad Laboratories, Inc., through the University of California, San Francisco, for the conduct of an unrelated clinical trial. MPB has received research funding from Bio-Rad Laboratories, Inc. and Ortho Clinical Diagnostics, Inc., provided to Blood Systems Research Institute, to support evaluations of their respective assays. SJL has received research funding from Gilead Sciences.
References
- 1.Brookmeyer R, Quinn TC. Estimation of current human immunodeficiency virus incidence rates from a cross-sectional survey using early diagnostic tests. Am J Epidemiol. 1995;141:166–172. doi: 10.1093/oxfordjournals.aje.a117404. [DOI] [PubMed] [Google Scholar]
- 2.Janssen RS, Satten GA, Stramer SL, Rawal BD, O'Brien TR, Weiblen BJ, et al. New testing strategy to detect early HIV-1 infection for use in incidence estimates and for clinical and prevention purposes. JAMA. 1998;280:42–48. doi: 10.1001/jama.280.1.42. [DOI] [PubMed] [Google Scholar]
- 3.Kaplan EH, Brookmeyer R. Snapshot estimators of recent HIV incidence rates. Oper Res. 1999;47:29–37. [Google Scholar]
- 4.McDougal JS, Parekh BS, Peterson ML, Branson BM, Dobbs T, Ackers M, et al. Comparison of HIV type 1 incidence observed during longitudinal follow-up with incidence estimated by cross-sectional analysis using the BED capture enzyme immunoassay. AIDS Res Hum Retroviruses. 2006;22:945–952. doi: 10.1089/aid.2006.22.945. [DOI] [PubMed] [Google Scholar]
- 5.Hargrove JW, Humphrey JH, Mutasa K, Parekh BS, McDougal JS, Ntozini R, et al. Improved HIV-1 incidence estimates using the BED capture enzyme immunoassay. AIDS. 2008;22:511–518. doi: 10.1097/QAD.0b013e3282f2a960. [DOI] [PubMed] [Google Scholar]
- 6.Murphy G, Parry JV. Assays for the detection of recent infections with human immunodeficiency virus type 1. Euro Surveill. 2008;13:4–10. [PubMed] [Google Scholar]
- 7.Busch MP, Pilcher CD, Mastro TD, Kaldor J, Vercauteren G, Rodriguez W, et al. Beyond detuning: 10 years of progress and new challenges in the development and application of assays for HIV incidence estimation. AIDS. 2010;24:2763–2771. doi: 10.1097/QAD.0b013e32833f1142. [DOI] [PubMed] [Google Scholar]
- 8.Mastro TD, Kim AA, Hallett T, Rehle T, Welte A, Laeyendecker O, et al. Estimating HIV incidence in populations using tests for recent infection: Issues, challenges and the way forward. J HIV AIDS Surveill Epidemiol. 2010;2:1–14. [PMC free article] [PubMed] [Google Scholar]
- 9.McWalter TA, Welte A. Relating recent infection prevalence to incidence with a sub-population of assay non-progressors. J Math Biol. 2010;60:687–710. doi: 10.1007/s00285-009-0282-7. Epub 2009. [DOI] [PubMed] [Google Scholar]
- 10.Incidence Assay Critical Path Working Group. More and better information to tackle HIV epidemics: towards improved HIV incidence assays. PLoS Med. 2011;8:e1001045. doi: 10.1371/journal.pmed.1001045. [DOI] [PMC free article] [PubMed] [Google Scholar]
- 11.Kassanjee R, McWalter TA, Barnighausen T, Welte A. A new general biomarker-based incidence estimator. Epidemiology. 2012;23:721–728. doi: 10.1097/EDE.0b013e3182576c07. [DOI] [PMC free article] [PubMed] [Google Scholar]
- 12.Kassanjee R, Pilcher CD, Keating SM, Facente SN, McKinney E, Price MA, et al. Independent assessment of candidate HIV incidence assays on specimens in the CEPHIA repository. AIDS. 2014;28:2439–2449. doi: 10.1097/QAD.0000000000000429. [DOI] [PMC free article] [PubMed] [Google Scholar]
- 13.Hargrove J, van Schalkwyk C, Eastwood H. BED estimates of HIV incidence: resolving the differences, making things simpler. PLoS One. 2012;7:e29736. doi: 10.1371/journal.pone.0029736. [DOI] [PMC free article] [PubMed] [Google Scholar]
- 14. [Accessed 3 April 2016];The Consortium for the Evaluation and Performance of HIV Incidence Assays (CEPHIA) http://www.incidence-estimation.com/page/cephia.
- 15. [Accessed 3 April 2016];Bill & Melinda Gates Foundation Letters of Inquiry (LOI): New biomarkers for HIV incidence measurement. https://docs.gatesfoundation.org/Documents/hiv-incidence-rules-and-guidelines.pdf.
- 16.Welte A, McWalter TA, Laeyendecker O, Hallett TB. Using tests for recent infection to estimate incidence: problems and prospects for HIV. Euro Surveill. 2010;15 [PMC free article] [PubMed] [Google Scholar]
- 17.Kassanjee R, McWalter TA, Welte A. Defining optimality of a test for recent infection for HIV incidence surveillance. AIDS Res Hum Retroviruses. 2014;30:45–49. doi: 10.1089/aid.2013.0113. [DOI] [PMC free article] [PubMed] [Google Scholar]
- 18.Duong YT, Qiu M, De AK, Jackson K, Dobbs T, Kim AA, et al. Detection of recent HIV-1 infection using a new limiting-antigen avidity assay: potential for HIV-1 incidence estimates and avidity maturation studies. PLoS One. 2012;7:e33328. doi: 10.1371/journal.pone.0033328. [DOI] [PMC free article] [PubMed] [Google Scholar]
- 19.Sedia Biosciences Corporation. Sedia HIV-1 LAg-Avidity EIA: single well avidity enzyme immunoassay for detection of recent HIV-1 infection using liquid serum or plasma, Cat. No. 1002. [Accessed 3 April 2016];2014 www.sediabio.com/LiteratureRetrieve.aspx?ID=127076.
- 20.Parekh BS, Kennedy MS, Dobbs T, Pau CP, Byers R, Green T, et al. Quantitative detection of increasing HIV type 1 antibodies after seroconversion: a simple assay for detecting recent HIV infection and estimating incidence. AIDS Res Hum Retroviruses. 2002;18:295–307. doi: 10.1089/088922202753472874. [DOI] [PubMed] [Google Scholar]
- 21.Sedia Biosciences Corporation. Sedia BED HIV-1 Incidence EIA: enzyme immunoassay for population estimates of HIV-1 incidence, Cat. No. 1000. [Accessed 3 April 2016];2014 http://www.sediabio.com/LiteratureRetrieve.aspx?ID=127077.
- 22.Keating SM, Hanson D, Lebedeva M, Laeyendecker O, Ali-Napo NL, Owen SM, et al. Lower-sensitivity and avidity modifications of the vitros anti-HIV 1+2 assay for detection of recent HIV infections and incidence estimation. J Clin Microbiol. 2012;50:3968–3976. doi: 10.1128/JCM.01454-12. [DOI] [PMC free article] [PubMed] [Google Scholar]
- 23.Masciotra S, Dobbs T, Candal D, Hanson D, Delaney K, Rudolph D, et al. Antibody avidity-based assay for identifying recent HIV-1 infections Based on Genetic Systems™ 1/2 Plus O EIA [Abstract]. Abstract 937 at the 17th Conference on Retroviruses and Opportunistic Infections; San Francisco, CA. 2010. [Google Scholar]
- 24.Suligoi B, Rodella A, Raimondo M, Regine V, Terlenghi L, Manca N, et al. Avidity Index for anti-HIV antibodies: comparison between third- and fourth-generation automated immunoassays. J Clin Microbiol. 2011;49:2610–2613. doi: 10.1128/JCM.02115-10. [DOI] [PMC free article] [PubMed] [Google Scholar]
- 25.Abbott Laboratories. ARCHITECT HIV Ag/Ab Combo Reagent Insert. [Accessed 3 April 2016];2014 http://www.fda.gov/downloads/BiologicsBloodVaccines/…/UCM216309.p.
- 26.Montesinos I, Eykmans J, Delforge ML. Evaluation of the Bio-Rad Geenius HIV-1/2 test as a confirmatory assay. J Clin Virol. 2014;60:399–401. doi: 10.1016/j.jcv.2014.04.025. [DOI] [PubMed] [Google Scholar]
- 27.Bio-Rad Laboratories. Geenius™ HIV 1/2 Supplemental Assay Instructions For Use. [Accessed 3 April 2016];2014 http://www.fda.gov/downloads/BiologicsBloodVaccines/BloodBloodProducts/ApprovedProducts/PremarketApprovalsPMAs/UCM420735.pdf.
- 28.Fiebig EW, Wright DJ, Rawal BD, Garrett PE, Schumacher RT, Peddada L, et al. Dynamics of HIV viremia and antibody seroconversion in plasma donors: implications for diagnosis and staging of primary HIV infection. AIDS. 2003;17:1871–1879. doi: 10.1097/00002030-200309050-00005. [DOI] [PubMed] [Google Scholar]
- 29.Masciotra S, McDougal JS, Feldman J, Sprinkle P, Wesolowski L, Owen SM. Evaluation of an alternative HIV diagnostic algorithm using specimens from seroconversion panels and persons with established HIV infections. J Clin Virol. 2011;52 Suppl 1:S17–22. doi: 10.1016/j.jcv.2011.09.011. [DOI] [PubMed] [Google Scholar]
- 30.Hunt PW, Brenchley J, Sinclair E, McCune JM, Roland M, Page-Shafer K, et al. Relationship between T cell activation and CD4+ T cell count in HIV-seropositive individuals with undetectable plasma HIV RNA levels in the absence of therapy. J Infect Dis. 2008;197:126–133. doi: 10.1086/524143. [DOI] [PMC free article] [PubMed] [Google Scholar]
- 31.Laeyendecker O, Brookmeyer R, Oliver AE, Mullis CE, Eaton KP, Mueller AC, et al. Factors associated with incorrect identification of recent HIV infection using the BED capture immunoassay. AIDS Res Hum Retroviruses. 2012;28:816–822. doi: 10.1089/aid.2011.0258. [DOI] [PMC free article] [PubMed] [Google Scholar]
- 32.Longosz AF, Mehta SH, Kirk GD, Margolick JB, Brown J, Quinn TC, et al. Incorrect identification of recent HIV infection in adults in the United States using a limiting-antigen avidity assay. AIDS. 2014;28:1227–1232. doi: 10.1097/QAD.0000000000000221. [DOI] [PMC free article] [PubMed] [Google Scholar]
- 33.Brookmeyer R, Konikoff J, Laeyendecker O, Eshleman SH. Estimation of HIV incidence using multiple biomarkers. Am J Epidemiol. 2013;177:264–272. doi: 10.1093/aje/kws436. [DOI] [PMC free article] [PubMed] [Google Scholar]
- 34.Laeyendecker O, Piwowar-Manning E, Fiamma A, Kulich M, Donnell D, Bassuk D, et al. Estimation of HIV incidence in a large, community-based, randomized clinical trial: NIMH Project Accept (HIV Prevention Trials Network 043) PLoS One. 2013;8:e68349. doi: 10.1371/journal.pone.0068349. [DOI] [PMC free article] [PubMed] [Google Scholar]
Associated Data
This section collects any data citations, data availability statements, or supplementary materials included in this article.
Supplementary Materials
Supplemental Digital Content 1: ‘SDC1_ContextFRRs.pdf’
Supplemental Digital Content 2: ‘SDC2_Outputs.xlsx’
Supplemental Digital Content 3: ‘SDC3_Acknowledgments.pdf’