

Abstract
Purpose
The identification of personalized germline markers with biological relevance for the prediction of cutaneous melanoma (CM) prognosis is highly demanded but to date it has been largely unsuccessful. As melanoma progression is controlled by host immunity, here we present a novel approach interrogating immunoregulatory pathways using the genome-wide maps of expression quantitative trait loci (eQTL) to reveal biologically relevant germline variants modulating CM outcomes.
Experimental Design
Using whole genome eQTL data from a healthy population, we identified 385 variants -significantly impacting the expression of 268 immune-relevant genes. The 40 most significant eQTLs were tested in a prospective cohort of 1,221 CM patients for their association with overall (OS) and recurrence-free survival using Cox regression models.
Results
We identified highly significant associations with better melanoma OS for rs6673928, impacting IL19 expression (HR 0.56, 95%CI 0.41–0.77; P=0.0002) and rs6695772, controlling the expression of BATF3 (HR 1.64, 95%CI 1.19–2.24; P=0.0019). Both associations map in the previously suspected melanoma prognostic locus at 1q32. Furthermore, we show that their combined effect on melanoma OS is substantially enhanced reaching the level of clinical applicability (HR 1.92, 95%CI 1.43–2.60; P=2.38e–5).
Conclusions
Our unique approach of interrogating lymphocyte-specific eQTLs reveals novel and biologically relevant immunomodulatory eQTL predictors of CM prognosis that are independent of current histopathological markers. The significantly enhanced combined effect of identified eQTLs suggests the personalized utilization of both SNPs in a clinical setting, strongly indicating the promise of the proposed design for the discovery of prognostic or risk germline markers in other cancers.
Keywords: cutaneous melanoma, prognosis, survival, immunomodulatory genes, expression quantitative trait loci (eQTLs)
INTRODUCTION
While cutaneous melanoma (CM) represents only 4% of skin cancers, it accounts for about 80% of skin cancer-related deaths. Melanoma incidence rates have been rising 1.4% on average each year over the last 10 years, while mortality rates have remained steadily high, in particular for advanced stages. In 2015, ~73.870 new cases of melanoma of the skin and ~9.940 melanoma-related deaths are estimated to occur in the USA (1), reflecting traditionally poor disease outcomes associated with more advanced stages; the 5-year melanoma survival rates for stages I–II, III and IV are 98.3, 63.0 and 16.6%, respectively (2). The negative trends in melanoma mortality are largely attributed to difficulties in clinical prognostication especially for more advanced stages, suggesting that in addition to standard clinical predictors there are other factors affecting the unpredictability of melanoma outcomes. Melanoma is considered to be highly immunogenic with the ability to induce an immune response that can suppress tumor growth, a phenomenon which is believed to be governed by effector T cells. Observed tumor immunogenicity modulates prognosis of cutaneous melanoma and varies greatly on the individual level (3, 4), suggesting that different capacities of the immune system control tumor growth (5, 6). The germline genetic factors emerge as possible novel, personalized markers of cancer outcomes, including melanoma (7–11), some exhibiting putative immunoregulatory capabilities with tumor impact and therefore representing plausible modulators of observed individual immune-response heterogeneity (12). In general, the germline associations with clinical outcome of complex disease traits found in small candidate studies are difficult to interpret and often need validation in larger cohorts. In addition, despite substantial efforts, evidence supporting the biological relevance of associated germline variants remains elusive, as they map almost exclusively in non-coding, often intergenic, regions. Findings from genome-wide association studies (GWAS) estimate that 88% of disease/trait-associated germline variants are non-coding, and 12% and 34% of them overlap with transcription factor-binding regions and DNase I Hypersensitive sites (i.e. markers of DNA regulatory region), respectively, thus putatively impacting gene expression in cis- or trans- configuration (13, 14). In efforts to help interpret functional consequences of germline variation, several recent studies have genome-wide mapped variants that correlate with expression levels of nearby genes known as cis expression quantitative trait loci (cis-eQTL) in several different cell types (15–19). These large analyses generated comprehensive maps of inherited genetic variation that regulate gene expression (20, 21), thus representing plausible biological candidates for association with human traits, including common diseases. While most eQTL studies were conducted on a relatively small sample size, a recent study by Grundberg et al (2013) identified cis-eQTL SNPs in three selected tissues, including lymphoblastoid cell lines (LCLs) derived from a large population of 857 well-phenotyped healthy female twins of the MuTHER (Multiple Tissue Human Expression Resource) project. Besides a large sample size which gives MuTHER resource enough statistical power to detect genetic variants with meaningful eQTL properties, the advantage of the MuTHER project’s twin design allows confirmation of identified eQTLs separately in each twin set (18, 19).
Capitalizing on the MuTHER resources, the aim of this study was to investigate whether biologically relevant germline polymorphisms that regulate expression levels of immune relevant genes in cells of the immune system, (e.g. LCLs) might serve as prognostic markers of melanoma clinical outcomes. By interrogating 382 immunomodulatory genes against eQTL data from MuTHER, we have evaluated 40 expression-regulating polymorphisms and their cumulative effects for association with melanoma clinical outcomes in a large population sample of 1,221 CM patients.
METHODS
Study population
This study comprises a total of 1,221 cutaneous melanoma patients (stage I to III) of self-reported European descent who were treated at the New York University Langone Medical Center (NYUMC). Blood samples, demographic and clinical information including age at diagnosis, gender, self-reported family history of melanoma, primary tumor characteristics: anatomic site, thickness, histological type, 2009 AJCC stage at diagnosis, ulceration status, as well as follow up information, were obtained following criteria established by the Interdisciplinary Melanoma Cooperative Group (IMCG) (12, 22, 23). All patients gave written informed consent at the time of enrollment and the study was approved by the Institutional Review Board of the NYUMC.
Selection of candidate immune-relevant genes
Candidate immunomodulatory genes were selected from exploring the Gene Ontology (GO) and Kyoto Encyclopedia of Genes and Genomes (KEGG) databases using the following search terms: somatic diversification of T cell receptor genes, T cell receptor V(D)J recombination, cytotoxic T cell differentiation, T-helper cell differentiation, regulatory t cell differentiation, T cell co-stimulation, T cell receptor complex, T cell receptor signaling pathway, dendritic cell differentiation, cytokines-immune, related to T cell receptor, interleukin, cytokines-immuno, T cell cytokine production, negative regulation of regulatory T cell differentiation, regulation of T cell cytokine production. A total of 382 genes were selected (Supplementary Table 1).
Selection of SNPs based on MuTHER resources and genotyping
SNPs for genotyping were selected based on information from sequence-based gene expression variations in lymphoblastoid cell lines (LCLs), obtained from the recently established MuTHER project, which was extensively described elsewhere (18, 19, 24, 25). The MuTHER project generated genomic and transcriptomic data from three disease-relevant tissues, including LCLs (i.e. representing cells of the immune system), which were derived from a cohort of 856 female Caucasian twins with detailed phenotypic information from the UK Adult Twin registry (18). For the purpose of this study, a publicly available list of top cis-eQTLs per probe in LCLs was mined for all the probes representing our panel of 382 immunomodulatory genes (Supplementary Table 1). A total of 50 SNPs with most significant cis-eQTL activity (ranking with P<4.46x10⁻⁸) in cells of the immune system were selected for genotyping (Supplementary Table 2). To confirm genotype-expression associations for the selected 50 probe-SNP pairs, we obtained publicly available expression data from the ArrayExpress (accession no. E-TABM-1140), while access to the genotype dataset was obtained from the Department of Twin Research (DTR), King’s College London. Twins (339 twin-pairs) from the same pair were separated into two twin sets and independent eQTL analyses were performed for each twin set using Spearman Rank Correlation as previously described (19). Genotype-expression correlations were assessed in 777 participants (including 339 twin-pairs) under three genetic models of inheritance (i.e. genotypic [three genotypes were coded 1,2,3], dominant [genotypes were coded 1,2,2] and recessive [genotypes were coded 1,1,2]) using Spearman Rank Correlation test.
For genotyping, genomic DNA was isolated from whole blood samples using a QiaAmp kit (Qiagen). All SNPs were genotyped using MassARRAY System (Agena Bioscience Inc.) according to the manufacturer’s protocol, as described in detail elsewhere (12, 23). Primer design was not successful for 8 SNPs, due to highly polymorphic regions around the SNPs of interest.
Expression of IL19 in CD4+ T cells from melanoma patients
Expression levels of IL19 in CD4+ T cells were assessed using NanoString nCounter platform. CD4+ T-cells were isolated from peripheral blood mononuclear cells of a subset of 43 CM patients as previously described (12) and RNA was extracted from purified CD4+ cells using RNeasy RNA Isolation kit (Qiagen). Probes were designed and synthesized by NanoString nCounter technologies to probe the following sequences of target transcripts: CCACAGACATGCACCATATAGAAGAGAGTTTCCAAGAAATCAAAAGAGCCATCCAAGCTAAGGACACC TTCCCAAATGTCACTATCCTGTCCACATTGGA for IL19 (NM_013371.3), GCAAGAAGTATGCTGAGGCTGTCACTCGGGCTAAGCAGATTGTGTGGAATGGTCCTGTGGGGGTATTT GAATGGGAAGCTTTTGCCCGGGGAACCAAAGC for PGK1 (NM_000291.2) and CGGTCGTGATGTGGTCTGTGGCCAACGAGCCTGCGTCCCACCTAGAATCTGCTGGCTACTACTTGAAG ATGGTGATCGCTCACACCAAATCCTTGGACCC for GUSB (NM_000181.1). NanoString nCounter analysis was performed using an input of 200 ng of total RNA from each sample and hybridization of RNA with Nanostring probes was processed according to the manufacturer’s protocols (NanoString Technologies, Inc). The data was analyzed using the nCounter digital analyzer software (Version 2.5.34). Counts for target gene IL19 were subjected to a technical normalization considering the counts obtained for positive control probe sets, followed by a biological normalization using the two house-keeping genes (PGK1 and GUSB) included in the CodeSet.
Statistical analysis
Univariate Cox proportional hazard models were used to assess associations between demographic and clinical characteristics and overall (OS) and recurrence-free survival (RFS). Time for OS and RFS was defined as the time from the date of diagnosis to the date of death (OS) and recurrence (RFS), or the date of last follow up. In addition, for the patients with no recorded recurrence event, RFS was defined from date of diagnosis to the date of death due to melanoma. The effects of individual SNPs on OS and RFS were accessed by multivariate Cox proportional hazard model adjusted for age at diagnosis (≤60 yrs/>60yrs), gender (female/male), tumor stage (I/II/III), thickness (<1.0/1.0–2.0/2.01–4.0/>4.0), ulceration (absent/present) and histological subtype (superficial-spreading/nodular/desmoplastic/acral-lentiginous/lentigo-maligna/other), as previously described (12). For each SNP, two genetic models (i.e. two genetic models that showed strongest expression-genotype correlations in the MuTHER data) were applied in Cox analysis, separately. To assess whether the observed associations are independent of clinical variables, the SNPs surpassing the correction for multiple tests were further analyzed using Cox models adjusted only for age and gender. SNP-SNP interaction analysis was performed by counting the number of putative unfavorable genotypes. To address the issue of multiple comparisons for Cox proportional hazard models, we used Benjamini-Hochberg procedure while restricting the false discovery rate to 0.05 (26) and assuming 80 hypotheses (40 SNPs tested under 2 genetic models of inheritance). All statistical analysis of genotype data and survival were performed using the ‘survival’ package in R.
RESULTS
Characteristics of study population
The study included 1,221 stage I–III cutaneous melanoma patients recruited by the IMCG at the NYUMC. All patients were of self-reported European descent with median age of 58.1±16.5 years. The median time between diagnosis and follow up was of 52.7 months. The 5-year survival rate was 84.1% for OS and 78.6% for RFS. Demographics as well as tumor characteristics are described in Table 1. Almost 85% of all primary diagnoses were of stage I and II. The majority of tumors (75.4%) were less than 2.0 mm thick and 80.6% of all primary tumors were not ulcerated. Superficial spreading melanoma was the most common histological subtype of melanoma (57.2%), followed by nodular melanoma (25.6%). Using Cox regression analysis, primary tumor stage, thickness, ulceration status and histological subtype were found significantly associated with OS and RFS (all P<2.2x10⁻¹⁶), respectively. Patients’ age at diagnosis (P=5.0x10⁻⁸) and family history of melanoma (P<0.001) were significantly associated with OS (Table 1).
Table 1. Characteristics of study population and associations between clinical covariates and survival.
The univariate Cox proportional hazard model was used to assess associations between clinicopathological characteristics and survival. P values are based on likelihood ratio test.
| Variable | N (%) | Overall survival | Recurrence-free survival | ||
|---|---|---|---|---|---|
|
| |||||
| HR (95% CI) | P value | HR (95% CI) | P value | ||
| Age at primary diagnosis | |||||
| ≤60 | 647 (53.0) | REF | REF | ||
| >60 | 574 (47.0) | 2.17 (1.63–2.87) | 5.04E-08 | 1.09 (0.86–1.37) | 0.499 |
|
| |||||
| Gender | |||||
| Female | 529 (43.3) | REF | REF | ||
| Male | 692 (56.7) | 1.42 (1.06–1.89) | 0.016 | 1.27 (0.99–1.61) | 0.054 |
|
| |||||
| Stage at primary diagnosis | |||||
| I | 835 (68.4) | REF | REF | ||
| II | 200 (16.4) | 3.47 (2.42–4.97) | 4.10 (3.02–5.58) | ||
| III | 186 (15.2) | 6.46 (4.68–8.93) | <2.20E-16 | 9.87 (7.47–13.04) | <2.20E-16 |
|
| |||||
| Primary tumor thickness | |||||
| <1.0 | 616 (53.9) | REF | REF | ||
| 1.0–2.0 | 246 (21.5) | 1.72 (1.11–2.66) | 4.62 (3.09–6.91) | ||
| 2.01–4.0 | 169 (14.8) | 3.89 (2.61–5.78) | 10.10 (6.86–14.88) | ||
| >4.0 | 112 (9.8) | 8.09 (5.49–11.90) | <2.20E-16 | 16.19 (10.87–24.12) | <2.20E-16 |
|
| |||||
| Ulceration | |||||
| Absent | 891 (80.6) | REF | REF | ||
| Present | 214 (19.4) | 4.00 (3.02–5.31) | <2.20E-16 | 4.91 (3.84–6.28) | <2.20E-16 |
|
| |||||
| Primary tumor anatomic site | |||||
| Axial | 672 (56.1) | REF | REF | ||
| Extremity | 526 (43.9) | 0.94 (0.71–1.25) | 0.658 | 0.81 (0.63–1.04) | 0.099 |
|
| |||||
| Histological subtype | |||||
| Superficial Spreading | 590 (57.2) | REF | REF | ||
| Nodular | 264 (25.6) | 4.30 (3.09–5.97) | 6.24 (4.62–8.41) | ||
| Desmoplastic | 34 (3.3) | 2.57 (1.17–5.65) | 4.73 (2.55–8.78) | ||
| Acral lentiginous | 33 (3.2) | 5.55 (3.09–9.98) | 5.51 (3.16–9.60) | ||
| Lentigo maligna | 44 (4.3) | 2.67 (1.27–5.61) | 1.96 (0.90–4.27) | ||
| Other | 67 (6.5) | 0.96 (0.35–2.65) | <2.20E-16 | 1.56 (0.77–3.15) | <2.20E-16 |
|
| |||||
| Family history of melanoma | |||||
| No | 978 (83.9) | REF | REF | ||
| Yes | 18 (16.1) | 0.47 (0.29–0.77) | 8.50E-04 | 0.81 (0.57–114) | 0.206 |
NOTE: Numbers in some categories do not add up to total due to missing values.
Selection of immune-related gene expression quantitative trait loci (eQTLs) for survival analysis
Using MuTHER resources, a total of 398 probe-SNP pairs (i.e. eQTLs) corresponding to 268 unique immunomodulatory genes and 385 unique SNPs were identified at the P<0.05 significance level (Supplementary Table 1). The top most significant 50 unique SNPs (ranking with P < 4.46x10⁻⁸) affected expression levels of 54 unique expression probes, which represent 48 unique immune-relevant genes (Supplementary Table 2). For these eQTLs we further computed expression-genotype correlations under three genetic models (genotypic, dominant and recessive) using Spearman correlation test in order to identify underlying mode of inheritance of eQTL effect. Genotype-expression correlations were strongest under genotypic and/or dominant genetic model for most SNP (Table 2). To further confirm the genotype-expression associations for 50 eQTL SNPs we separated twins into two twin sets and performed separate eQTL analyses for SNP-probe pairs of interest in each twin sets using Spearman Rank Correlation as previously described (19). All examined probe-SNP pairs were significant in both twin sets at a significance level of P<0.05 and the direction of association with expression (i.e. negative vs positive) remained unchanged (Table 2). The two genetic models that best correlated with expression were considered in downstream survival analysis for each eQTL.
Table 2. Top 50 SNP-gene eQTLs acting on immunomodulatory genes.
SNP-gene expression associations (correlation coefficient [rho] and P values) were investigated among 777 healthy female twins (LCL-combined) using Spearman Rank Correlation test and the two best fitting models of inheritance (i.e. genotypic, dominant and recessive) were identified for each eQTL SNP (printed in bold). Genotypic effect was further confirmed in LCL-twn1 and LCL-twn2 groups (339 twin-pairs were separated into two groups [twin set 1 and twin set 2] so that each group had one twin from each twin pair, and independent eQTL analyses were performed for each twin set) using Spearman Rank Correlation test.
| SNP | GENE | PROBE | LCL-twn1 | LCL-twn2 | LCL-combined | |||||||
|---|---|---|---|---|---|---|---|---|---|---|---|---|
| Rhoc | Pvaluec | Rhoc | Pvaluec | Rhoc | Pvaluec | Rhod | Pvalued | Rhoe | Pvaluee | |||
| a rs7772134 | HLA-DPB1 | ILMN_1749070 | 0.58 | 6.70E-31 | 0.57 | 9.38E-30 | 0.57 | <1.00E-37 | 0.57 | <1E-37 | 0.19 | 1.87E-07 |
| rs4577037 | IL16 | ILMN_2290628 | 0.52 | 5.19E-25 | 0.46 | 1.53E-19 | 0.50 | <1.00E-37 | 0.50 | <1E-37 | 0.15 | 4.67E-05 |
| rs7574070 | STAT4 | ILMN_1785202 | 0.65 | <1.00E-37 | 0.60 | 7.28E-34 | 0.63 | <1.00E-37 | 0.60 | <1E-37 | 0.38 | 1.08E-27 |
| a rs10995 | VASP | ILMN_1743646 | 0.53 | 1.95E-26 | 0.60 | 3.54E-34 | 0.57 | <1.00E-37 | 0.55 | <1E-37 | 0.33 | 8.89E-21 |
| rs841718 | STAT6 | ILMN_1763198 | 0.59 | 8.71E-34 | 0.57 | 6.02E-31 | 0.58 | <1.00E-37 | 0.53 | <1E-37 | 0.38 | 6.86E-28 |
| rs8101605 | LILRB1 | ILMN_1708248 | 0.47 | 8.22E-20 | 0.55 | 1.68E-28 | 0.52 | <1.00E-37 | 0.52 | <1E-37 | 0.17 | 1.18E-06 |
| rs2071304 | SPI1 | ILMN_1696463 | −0.50 | 7.28E-21 | −0.60 | 3.02E-30 | −0.55 | <1.00E-37 | −0.51 | <1E-37 | −0.35 | 8.07E-22 |
| rs11569345 | CD40 | ILMN_2367818 | 0.35 | 1.15E-10 | 0.39 | 4.04E-13 | 0.38 | 2.70E-26 | 0.38 | 2.87E-26 | 0.06 | 8.88E-02 |
| rs17001247 | CXCL10 | ILMN_1791759 | −0.44 | 2.58E-17 | −0.43 | 3.61E-16 | −0.44 | 1.35E-37 | −0.40 | 2.57E-31 | −0.35 | 6.34E-23 |
| rs11919943 | CCR1 | ILMN_1678833 | 0.37 | 3.58E-12 | 0.35 | 1.36E-10 | 0.35 | 7.17E-23 | 0.35 | 8.91E-23 | 0.10 | 7.66E-03 |
| rs4500045 | PAG1 | ILMN_1736806 | 0.39 | 1.78E-13 | 0.47 | 1.30E-19 | 0.42 | 1.40E-34 | 0.35 | 3.25E-24 | 0.33 | 1.53E-21 |
| rs6673928 | IL19 | ILMN_1799575 | 0.40 | 2.91E-14 | 0.38 | 1.02E-12 | 0.38 | 3.64E-27 | 0.36 | 1.10E-24 | 0.22 | 1.91E-09 |
| rs10760142 | C5 | ILMN_1746819 | 0.44 | 1.98E-16 | 0.40 | 9.55E-14 | 0.40 | 1.05E-29 | 0.35 | 2.78E-23 | 0.29 | 3.90E-16 |
| rs859 | IL16 | ILMN_1813572 | 0.36 | 5.59E-12 | 0.32 | 2.16E-09 | 0.36 | 6.10E-25 | 0.35 | 7.06E-24 | 0.17 | 1.22E-06 |
| rs4500045 | PAG1 | ILMN_2055156 | 0.32 | 1.47E-09 | 0.37 | 1.68E-12 | 0.34 | 4.10E-23 | 0.31 | 1.28E-18 | 0.25 | 2.58E-12 |
| rs9921791 | MLST8 | ILMN_1789240 | 0.32 | 2.20E-09 | 0.35 | 3.38E-11 | 0.35 | 3.85E-23 | 0.34 | 9.90E-23 | 0.16 | 6.01E-06 |
| rs6692729 | PSEN2 | ILMN_2404512 | −0.32 | 2.78E-09 | −0.41 | 1.84E-15 | −0.34 | 5.08E-23 | −0.30 | 5.23E-17 | −0.26 | 1.42E-13 |
| rs7584870 | SOCS5 | ILMN_2350970 | −0.32 | 5.91E-09 | −0.31 | 1.40E-08 | −0.30 | 9.88E-17 | −0.25 | 3.77E-12 | −0.23 | 1.83E-10 |
| rs2701652 | IRAK3 | ILMN_1661695 | 0.34 | 1.10E-09 | 0.31 | 2.94E-08 | 0.32 | 8.81E-18 | 0.29 | 2.04E-15 | 0.21 | 8.39E-09 |
| rs4848306 | IL1B | ILMN_1775501 | 0.36 | 1.67E-11 | 0.34 | 2.50E-10 | 0.35 | 8.58E-23 | 0.31 | 6.43E-18 | 0.26 | 9.43E-13 |
| rs1551565 | CAMK4 | ILMN_1767168 | 0.25 | 3.07E-06 | 0.31 | 7.10E-09 | 0.30 | 2.84E-17 | 0.28 | 1.34E-15 | 0.17 | 1.23E-06 |
| rs11203203 | UBASH3A | ILMN_2338348 | 0.28 | 3.29E-07 | 0.38 | 1.34E-12 | 0.32 | 5.74E-20 | 0.31 | 9.33E-19 | 0.18 | 6.84E-07 |
| rs1049337 | CAV1 | ILMN_1687583 | 0.26 | 1.57E-06 | 0.29 | 3.37E-08 | 0.28 | 2.54E-15 | 0.27 | 3.40E-14 | 0.16 | 1.10E-05 |
| a rs7975385 | CACNB3 | ILMN_2195482 | 0.30 | 2.04E-08 | 0.34 | 2.11E-10 | 0.31 | 1.48E-18 | 0.30 | 1.36E-17 | 0.16 | 1.07E-05 |
| rs4808137 | UBA52 | ILMN_2368576 | −0.33 | 1.25E-09 | −0.26 | 2.45E-06 | −0.30 | 9.05E-17 | −0.24 | 5.47E-11 | −0.25 | 3.91E-12 |
| rs1149901 | GATA3 | ILMN_2406656 | −0.29 | 2.64E-07 | −0.25 | 5.77E-06 | −0.27 | 6.44E-14 | −0.27 | 1.46E-13 | −0.13 | 4.58E-04 |
| rs6692729 | PSEN2 | ILMN_1714417 | −0.31 | 6.47E-09 | −0.36 | 5.53E-12 | −0.30 | 8.68E-18 | −0.25 | 2.08E-12 | −0.24 | 1.38E-11 |
| rs7036417 | SYK | ILMN_2059549 | 0.24 | 1.93E-05 | 0.36 | 5.33E-11 | 0.28 | 1.77E-14 | 0.24 | 1.94E-10 | 0.26 | 9.12E-13 |
| rs3807383 | GIMAP5 | ILMN_1769383 | −0.27 | 4.91E-07 | −0.32 | 3.19E-09 | −0.28 | 4.00E-15 | −0.27 | 4.53E-14 | −0.15 | 1.81E-05 |
| rs1378940 | CSK | ILMN_1754121 | 0.23 | 2.89E-05 | 0.23 | 2.08E-05 | 0.23 | 6.53E-11 | 0.20 | 1.81E-08 | 0.19 | 1.74E-07 |
| rs12401573 | SEMA4A | ILMN_1702787 | −0.36 | 9.67E-12 | −0.28 | 2.45E-07 | −0.31 | 1.28E-18 | −0.28 | 6.13E-16 | −0.21 | 5.52E-09 |
| rs9863627 | PAK2 | ILMN_1659878 | 0.32 | 5.65E-09 | 0.29 | 8.08E-08 | 0.30 | 2.56E-16 | 0.29 | 4.72E-16 | 0.11 | 3.04E-03 |
| rs4500045 | PAG1 | ILMN_1673640 | 0.26 | 1.04E-06 | 0.29 | 3.49E-08 | 0.27 | 1.09E-14 | 0.22 | 6.52E-10 | 0.23 | 1.12E-10 |
| rs4402765 | IL1A | ILMN_1658483 | −0.29 | 4.28E-08 | −0.28 | 1.12E-07 | −0.29 | 1.35E-16 | −0.25 | 8.52E-13 | −0.24 | 1.29E-11 |
| rs13331952 | CKLF | ILMN_2414027 | 0.29 | 9.48E-08 | 0.20 | 4.19E-04 | 0.23 | 1.26E-10 | 0.23 | 2.14E-10 | 0.11 | 3.39E-03 |
| b rs17179419 | PLCG1 | ILMN_1740160 | −0.29 | 9.30E-08 | −0.27 | 1.01E-06 | −0.26 | 2.10E-13 | −0.26 | 3.18E-13 | −0.11 | 2.87E-03 |
| rs2291299 | CCL5 | ILMN_2098126 | −0.27 | 5.19E-07 | −0.20 | 1.63E-04 | −0.25 | 6.42E-12 | −0.24 | 2.24E-11 | −0.13 | 3.67E-04 |
| rs4796105 | CCL5 | ILMN_1773352 | −0.23 | 3.71E-05 | −0.23 | 3.83E-05 | −0.23 | 1.77E-10 | −0.23 | 3.49E-10 | −0.11 | 3.73E-03 |
| a rs3805184 | TXK | ILMN_1741143 | 0.24 | 5.25E-06 | 0.29 | 8.00E-08 | 0.25 | 1.27E-12 | 0.24 | 1.66E-11 | 0.16 | 8.72E-06 |
| rs13331952 | CKLF | ILMN_1712389 | 0.30 | 2.67E-08 | 0.19 | 5.99E-04 | 0.23 | 2.71E-10 | 0.23 | 5.40E-10 | 0.12 | 7.08E-04 |
| a rs2517681 | HLA-G | ILMN_1656670 | −0.28 | 5.68E-07 | −0.25 | 7.77E-06 | −0.28 | 5.64E-14 | −0.25 | 1.04E-11 | −0.20 | 3.79E-08 |
| rs2295359 | IL23R | ILMN_1734937 | −0.24 | 2.15E-05 | −0.24 | 1.09E-05 | −0.24 | 1.99E-11 | −0.22 | 3.11E-09 | −0.18 | 1.65E-06 |
| rs665241 | FYB | ILMN_1796537 | 0.33 | 4.60E-10 | 0.33 | 4.57E-10 | 0.31 | 3.39E-18 | 0.28 | 2.18E-15 | 0.22 | 4.49E-10 |
| rs6695772 | BATF3 | ILMN_1763207 | −0.26 | 3.75E-05 | −0.29 | 2.09E-06 | −0.22 | 1.38E-07 | −0.21 | 2.05E-07 | −0.11 | 6.92E-03 |
| rs7720838 | PTGER4 | ILMN_1795930 | −0.21 | 1.18E-04 | −0.25 | 3.30E-06 | −0.23 | 1.05E-10 | −0.18 | 3.45E-07 | −0.20 | 1.74E-08 |
| rs2276645 | ZAP70 | ILMN_1719756 | −0.19 | 4.87E-04 | −0.22 | 4.27E-05 | −0.21 | 2.17E-09 | −0.19 | 6.36E-08 | −0.15 | 2.94E-05 |
| rs4469949 | CD27 | ILMN_1688959 | −0.18 | 1.81E-03 | −0.18 | 1.61E-03 | −0.19 | 2.49E-07 | −0.13 | 4.39E-04 | −0.23 | 9.21E-10 |
| rs10422141 | TICAM1 | ILMN_1724863 | −0.24 | 3.92E-05 | −0.20 | 6.41E-04 | −0.22 | 5.86E-09 | −0.26 | 1.00E-11 | −0.07 | 5.85E-02 |
| b rs10163412 | ZFPM1 | ILMN_1651438 | −0.25 | 1.73E-05 | −0.21 | 3.36E-04 | −0.23 | 1.49E-09 | −0.22 | 4.98E-09 | −0.13 | 9.61E-04 |
| a rs1104768 | CCL25 | ILMN_1737817 | −0.21 | 1.83E-04 | −0.16 | 5.18E-03 | −0.20 | 1.36E-07 | −0.18 | 2.04E-06 | −0.14 | 1.72E-04 |
| rs11161590 | BCL10 | ILMN_1716446 | 0.23 | 1.33E-05 | 0.31 | 4.69E-09 | 0.25 | 6.93E-13 | 0.22 | 7.83E-10 | 0.20 | 3.69E-08 |
| rs152112 | ITK | ILMN_1699160 | 0.14 | 8.51E-03 | 0.17 | 1.30E-03 | 0.19 | 1.09E-07 | 0.16 | 8.88E-06 | 0.16 | 4.86E-06 |
| a rs170361 | CCL22 | ILMN_2160476 | −0.17 | 2.37E-03 | −0.21 | 1.69E-04 | −0.19 | 2.09E-07 | −0.18 | 6.41E-07 | −0.12 | 1.55E-03 |
| a rs4820294 | LGALS1 | ILMN_1723978 | −0.20 | 1.89E-04 | −0.16 | 2.74E-03 | −0.19 | 1.51E-07 | −0.17 | 2.37E-06 | −0.14 | 1.50E-04 |
Rho, Spearman’s rank correlation coefficient measuring the strength of association between SNP genotypes and gene expression levels.
SNPs that failed primer design
SNPs failed genotyping
genotypic effect, genotypes were coded as 1, 2, 3.
dominant effect, genotypes were coded as 1, 2, 2.
recessive effect, genotypes were coded as 1, 1, 2.
Single-SNP analysis of the most significant 40 eQTLs in immunomodulatory genes for their association with melanoma outcomes
The most significant 50 eQTL SNPs were selected for genotyping in a population cohort of 1,221 melanoma patients. Only 40 SNPs were successfully genotyped and passed to association analyses; primer design was not successful for 8 SNPs and 2 SNPs did not pass our genotyping quality control filters (Hardy-Weinberg equilibrium P<0.001). The associations between each individual SNP and CM clinical outcomes of 1,221 melanoma patients (OS and RFS) were evaluated using Cox proportional hazards models as detailed in Methods. The results of the single SNP analysis are summarized in Table 3. In the RFS analysis, the most significant association was observed for rs9921791, an eQTL controlling expression of MLST8 in LCLs (Figure 1A) and ranking #16 among the top 50 eQTLs in the study (Supplementary Table 2), where carriers of at least one copy of minor T allele were associated with better outcome under the dominant model (HR= 0.52, 95% CI 0.35 to 0.79; P=0.0009). While other variants show nominal significance under different genetic models of analysis, including rs6695772 (IL19, P=0.005), rs6695772 (BATF3, P=0.006), rs841718 (STAT6, P=0.015), rs11539345 (CD40, P=0.016) and rs2276645 (ZAP70, P=0.048), after adjusting for multiple testing none of the variants remained statistically significant in RFS analyses.
Table 3. Associations between single SNPs and melanoma RFS and OS.
The association analysis of 40 SNPs with OS and RFS, were performed in 1,221 CM patients ascertained at NYU Langone Medical Center. The hazard ratios (HR) and 95% confidence intervals (95% CI) were calculated using multivariate Cox proportional hazard models adjusted for age at diagnosis, gender, stage, thickness, ulceration and histological subtype. Log-likelihood ratio statistic was used to compute P values. SNP, single nucleotide polymorphism; Gene (eQTL), target gene, which expression is affected by the SNP; hg19, SNP position based on Feb. 2009 assembly of the human genome (GRCh37).
| SNP | Gene (eQTL) | SNP Position (hg19) | Genotype /Model | N | Recurrence-free survival
|
Overall survival
|
||
|---|---|---|---|---|---|---|---|---|
| HR (CI 95%) | P value | HR (CI 95%) | P value | |||||
| rs10760142 | C5 | chr9:123835554 | TT | 357 | REF | REF | ||
| TC | 606 | 1.0 (0.79–1.45) | 1.11 (0.80–1.55) | |||||
| CC | 248 | 1.38 (0.96–1.98) | 0.208 | 1.10 (0.72–1.68) | 0.810 | |||
| DOM | 1.16 (0.87–1.53) | 0.308 | 1.11 (0.81–1.52) | 0.517 | ||||
| rs11203203 | UBASH3A | chr21:43836186 | GG | 406 | REF | REF | ||
| GA | 599 | 0.80 (0.60–1.07) | 0.86 (0.62–1.19) | |||||
| AA | 202 | 0.75 (0.51–1.10) | 0.208 | 0.82 (0.53–1.25) | 0.549 | |||
| DOM | 0.79 (0.60–1.03) | 0.083 | 0.85 (0.63–1.15) | 0.287 | ||||
| rs1149901 | GATA3 | chr10:8094787 | CC | 752 | REF | REF | ||
| CT | 371 | 0.87 (0.65–1.17) | 0.79 (0.57–1.10) | |||||
| TT | 63 | 1.19 (0.68–2.06) | 0.501 | 1.12 (0.59–2.15) | 0.310 | |||
| DOM | 0.92 (0.69–1.21) | 0.532 | 0.83 (0.61–1.13) | 0.238 | ||||
| * rs11569345 | CD40 | chr20:44758521 | GG | 1143 | REF | REF | ||
| GA | 77 | 0.48 (0.24–0.92) | 0.47 (0.22–1.05) | |||||
| AA | 1 | NA | 0.016 | NA | 0.040 | |||
| DOM | 0.47 (0.24–0.92) | 0.016 | 0.47 (0.22–1.05) | 0.040 | ||||
| rs12401573 | SEMA4A | chr1:156146218 | TT | 429 | REF | REF | ||
| TC | 572 | 0.97 (0.73–1.30) | 1.29 (0.92–1.81) | |||||
| CC | 217 | 1.11 (0.77–1.59) | 0.777 | 1.43 (0.96–2.13) | 0.164 | |||
| DOM | 1.01 (0.77–1.33) | 0.926 | 1.34 (0.97–1.83) | 0.068 | ||||
| rs13331952 | CKLF | chr16:66583618 | GG | 959 | REF | REF | ||
| GC | 223 | 1.02 (0.75–1.45) | 1.19 (0.81–1.75) | |||||
| CC | 19 | 0.89 (0.32–2.44) | 0.967 | 0.69 (0.17–2.83) | 0.563 | |||
| DOM | 1.00 (0.71–1.41) | 0.984 | 1.15 (0.79–1.67) | 0.477 | ||||
| rs152112 | ITK | chr5:156644624 | CC | 589 | REF | REF | ||
| CT | 520 | 0.91 (0.69–1.20) | 0.80 (0.58–1.10) | |||||
| TT | 109 | 1.42 (0.90–2.25) | 0.172 | 1.30 (0.77–2.19) | 0.150 | |||
| DOM | 0.97 (0.75–1.27) | 0.829 | 0.87 (0.64–1.18) | 0.359 | ||||
| rs17001247 | CXCL10 | chr4:76870291 | TT | 725 | REF | REF | ||
| TC | 431 | 1.14 (0.87–1.49) | 1.14 (0.84–1.55) | |||||
| CC | 65 | 1.28 (0.75–2.16) | 0.502 | 1.19 (0.65–2.20) | 0.652 | |||
| DOM | 1.16 (0.89–1.50) | 0.272 | 1.15 (0.86–1.54) | 0.361 | ||||
| rs2276645 | ZAP70 | chr2:98330052 | GG | 519 | REF | REF | ||
| GT | 547 | 1.25 (0.94–1.66) | 1.08 (0.79–1.49) | |||||
| TT | 117 | 0.72 (0.42–1.21) | 0.048 | 0.57 (0.31–1.06) | 0.081 | |||
| DOM | 1.14 (0.86–1.51) | 0.355 | 0.98 (0.72–1.34) | 0.902 | ||||
| rs2291299 | CCL5 | chr17:34191406 | AA | 809 | REF | REF | ||
| AG | 373 | 1.03 (0.78–1.36) | 1.16 (0.84–1.61) | |||||
| GG | 39 | 0.72 (0.31–1.67) | 0.693 | 1.81 (0.87–3.78) | 0.265 | |||
| DOM | 1.00 (0.76–1.32) | 0.985 | 1.22 (0.89–1.67) | 0.222 | ||||
| rs2295359 | IL23R | chr1:67635950 | GG | 588 | REF | REF | ||
| GA | 496 | 1.01 (0.76–1.33) | 1.10 (0.81–1.51) | |||||
| AA | 125 | 0.60 (0.37–0.96) | 0.062 | 0.86 (0.52–1.44) | 0.603 | |||
| DOM | 0.90 (0.69–1.18) | 0.457 | 1.05 (0.78–1.41) | 0.753 | ||||
| rs2701652 | IRAK3 | chr12:66580877 | GG | 650 | REF | REF | ||
| GC | 476 | 1.00 (0.76–1.32) | 0.85 (0.62–1.16) | |||||
| CC | 95 | 0.85 (0.54–1.33) | 0.742 | 0.50 (0.28–0.88) | 0.035 | |||
| DOM | 0.97 (0.75–1.26) | 0.818 | 0.76 (0.57–1.03) | 0.078 | ||||
| rs3807383 | GIMAP5 | chr7:150434158 | AA | 656 | REF | REF | ||
| AC | 480 | 1.05 (0.80–1.39) | 0.86 (0.63–1.19) | |||||
| CC | 77 | 1.06 (0.63–1.78) | 0.927 | 1.13 (0.65–1.95) | 0.536 | |||
| DOM | 1.05 (0.81–1.37) | 0.697 | 0.90 (0.67–1.22) | 0.508 | ||||
| rs4469949 | CD27 | chr12:6545611 | GG | 484 | REF | REF | ||
| GA | 553 | 0.84 (0.63–1.11) | 0.97 (0.71–1.34) | |||||
| AA | 183 | 0.87 (0.59–1.29) | 0.463 | 1.05 (0.68–1.64) | 0.940 | |||
| REC | 0.96 (0.67–1.38) | 0.821 | 1.07 (0.71–1.61) | 0.756 | ||||
| rs4577037 | IL16 | chr15:81596660 | TT | 1060 | REF | REF | ||
| TG | 153 | 0.93 (0.62–1.40) | 0.75 (0.46–1.21) | |||||
| GG | 8 | 0.62 (0.09–4.54) | 0.830 | 0.63 (0.08–4.69) | 0.428 | |||
| DOM | 0.91 (0.61–1.36) | 0.653 | 0.74 (0.47–1.19) | 0.197 | ||||
| rs4796105 | CCL5 | chr17:34085967 | AA | 878 | REF | REF | ||
| AC | 263 | 1.01 (0.75–1.36) | 1.13 (0.80–1.60) | |||||
| CC | 35 | 0.78 (0.33–1.81) | 0.827 | 1.81 (0.86–3.79) | 0.297 | |||
| DOM | 0.99 (0.74–1.32) | 0.925 | 1.20 (0.87–1.66) | 0.281 | ||||
| rs484306 | IL1B | chr6:53447054 | GG | 410 | REF | REF | ||
| GA | 596 | 1.20 (0.90–1.61) | 0.91 (0.66–1.26) | |||||
| AA | 213 | 0.80 (0.54–1.19) | 0.075 | 0.74 (0.48–1.15) | 0.400 | |||
| DOM | 1.08 (0.82–1.42) | 0.602 | 0.86 (0.63–1.17) | 0.333 | ||||
| rs665241 | FYB | chr5:39266562 | TT | 351 | REF | REF | ||
| TC | 592 | 1.06 (0.78–1.45) | 0.99 (0.69–1.42) | |||||
| CC | 263 | 0.93 (0.63–1.38) | 0.737 | 1.12 (0.74–1.69) | 0.783 | |||
| DOM | 1.02 (0.76–1.38) | 0.888 | 1.03 (0.73–1.45) | 0.854 | ||||
| rs6673928 | IL19 | chr1:206937245 | GG | 731 | REF | REF | ||
| GT | 422 | 0.69 (0.52–0.91) | 0.55 (0.39–0.77) | |||||
| TT | 66 | 0.64 (0.33–1.27) | 0.020 | 0.62 (0.28–1.35) | 0.001 | |||
| DOM | 0.68 (0.52–0.90) | 0.005 | 0.56 (0.41–0.77) | 0.0002 | ||||
| rs6692729 | PSEN2 | chr1:227018919 | CC | 395 | REF | REF | ||
| CT | 593 | 1.06 (0.78–1.43) | 0.89 (0.64–1.24) | |||||
| TT | 226 | 1.06 (0.72–1.57) | 0.929 | 0.84 (0.53–1.33) | 0.700 | |||
| DOM | 1.06 (0.79–1.41) | 0.701 | 0.88 (0.64–1.21) | 0.421 | ||||
| rs6695772 | BATF3 | chr1:212881939 | GG | 473 | REF | REF | ||
| GC | 531 | 1.55 (1.16–2.08) | 1.76 (1.26–2.46) | |||||
| CC | 201 | 1.24 (0.83–1.85) | 0.012 | 1.33 (0.85–2.09) | 0.003 | |||
| DOM | 1.46 (1.11–1.93) | 0.006 | 1.64 (1.19–2.24) | 0.0019 | ||||
| rs7036417 | SYK | chr9:93570505 | CC | 543 | REF | REF | ||
| CT | 525 | 0.95 (0.71–1.26) | 1.13 (0.81–1.56) | |||||
| TT | 149 | 1.30 (0.92–1.86) | 0.224 | 1.24 (0.83–1.87) | 0.554 | |||
| REC | 1.34 (0.96–1.86) | 0.092 | 1.17 (0.81–1.70) | 0.415 | ||||
| rs7574070 | STAT4 | chr2:192010488 | CC | 497 | REF | REF | ||
| CA | 566 | 1.11 (0.84–1.46) | 1.01 (0.73–1.38) | |||||
| AA | 139 | 1.05 (0.67–1.64) | 0.779 | 0.79 (0.47–1.34) | 0.635 | |||
| DOM | 1.09 (0.84–1.43) | 0.505 | 0.96 (0.71–1.30) | 0.799 | ||||
| rs7584870 | SOCS5 | chr2:46973400 | TT | 460 | REF | REF | ||
| TA | 580 | 1.01 (0.76–1.34) | 1.01 (0.73–1.39) | |||||
| AA | 177 | 0.96 (0.63–1.48) | 0.978 | 0.84 (0.52–1.37) | 0.742 | |||
| DOM | 1.00 (0.76–1.31) | 0.989 | 0.97 (0.71–1.32) | 0.839 | ||||
| rs8101605 | LILRB1 | chr19:55148487 | GG | 867 | REF | REF | ||
| GA | 323 | 1.28 (0.96–1.71) | 1.02 (0.74–1.42) | |||||
| AA | 30 | 1.28 (0.51–3.20) | 0.231 | 2.52 (1.15–5.53) | 0.123 | |||
| DOM | 1.28 (0.97–1.69) | 0.087 | 1.10 (0.80–1.51) | 0.55 | ||||
| rs841718 | STAT6 | chr12:57492996 | TT | 409 | REF | REF | ||
| TC | 518 | 1.38 (1.02–1.88) | 1.50 (1.04–2.16) | |||||
| CC | 184 | 1.54 (1.04–2.28) | 0.043 | 1.90 (1.20–3.01) | 0.015 | |||
| DOM | 1.43 (1.07–1.90) | 0.015 | 1.59 (1.12–2.25) | 0.007 | ||||
| rs9863627 | PAK2 | chr3:196535799 | TT | 989 | REF | REF | ||
| TG | 219 | 1.08 (0.78–1.49) | 0.90 (0.61–1.33) | |||||
| GG | 13 | 1.85 (0.56–6.14) | 0.597 | 1.31 (0.31–5.54) | 0.808 | |||
| DOM | 1.11 (0.81–1.52) | 0.535 | 0.92 (0.63–1.34) | 0.653 | ||||
| rs9921791 | MLST8 | chr16:2250068 | CC | 1042 | REF | REF | ||
| CT | 168 | 0.53 (0.35–0.80) | 0.80 (0.52–1.22) | |||||
| TT | 5 | NA | 0.003 | NA | 0.384 | |||
| DOM | 0.52 (0.35–0.79) | 0.0009 | 0.79 (0.51–1.20) | 0.258 | ||||
| rs10422141 | TICAM1 | chr19:4833410 | AA | 319 | REF | REF | ||
| AT | 664 | 1.00 (0.73–1.36) | 1.21 (0.85–1.72) | |||||
| TT | 237 | 1.24 (0.85–1.79) | 0.428 | 1.16 (0.74–1.83) | 0.568 | |||
| DOM | 1.06 (0.79–1.42) | 0.689 | 1.20 (0.85–1.68) | 0.295 | ||||
| rs1049337 | CAV1 | chr7:116200587 | CC | 617 | REF | REF | ||
| CT | 530 | 1.12 (0.86–1.46) | 1.24 (0.92–1.68) | |||||
| TT | 74 | 0.81 (0.43–1.52) | 0.499 | 0.66 (0.30–1.44) | 0.140 | |||
| DOM | 1.08 (0.83–1.40) | 0.566 | 1.16 (0.87–1.56) | 0.319 | ||||
| rs11161590 | BCL10 | chr1:85764998 | AA | 365 | REF | REF | ||
| AG | 527 | 0.97 (0.71–1.32) | 0.90 (0.63–1.30) | |||||
| GG | 239 | 1.36 (0.95–1.97) | 0.137 | 1.35 (0.89–2.04) | 0.131 | |||
| DOM | 1.08 (0.81–1.44) | 0.620 | 1.03 (0.74–1.44) | 0.862 | ||||
| rs11919943 | CCR1 | chr3:46266726 | TT | 1009 | REF | REF | ||
| TC | 202 | 0.86 (0.59–1.24) | 1.00 (0.67–1.49) | |||||
| CC | 9 | 0.63 (0.09–4.54) | 0.629 | 1.31 (0.18–9.50) | 0.968 | |||
| DOM | 0.85 (0.59–1.22) | 0.363 | 1.00 (0.68–1.49) | 0.983 | ||||
| rs1378940 | CSK | chr15:75083494 | TT | 442 | REF | REF | ||
| TG | 606 | 0.98 (0.73–1.30) | 0.91 (0.66–1.24) | |||||
| GG | 167 | 1.23 (0.81–1.86) | 0.537 | 1.10 (0.69–1.76) | 0.651 | |||
| DOM | 1.02 (0.77–1.33) | 0.909 | 0.94 (0.69–1.27) | 0.69 | ||||
| rs1551565 | CAMK4 | chr5:110561639 | TT | 661 | REF | REF | ||
| TC | 477 | 0.94 (0.72–1.23) | 1.23 (0.90–1.67) | |||||
| CC | 78 | 0.74 (0.42–1.30) | 0.546 | 1.30 (0.72–2.32) | 0.371 | |||
| DOM | 0.92 (0.71–1.19) | 0.505 | 1.23 (0.92–1.66) | 0.163 | ||||
| rs2071304 | SPI1 | chr11:47372377 | CC | 543 | REF | REF | ||
| CG | 540 | 0.91 (0.69–1.21) | 1.05 (0.76–1.44) | |||||
| GG | 138 | 0.95 (0.63–1.42) | 0.818 | 0.77 (0.46–1.30) | 0.488 | |||
| DOM | 0.92 (0.71–1.20) | 0.543 | 0.99 (0.73–1.33) | 0.928 | ||||
| rs4402765 | IL1A | chr2:113568847 | GG | 632 | REF | REF | ||
| GC | 506 | 0.98 (0.75–1.29) | 0.99 (0.73–1.34) | |||||
| CC | 77 | 0.65 (0.34–1.26) | 0.396 | 0.49 (0.20–1.20) | 0.212 | |||
| DOM | 0.94 (0.72–1.22) | 0.642 | 0.93 (0.69–1.25) | 0.61 | ||||
| rs4500045 | PAG1 | chr8:82017932 | GG | 314 | REF | REF | ||
| GA | 605 | 0.74 (0.54–1.01) | 1.26 (0.86–1.83) | |||||
| AA | 302 | 0.85 (0.6–1.21) | 0.163 | 1.60 (1.07–2.39) | 0.072 | |||
| REC | 1.03 (0.77–1.38) | 0.854 | 1.38 (1.00–1.89) | 0.052 | ||||
| rs4808137 | UBA52 | chr19:18688847 | CC | 337 | REF | REF | ||
| CA | 580 | 1.21 (0.88–1.68) | 1.28 (0.88–1.86) | |||||
| AA | 298 | 1.06 (0.72–1.54) | 0.437 | 0.94 (0.61–1.45) | 0.172 | |||
| REC | 0.92 (0.68–1.25) | 0.607 | 0.79 (0.56–1.13) | 0.186 | ||||
| rs7720838 | PTGER4 | chr5:40486896 | TT | 424 | REF | REF | ||
| TG | 562 | 1.14 (0.85–1.52) | 0.86 (0.62–1.20) | |||||
| GG | 210 | 1.27 (0.84–1.92) | 0.476 | 1.41 (0.92–2.16) | 0.076 | |||
| REC | 1.18 (0.82–1.71) | 0.387 | 1.53 (1.04–2.26) | 0.037 | ||||
| rs859 | IL16 | chr15:81601322 | AA | 654 | REF | REF | ||
| AG | 462 | 1.19 (0.91–1.57) | 1.00 (0.73–1.37) | |||||
| GG | 98 | 1.32 (0.81–2.13) | 0.309 | 1.47 (0.89–2.42) | 0.328 | |||
| DOM | 1.21 (0.94–1.57) | 0.138 | 1.08 (0.80–1.44) | 0.626 | ||||
SNP with low minor allele frequency (MAF) resulting in 2 genotypes. Significant associations (P<0.05) are in bold. P values that surpass multiple testing correction are underlined. DOM, dominant genetic model. REC, recessive genetic model.
Figure 1. Polymorphisms associated with CM clinical outcomes and gene expression levels.
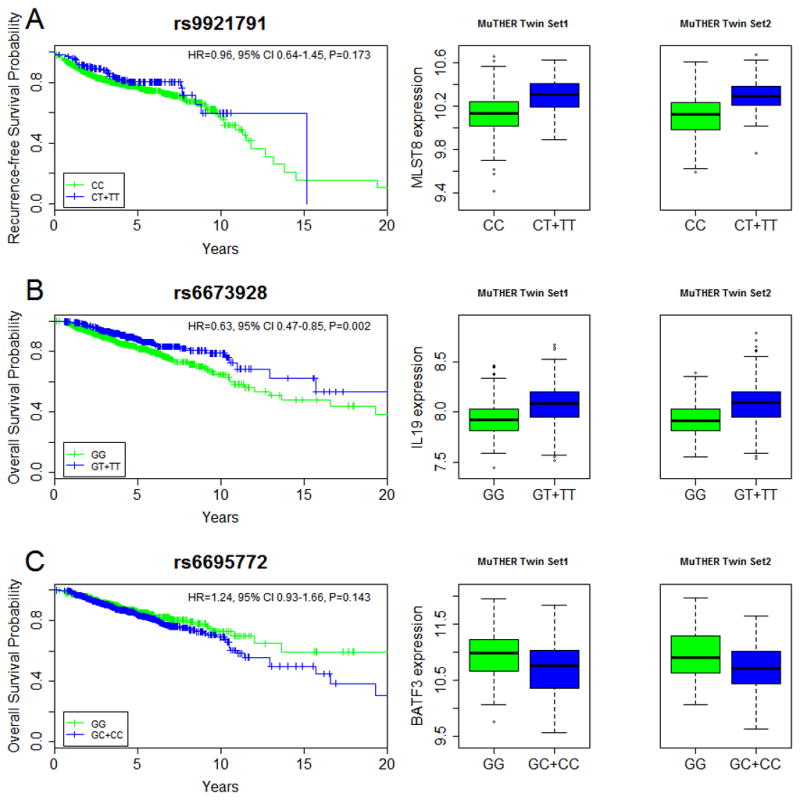
Results for polymorphisms A) rs9921791 (MLST8), B) rs6673928 (IL19) and C) rs6695772 (BATF3) are plotted. Note that survival curves were generated using Kaplan-Meier estimates (univariate analysis) and are not significant for rs9921791 and rs6695772 variants, suggesting that the two SNPs are not independent from other clinical covariates. However for illustrative purposes KM plots for both SNPs are presented and they show the trend of association that is the same as in the multivariate survival analysis, for which both SNPs are significant.
For OS, six SNPs showed significant associations using multivariate analysis (Table 3). The most significant association with OS was observed for rs6673928 (an eQTL impacting expression of IL19 [Figure 1B] and ranking #12 among the top 50 eQTLs in the study [Supplementary Table 2]), under the dominant model, in which the variant T allele was associated with improved OS (HR=0.56, 95% CI 0.41 to 0.77, P=0.0002). This association remained significant after adjusting for multiple testing. Moreover, comparably significant association between OS and rs6673928 was also observed in an analysis adjusted by only age and gender (see Methods), suggesting that survival effect of rs6673928 is independent of other AJCC clinical variables (HR=0.61, 95% CI 0.45 to 0.82; P=0.0008). Our second most significant OS association, reaching the level of multiple testing adjusted significance, was observed for rs6695772 (influencing BATF3 expression levels, Figure 1C). The carriers of the rs6695772 minor C allele were associated with worse survival under the dominant model (HR=1.64, 95% CI 1.19 to 2.24; P=0.0019). Polymorphisms rs6673928 and rs6695772, both exhibiting most significant association with OS, are located ~6 Mb apart on chromosome 1q32, previously suggested for association with melanoma outcome (12). Linkage disequilibrium (LD) analysis showed that the two SNPs are independent (r2=0.002, D′=0.099), which we further confirmed by performing association between OS and rs6695772 using multivariate Cox regression analysis while also adjusting for the rs6673928 variant and found no difference in effect size and significance. Moreover, as per MuTHER data, there is no correlation between rs6673928 (eQTL for IL19) and BATF3 expression and similarly no association is observed between rs6695772 (eQTL for BATF3) and expression levels of IL19. This further suggests that both loci represent two independent eQTL effects (Supplementary Fig 1). Other associations with OS, not reaching the adjustments for multiple testing, were observed for rs841718 (STAT6, Pdominant model=0.007), rs2701652 (IRAK3, P=0.035), rs7720838 (PTGER4, Precessive model=0.037) and rs11569345 (CD40, Pdominant model=0.040). Of note, SNPs rs11569345 (CD40), rs6673928 (IL19), rs6695772 (BATF3) and rs841718 (STAT6) exhibited association with both RFS and OS, and the directionality of associations was comparable between RFS and OS for all analyzed SNPs (Table 3).
Cumulative effect of associated eQTLs on melanoma survival
We further assessed the cumulative effect of two eQTL SNPs, rs6673928 (IL19) and rs6695772 (BATF3) on OS, as these were the most significant associations in the single SNP analysis after adjustment for multiple testing, and, interestingly, both variants, albeit genetically independent (not in LD), map in the same locus at 1q32. SNP-SNP interaction analysis was performed by counting the number of putative, unfavorable genotypes (i.e. associated with worse outcome) of both SNPs and assessing their association with OS (multivariate Cox model is presented in Supplementary Table 3). The following genotypes were considered as unfavorable: rs6673928 (wild-type) and rs6695772 (heterozygotes and variant homozygotes). Comparing with the reference subjects carrying 0 or 1 unfavorable genotypes, this analysis shows that the subjects carrying 2 unfavorable genotypes had significantly worse survival (HR=1.92, 95% CI 1.43 to 2.60; P=1.87x10⁻⁵). Five-year OS rate was 86.3% for reference subjects, while 5-year survival rate decreased to 80.5% among carriers of 2 unfavorable genotypes (Figure 2).
Figure 2. Survival curves for cumulative SNP effects.
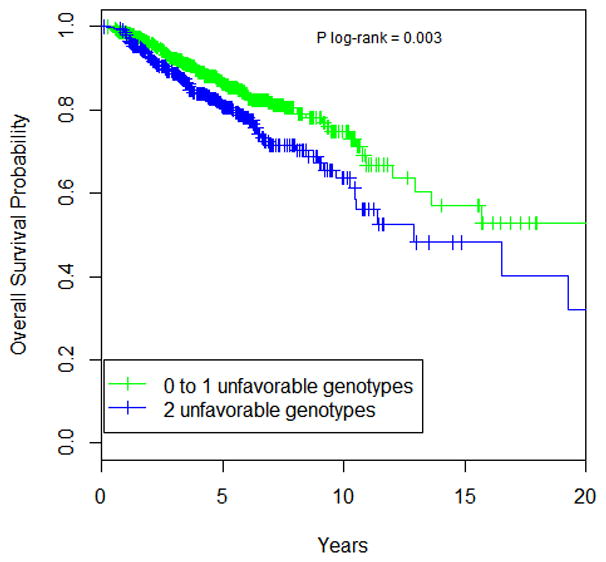
Overall survival curves were generated using univariate Kaplan-Meier estimates. P value was determined using log-rank test. For OS association analysis, unfavorable genotypes were defined as follows: rs6673928-IL19 (wild-type), rs6695772-BATF3 (heterozygotes and variant homozygotes).
Correlation of rs6673928 with IL19 expression CD4+ T cells purified from melanoma patients
To further validate the genotype-expression correlation of our most significant eQTL in melanoma survival analysis, we tested the correlation of rs6679328 with IL19 expression in CD4+ T cells purified from a subset of 43 melanoma patients from a population genotyped in this study. Following isolation of CD4+ T cells the expression level of IL19 was analyzed from total RNA -. Expression levels of IL19 were compared between GG and GT genotypes for rs667328 (no homozygotes for minor T allele were observed among 43 patients). Using Spearman correlation approach we were able to observe a positive association between T allele and expression level of IL19 (Spearman coefficient rho= 0.32, P=0.0347; Figure 3), further confirming that the eQTL from UK twin studies has a true effect on IL19 expression in an independent subset of melanoma patients tested in this study.
Figure 3. Correlation between rs6673928 genotypes and IL19 expression levels in CD4+ T cells from 43 melanoma patients.
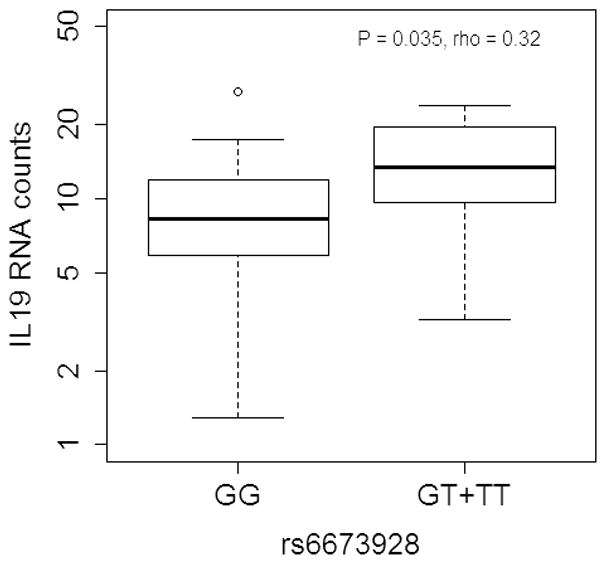
RNA levels of IL19 were determined using Nanostring technology. Spearman correlation was used to determine P value and Spearman correlation coefficient (Rho).
DISCUSSION
The discovery of biologically impactful and personalized melanoma prognostic markers complementing currently established, yet clinically less specific, histopathological indicators is one of the key objectives of current melanoma research. Recent studies suggest that germline genetic variants may modulate CM clinical endpoints, thereby representing potentially personalized and easily accessible prognostic biomarkers (7–12). However, while the majority of currently published studies on germline associations with prognosis still require independent validation in larger cohorts, the biological and functional uncertainty of most prognostic variants further limits their clinical consideration. With the exception of few melanoma etiology related SNPs [e.g. MC1R (9), vitamin D-binding protein (11)], in general, almost exclusively, the genetic variants identified to date for associations with melanoma risk (i.e. GWAS loci) or prognosis [reviewed in(8)], map to non-coding regions with unknown biological impact. In fact, from a broader point of view the general lack of knowledge on functional consequences of germline genetic variation associated with human diseases is apparent and has been a major hurdle in translating these findings into clinical practice. As such, novel strategies for the discovery of biologically impactful germline genetic surrogates associated with cancer risk (e.g. in GWAS data), prognosis, or therapy response (27–29) are highly demanded not only in regard to more predictive strategies, but importantly for improved biological understanding ultimately leading to more targeted treatments. Considering the fact that melanomas are highly immunogenic, the genetic variants in immunomodulatory genes that are significantly and reproducibly associated with gene expression in immune cells as validated eQTLs may have a strong potential to serve as clinically actionable prognostic markers.
By exploring recent data of genome-wide eQTLs generated on 777 healthy female twins by MuTHER project (18), in this study we have tested the hypothesis that the individual genetic variation associated with the expression of immune-related genes plays a role in modulating CM outcomes, as immune response appears to be one of the key mechanisms for controlling melanoma progression. Our study provides a first in-depth analysis aimed at mapping the functionally important germline variants in immunomodulatory networks as potential markers of melanoma prognosis.
Using the unique approach of interrogating the MuTHER eQTL data, we have identified 385 SNPs significantly associated with the expression of 268 immunoregulatory genes (Supplementary Table 1). For the most significant 40 variants (P<4.46x10⁻⁸; Supplementary Table 2) with comparable genotype-expression correlations in both matched healthy female twin sets, we assessed genotype-expression correlations under three genetic models (i.e. genotypic, dominant or recessive) using Spearman rank correlation test. The best two modes of inheritance for each eQTL were examined for their association with CM clinical outcomes in 1,221 melanoma patients. Our approach for the first time identified several eQTL variants that were significantly associated with melanoma survival.
The most significant finding in our study is the association of melanoma overall survival (OS) with eQTL variant rs6673928 at 1q32.1, impacting the expression of IL19 gene (linear regression coefficient [beta]= 0.12, P=5.66x10⁻²³). We observed a strong association of rs6673928 with better survival for the carriers of a minor T allele (HR=0.56, 95% CI 0.41 to 0.77; P=0.0002), which correlated with increased expression of IL19 in LCLs from MuTHER dataset, and this correlation was also validated in CD4+ T cells purified from a subset of melanoma patients from our study population (Figure 3). To our knowledge, this is the first evidence suggesting that increased germline expression of IL19 in cells of an individual’s immune system associates with better clinical outcome possibly via suppression of melanoma progression (Figure 1B). These findings are particularly interesting in regards to sparse experimental data on IL19 function. While the putative involvement of IL19 has been reported in a range of diseases including cancer (30) or autoimmune disorders (31, 32), in these and other studies IL19 was shown to have both suppressive and stimulatory capacities in immune regulation (33). IL19 is a member of IL10 family of cytokines and notably, both genes map within a relatively narrow region (~26 kb apart) at 1p.32 locus. Interestingly, eQTL data from MuTHER project show that our most significant variant rs6673928 also associates with expression of IL10, albeit with less significance (P<2.5x10⁻⁶) compared to the effect on IL19 expression. This is interesting, as we have recently identified strong association with CM survival for a variant near IL10, rs3024493 (12). In that recent report we showed that the association with improved OS is driven by rs3024493 heterozygotes, which secrete medium levels of IL10, as compared to low-secreting minor allele homozygotes conversely associated with worse outcome, which is consistent with directionality of the effects for IL19 in the current study. Other prior smaller scale studies also reported associations at 1q32.1 with melanoma survival for a set of three highly correlated polymorphisms in IL10 promoter: rs1800896, rs1800871 and rs1800872 (34–37). Similarly to our observations, these studies reported that the IL10 high-level expression genotypes are protective in CM, while low-level expression genotypes associate with poorer disease prognosis. These consistent reports clearly suggest that the genetic variation at 1q32 may result in specific gene-expression patterns regulating several interleukin candidates in the locus with an impact on melanoma clinical outcome, likely via modulation of melanoma immune surveillance. Notably, all the variants associated with CM outcomes at 1q32.1 in the current and prior reports are scattered in a relatively narrow region spanning ~9.6 kbp, thus raising a possibility that the variants are in LD. Using the data from 1000 Genomes Pilot project we found that rs1800896 [previous studies, (35)], rs3024493 [our recent study, (12)], and rs6673928 [current study] show little to no correlation (r2rs1800896-rs3024493= 0.31, r2rs1800896-rs6673928= 0.24 and r2rs6673928-rs3024493= 0.07), which was also confirmed in our study population (data not shown). This indicates that the multi-variant associations with CM survival at 1q32.1 may be due to other mechanisms. As discussed in our recent report (12) the region of 1q32.1 appears to be in an extensive transcriptional “hot spot”. The region of associated variants shows the presence of several strong DNase I hypersensitive sites in T cells, involving multiple transcription factors spread across a 30 kbp region (Supplementary Figure 2). It is therefore possible that 1q32.1 exerts a broader positional effect in the immune cells, affecting the expression of several genes simultaneously in this locus. Given the amount of published data showing significant expression correlation of different interleukin gene targets at 1q32.1 in immune regulation (32, 38), it is likely that genes of this locus share common gene expression regulatory elements. The genetic variants in these regulatory elements would then produce specific expression signatures, impacting both physiological immune response as well as disease outcome. This scenario is supported by other intriguing findings generated in our study. We found another variant on chromosome 1, rs6695772, which was associated with OS. The carriers of at least one copy of the minor C allele for rs6695772 had worse prognosis when compared to wild-type GG homozygotes (HR= 1.64, 95% CI 1.19 to 2.24; P=0.0019). The MuTHER eQTL data in LCLs associate minor C allele of rs6695772 with decreased expression levels of BATF3 gene (basic leucine zipper transcription factor, ATF-like 3) in a dose-dependent manner (linear regression coefficient [beta]=−0.16, P=6.93x10⁻¹⁰) (Figure 1C). BATF3 is a positive immune regulator, primarily involved in stimulation of CD8α+ dendritic cells (39). Our data appears to be consistent with these findings, suggesting that the decreased expression of BATF3 in immune cells predicts worse CM outcome, likely due to suppressed immune surveillance of tumor progression (Figure 1C). Interestingly, rs6695772 maps ~6Mb downstream from our most significantly associated variant, rs6673928, and although not in LD (r2=0.002), the comparably significant association effects observed with melanoma survival and relatively close proximity of both loci might suggest common genetic or biological underpinnings. Notably, overexpression of BATF3 in T cells has also been shown to stimulate Th17 cell differentiation. (40). Moreover, knocking down BATF3 in Th2 cells dramatically decreased expression of IL4 and IL10 cytokines (41, 42). This is an intriguing biological connection as both the overexpression of IL10 and elevated levels of Th17 cells in peripheral blood were correlated with improved cancer patient survival in previous studies (43, 44). These findings therefore align with our observations that minor T allele carriers of germline eQTL rs6695772, associated with worse OS, express low levels of BATF3 which may in turn down-regulate IL4 and IL10. In an attempt to support such a hypothesis we analyzed the correlation between BATF3 expression and expression levels of IL4, IL10, IL17 and IL19, in the MuTHER data (Supplementary Figure 3). Although we did not note the correlation of BATF3 expression with expression of IL10, nor have we confirmed positive correlation of BATF3 with IL4, it is possible that the expression correlation is T-helper subtype specific. However, we noted a significant correlation between expression of BATF3 and IL19, suggesting a possibility that there is a novel, previously unexplored molecular interaction of both proteins in immune surveillance of melanoma progression. Nevertheless, the biological meaning and causality of these associations need to be further investigated, likely using in vivo models.
Due to functional commonalities and putative mutual interaction between the two loci (rs6673928 and rs6695772) most significantly associated with melanoma OS in our study, we explored possible cumulative effects of these two variants. We found that the joint effect of both variants on OS is substantially stronger (HR =1.92, 95% CI 1.43 to 2.60; P=1.87x10⁻⁵) (Figure 2), when compared to single SNP analysis. Interestingly, the analysis adjusted for only age and gender shows similarly strong association effect (HR =1.60, 95% CI 1.21 to 2.11; P=9.26x10⁻⁴) when compared to multivariate analysis adjusted for age, gender and other established clinical markers. This clearly suggests that the observed joint effects are possibly independent from histopathological predictors. These observations for the first time propose the germline genetic variants as independent prognostic factors and, due to the strength of their joint interaction, the clinically actionable personalized biomarkers of melanoma outcomes. However, the final replication of these associations in additional subsets of melanomas will be important to provide a definitive verdict on their consideration for a clinically valid prognostic test.
Significant association was also noted for rs9921791, located nearby MLST8 (mammalian lethal with SEC13 protein 8). The carriers of minor T allele (associated with increased expression of MLST8) recurred significantly later compared to patients with CC genotypes (Figure 1A). MLST8 is a regulator of mTOR kinase activity (45, 46) and interestingly, mTOR signaling was recently shown to promote T cell development (47–49). This suggest that upregulation of MLST8 expression among rs99212791-T allele carriers with CM, may stimulate immune tumoral response via mTOR pathway-mediated T cell activation, leading to suppression of CM recurrence. However, despite these encouraging findings, exploring such hypothesis is premature pending the association validation and more detailed investigation into the underlying molecular role of MLST8 in melanoma clinical outcomes.
It is important to mention that the genotype-expression correlations tested in our study were based exclusively on the data from female-only MuTHER cohort. Although all our analyses were adjusted for gender, the gender-stratified tests for our most significant associations revealed a gender-specific effect for some variants, in particular rs6695772 (BATF3) association with OS observed only in males. (Supplementary Table 4). While this could likely be attributed to reduced statistical power (the samples size in each separate gender-stratified analysis was reduced approximately by half), it is also possible that the gender-specific associations are due to yet-unknown biological underpinnings. As it is difficult to draw reliable conclusions at this stage, to confirm their potential biological meaning, the gender-specific testing of rs6695772 (BATF3) in a larger melanoma population will be needed in subsequent efforts.
As our current report is hypothesis driven and focuses on cis-eQTL associations in relatively narrow selection of immune genes due to their biologically plausible role in melanoma, we did not assess trans-acting genotype-expression correlations on the genome-wide scale that may also be important. While this may be a potential limitation in our design, the recent MuTHER study on mapping trans-eQTLs has concluded that direct cis effects on local genes are stronger than indirect trans effects (21). Moreover, in that recent report, only a handful of trans effects at a 5% false discovery rate have been identified on genome-wide scale. This is likely attributed to the power limitations of available eQTL resources, as the interrogation of trans-acting genotype-correlations involves much larger number of tests resulting in more rigorous control for false discovery rate. However, it is estimated that 65% of gene expression heritability is trans-regulated and about 52% of cis-eQTLs also have transacting effect (21), strongly suggesting importance of inherited trans-eQTLs as potentially important prognostic biomarkers. Therefore, with expansion of eQTL resources, as part of ongoing and future efforts, the comprehensive assessment of trans-eQTLs, using the similar approach applied in our study, will become feasible for the identification of novel clinically relevant outcome modulators of melanoma and other cancers.
In conclusion, our unique approach of interrogating lymphocyte-specific eQTLs from healthy twins was notably powerful in identifying several immunomodulatory eQTLs, and indirectly, their gene targets, including IL19 and BATF3 at 1q32, as novel biologically relevant predictors of CM prognosis. In addition, the substantially enhanced cumulative effect of these associations strongly encourages the consideration of joint screening of these variants in a prognostic clinically relevant test in the near future. Our study suggests that the eQTL-based strategy proposed here will be highly efficient in discovering novel molecular markers of outcome, risk or therapy response in other human cancers driven by specific molecular pathways.
Supplementary Material
TRANSLATIONAL RELEVANCE.
The discovery of personalized biomarkers of melanoma outcomes is of imminent importance as melanoma mortality for advanced disease is high. The germline genetic factors emerge as promising candidates for this purpose. However, their identification has proven difficult, mainly due to the lack of comprehensive discovery strategies delineating their biological impact, and hence facilitating their clinical applicability. Here we provide a novel approach for identification of biologically and clinically impactful germline variants associated with melanoma prognosis. As immunogenicity is an important hallmark of melanoma progression, in our strategy we interrogated publically available resources to identify genetic variants strongly associated with the expression of immune related genes and tested their effect on modulation of survival in 1,221 melanoma patients. We have identified novel significant associations of gene-expression correlated variants with melanoma OS, and propose that their joint interaction may provide a clinically relevant effect independent of the current clinicopathological markers.
Acknowledgments
Financial Support:
The study was funded by the grants from National Cancer Institute 1R21CA184924-01 (TK), 1R01CA187060-01A1 (TK) and Cancer Center Support Grant P30CA016087.
TwinsUK: The study was funded by the Wellcome Trust; European Community’s Seventh Framework Programme (FP7/2007-2013). The study also receives support from the National Institute for Health Research (NIHR)- funded BioResource, Clinical Research Facility and Biomedical Research Centre based at Guy’s and St Thomas’ NHS Foundation Trust in partnership with King’s College London. SNP Genotyping was performed by The Wellcome Trust Sanger Institute and National Eye Institute via NIH/CIDR.
Footnotes
COI Statement: The authors have no conflicting interests to disclose.
References
- 1.Society. AC. Cancer Facts & Figures 2015. Atlanta: American Cancer Society; 2015. [Google Scholar]
- 2.Howlader N, Noone AM, Krapcho M, Garshell J, Miller D, Altekruse SF, et al. SEER Cancer Statistics Review, 1975–2012. 2015 Apr; Based on November 2014 SEER data submission, posted to the SEER web site. [Google Scholar]
- 3.Blankenstein T, Coulie PG, Gilboa E, Jaffee EM. The determinants of tumour immunogenicity. Nature reviews Cancer. 2012;12:307–13. doi: 10.1038/nrc3246. [DOI] [PMC free article] [PubMed] [Google Scholar]
- 4.Schreiber RD, Old LJ, Smyth MJ. Cancer immunoediting: integrating immunity’s roles in cancer suppression and promotion. Science. 2011;331:1565–70. doi: 10.1126/science.1203486. [DOI] [PubMed] [Google Scholar]
- 5.Gajewski TF, Schreiber H, Fu YX. Innate and adaptive immune cells in the tumor microenvironment. Nature immunology. 2013;14:1014–22. doi: 10.1038/ni.2703. [DOI] [PMC free article] [PubMed] [Google Scholar]
- 6.Faraji F, Pang Y, Walker RC, Nieves Borges R, Yang L, Hunter KW. Cadm1 is a metastasis susceptibility gene that suppresses metastasis by modifying tumor interaction with the cell-mediated immunity. PLoS genetics. 2012;8:e1002926. doi: 10.1371/journal.pgen.1002926. [DOI] [PMC free article] [PubMed] [Google Scholar]
- 7.Davies JR, Jewell R, Affleck P, Anic GM, Randerson-Moor J, Ozola A, et al. Inherited variation in the PARP1 gene and survival from melanoma. Int J Cancer. 2014;135:1625–33. doi: 10.1002/ijc.28796. [DOI] [PMC free article] [PubMed] [Google Scholar]
- 8.Vogelsang M, Wilson M, Kirchhoff T. Germline determinants of clinical outcome of cutaneous melanoma. Pigment Cell Melanoma Res. 2015 doi: 10.1111/pcmr.12418. Epub ahead of print. [DOI] [PMC free article] [PubMed] [Google Scholar]
- 9.Taylor NJ, Reiner AS, Begg CB, Cust AE, Busam KJ, Anton-Culver H, et al. Inherited variation at MC1R and ASIP and association with melanoma-specific survival. Int J Cancer. 2015;136:2659–67. doi: 10.1002/ijc.29317. [DOI] [PMC free article] [PubMed] [Google Scholar]
- 10.Law MH, Rowe CJ, Montgomery GW, Hayward NK, MacGregor S, Khosrotehrani K. PARP1 polymorphisms play opposing roles in melanoma occurrence and survival. Int J Cancer. 2015;136:2488–9. doi: 10.1002/ijc.29280. [DOI] [PubMed] [Google Scholar]
- 11.Davies JR, Field S, Randerson-Moor J, Harland M, Kumar R, Anic GM, et al. An inherited variant in the gene coding for vitamin D-binding protein and survival from cutaneous melanoma: a BioGenoMEL study. Pigment Cell Melanoma Res. 2014;27:234–43. doi: 10.1111/pcmr.12193. [DOI] [PMC free article] [PubMed] [Google Scholar]
- 12.Rendleman J, Vogelsang M, Bapodra A, Adaniel C, Silva I, Moogk D, et al. Genetic associations of the interleukin locus at 1q32.1 with clinical outcomes of cutaneous melanoma. Journal of medical genetics. 2015;52:231–9. doi: 10.1136/jmedgenet-2014-102832. [DOI] [PMC free article] [PubMed] [Google Scholar]
- 13.Hindorff LA, Sethupathy P, Junkins HA, Ramos EM, Mehta JP, Collins FS, et al. Potential etiologic and functional implications of genome-wide association loci for human diseases and traits. Proceedings of the National Academy of Sciences of the United States of America. 2009;106:9362–7. doi: 10.1073/pnas.0903103106. [DOI] [PMC free article] [PubMed] [Google Scholar]
- 14.Consortium EP. An integrated encyclopedia of DNA elements in the human genome. Nature. 2012;489:57–74. doi: 10.1038/nature11247. [DOI] [PMC free article] [PubMed] [Google Scholar]
- 15.Dimas AS, Deutsch S, Stranger BE, Montgomery SB, Borel C, Attar-Cohen H, et al. Common regulatory variation impacts gene expression in a cell type-dependent manner. Science. 2009;325:1246–50. doi: 10.1126/science.1174148. [DOI] [PMC free article] [PubMed] [Google Scholar]
- 16.Myers AJ, Gibbs JR, Webster JA, Rohrer K, Zhao A, Marlowe L, et al. A survey of genetic human cortical gene expression. Nature genetics. 2007;39:1494–9. doi: 10.1038/ng.2007.16. [DOI] [PubMed] [Google Scholar]
- 17.Stranger BE, Montgomery SB, Dimas AS, Parts L, Stegle O, Ingle CE, et al. Patterns of cis regulatory variation in diverse human populations. PLoS genetics. 2012;8:e1002639. doi: 10.1371/journal.pgen.1002639. [DOI] [PMC free article] [PubMed] [Google Scholar]
- 18.Grundberg E, Small KS, Hedman AK, Nica AC, Buil A, Keildson S, et al. Mapping cis- and trans-regulatory effects across multiple tissues in twins. Nature genetics. 2012;44:1084–9. doi: 10.1038/ng.2394. [DOI] [PMC free article] [PubMed] [Google Scholar]
- 19.Nica AC, Parts L, Glass D, Nisbet J, Barrett A, Sekowska M, et al. The architecture of gene regulatory variation across multiple human tissues: the MuTHER study. PLoS genetics. 2011;7:e1002003. doi: 10.1371/journal.pgen.1002003. [DOI] [PMC free article] [PubMed] [Google Scholar]
- 20.Veyrieras JB, Kudaravalli S, Kim SY, Dermitzakis ET, Gilad Y, Stephens M, et al. High-resolution mapping of expression-QTLs yields insight into human gene regulation. PLoS genetics. 2008;4:e1000214. doi: 10.1371/journal.pgen.1000214. [DOI] [PMC free article] [PubMed] [Google Scholar]
- 21.Bryois J, Buil A, Evans DM, Kemp JP, Montgomery SB, Conrad DF, et al. Cis and trans effects of human genomic variants on gene expression. PLoS genetics. 2014;10:e1004461. doi: 10.1371/journal.pgen.1004461. [DOI] [PMC free article] [PubMed] [Google Scholar]
- 22.Qian M, Ma MW, Fleming NH, Lackaye DJ, Hernando E, Osman I, et al. Clinicopathological characteristics at primary melanoma diagnosis as risk factors for brain metastasis. Melanoma research. 2013;23:461–7. doi: 10.1097/CMR.0000000000000015. [DOI] [PMC free article] [PubMed] [Google Scholar]
- 23.Rendleman J, Shang S, Dominianni C, Shields JF, Scanlon P, Adaniel C, et al. Melanoma risk loci as determinants of melanoma recurrence and survival. Journal of translational medicine. 2013;11:279. doi: 10.1186/1479-5876-11-279. [DOI] [PMC free article] [PubMed] [Google Scholar]
- 24.Spector TD, Williams FM. The UK Adult Twin Registry (TwinsUK) Twin research and human genetics : the official journal of the International Society for Twin Studies. 2006;9:899–906. doi: 10.1375/183242706779462462. [DOI] [PubMed] [Google Scholar]
- 25.Moayyeri A, Hammond CJ, Hart DJ, Spector TD. The UK Adult Twin Registry (TwinsUK Resource) Twin research and human genetics : the official journal of the International Society for Twin Studies. 2013;16:144–9. doi: 10.1017/thg.2012.89. [DOI] [PMC free article] [PubMed] [Google Scholar]
- 26.Benjamini Y, Hochberg Y. Controlling the false discovery rate: a practical and powerful approach to multiple testing. Journal of the Royal Statistical Society. 1995;B 57:289–300. [Google Scholar]
- 27.Chen QR, Hu Y, Yan C, Buetow K, Meerzaman D. Systematic genetic analysis identifies Cis-eQTL target genes associated with glioblastoma patient survival. PloS one. 2014;9:e105393. doi: 10.1371/journal.pone.0105393. [DOI] [PMC free article] [PubMed] [Google Scholar]
- 28.Law MH, Bishop DT, Lee JE, Brossard M, Martin NG, Moses EK, et al. Genome-wide meta-analysis identifies five new susceptibility loci for cutaneous malignant melanoma. Nature genetics. 2015;47:987–95. doi: 10.1038/ng.3373. [DOI] [PMC free article] [PubMed] [Google Scholar]
- 29.Li Q, Seo JH, Stranger B, McKenna A, Pe’er I, Laframboise T, et al. Integrative eQTL-based analyses reveal the biology of breast cancer risk loci. Cell. 2013;152:633–41. doi: 10.1016/j.cell.2012.12.034. [DOI] [PMC free article] [PubMed] [Google Scholar]
- 30.Hsing CH, Cheng HC, Hsu YH, Chan CH, Yeh CH, Li CF, et al. Upregulated IL-19 in breast cancer promotes tumor progression and affects clinical outcome. Clinical cancer research : an official journal of the American Association for Cancer Research. 2012;18:713–25. doi: 10.1158/1078-0432.CCR-11-1532. [DOI] [PubMed] [Google Scholar]
- 31.Alanara T, Karstila K, Moilanen T, Silvennoinen O, Isomaki P. Expression of IL-10 family cytokines in rheumatoid arthritis: elevated levels of IL-19 in the joints. Scandinavian journal of rheumatology. 2010;39:118–26. doi: 10.3109/03009740903170823. [DOI] [PubMed] [Google Scholar]
- 32.Hsing CH, Hsu CC, Chen WY, Chang LY, Hwang JC, Chang MS. Expression of IL-19 correlates with Th2 cytokines in uraemic patients. Nephrology, dialysis, transplantation : official publication of the European Dialysis and Transplant Association - European Renal Association. 2007;22:2230–8. doi: 10.1093/ndt/gfm179. [DOI] [PubMed] [Google Scholar]
- 33.Gallagher G. Interleukin-19: multiple roles in immune regulation and disease. Cytokine & growth factor reviews. 2010;21:345–52. doi: 10.1016/j.cytogfr.2010.08.005. [DOI] [PubMed] [Google Scholar]
- 34.Alonso R, Suarez A, Castro P, Lacave AJ, Gutierrez C. Influence of interleukin-10 genetic polymorphism on survival rates in melanoma patients with advanced disease. Melanoma research. 2005;15:53–60. doi: 10.1097/00008390-200502000-00009. [DOI] [PubMed] [Google Scholar]
- 35.Howell WM, Turner SJ, Bateman AC, Theaker JM. IL-10 promoter polymorphisms influence tumour development in cutaneous malignant melanoma. Genes and immunity. 2001;2:25–31. doi: 10.1038/sj.gene.6363726. [DOI] [PubMed] [Google Scholar]
- 36.Martinez-Escribano JA, Moya-Quiles MR, Muro M, Montes-Ares O, Hernandez-Caselles T, Frias JF, et al. Interleukin-10, interleukin-6 and interferon-gamma gene polymorphisms in melanoma patients. Melanoma research. 2002;12:465–9. doi: 10.1097/00008390-200209000-00008. [DOI] [PubMed] [Google Scholar]
- 37.Park JY, Amankwah EK, Anic GM, Lin H-Y, Walls B, Park H, et al. Gene variants in angiogenesis and lymphangiogenesis and cutaneous melanoma progression. Cancer Epidemiol Biomarkers Prev. 2013;22:827–34. doi: 10.1158/1055-9965.EPI-12-1129. [DOI] [PMC free article] [PubMed] [Google Scholar]
- 38.Liao SC, Cheng YC, Wang YC, Wang CW, Yang SM, Yu CK, et al. IL-19 induced Th2 cytokines and was up-regulated in asthma patients. Journal of immunology. 2004;173:6712–8. doi: 10.4049/jimmunol.173.11.6712. [DOI] [PubMed] [Google Scholar]
- 39.Hildner K, Edelson BT, Purtha WE, Diamond M, Matsushita H, Kohyama M, et al. Batf3 deficiency reveals a critical role for CD8alpha+ dendritic cells in cytotoxic T cell immunity. Science. 2008;322:1097–100. doi: 10.1126/science.1164206. [DOI] [PMC free article] [PubMed] [Google Scholar]
- 40.Schraml BU, Hildner K, Ise W, Lee WL, Smith WA, Solomon B, et al. The AP-1 transcription factor Batf controls T(H)17 differentiation. Nature. 2009;460:405–9. doi: 10.1038/nature08114. [DOI] [PMC free article] [PubMed] [Google Scholar]
- 41.Mumm JB, Emmerich J, Zhang X, Chan I, Wu L, Mauze S, et al. IL-10 elicits IFNgamma-dependent tumor immune surveillance. Cancer cell. 2011;20:781–96. doi: 10.1016/j.ccr.2011.11.003. [DOI] [PubMed] [Google Scholar]
- 42.Tussiwand R, Lee WL, Murphy TL, Mashayekhi M, Kc W, Albring JC, et al. Compensatory dendritic cell development mediated by BATF-IRF interactions. Nature. 2012;490:502–7. doi: 10.1038/nature11531. [DOI] [PMC free article] [PubMed] [Google Scholar]
- 43.Punt S, Langenhoff JM, Putter H, Fleuren GJ, Gorter A, Jordanova ES. The correlations between IL-17 vs. Th17 cells and cancer patient survival: a systematic review. Oncoimmunology. 2015;4:e984547. doi: 10.4161/2162402X.2014.984547. [DOI] [PMC free article] [PubMed] [Google Scholar]
- 44.Murphy TL, Tussiwand R, Murphy KM. Specificity through cooperation: BATF-IRF interactions control immune-regulatory networks. Nature reviews Immunology. 2013;13:499–509. doi: 10.1038/nri3470. [DOI] [PubMed] [Google Scholar]
- 45.Yang H, Rudge DG, Koos JD, Vaidialingam B, Yang HJ, Pavletich NP. mTOR kinase structure, mechanism and regulation. Nature. 2013;497:217–23. doi: 10.1038/nature12122. [DOI] [PMC free article] [PubMed] [Google Scholar]
- 46.Kim DH, Sarbassov DD, Ali SM, Latek RR, Guntur KV, Erdjument-Bromage H, et al. GbetaL, a positive regulator of the rapamycin-sensitive pathway required for the nutrient-sensitive interaction between raptor and mTOR. Molecular cell. 2003;11:895–904. doi: 10.1016/s1097-2765(03)00114-x. [DOI] [PubMed] [Google Scholar]
- 47.Chi H. Regulation and function of mTOR signalling in T cell fate decisions. Nature reviews Immunology. 2012;12:325–38. doi: 10.1038/nri3198. [DOI] [PMC free article] [PubMed] [Google Scholar]
- 48.Zeng H, Chi H. mTOR and lymphocyte metabolism. Current opinion in immunology. 2013;25:347–55. doi: 10.1016/j.coi.2013.05.002. [DOI] [PMC free article] [PubMed] [Google Scholar]
- 49.Zeng H, Chi H. The interplay between regulatory T cells and metabolism in immune regulation. Oncoimmunology. 2013;2:e26586. doi: 10.4161/onci.26586. [DOI] [PMC free article] [PubMed] [Google Scholar]
Associated Data
This section collects any data citations, data availability statements, or supplementary materials included in this article.