Significance
The protein Pt43233 is a member of the Cys-Gly-His–rich (CGHR) protein family, and it was discovered to be a previously unidentified carbonic anhydrase (CA), designated as θ-CA. Moreover, Pt43233 is targeted to the lumen of the pyrenoid-penetrating thylakoid in the marine diatom Phaeodactylum tricornutum. Analysis of Pt43233 overexpression and RNAi mutants suggests this CA is essential for photosynthetic efficiency and growth in this diatom. The discovery of θ-CA within the pyrenoid-penetrating thylakoid of P. tricornutum implies direct use of the pH gradient across the thylakoid membrane as a means of supplying CO2 to the Calvin cycle. Alternatively, Pt43233 could regulate the function of photosystems, indicating that a common mechanism could have evolved convergently across diverse aquatic photoautotrophs.
Keywords: marine diatom, CGHR domain, luminal carbonic anhydrase, CO2-concentrating mechanism, pyrenoid
Abstract
The algal pyrenoid is a large plastid body, where the majority of the CO2-fixing enzyme, ribulose-1,5-bisphosphate carboxylase/oxygenase (RubisCO) resides, and it is proposed to be the hub of the algal CO2-concentrating mechanism (CCM) and CO2 fixation. The thylakoid membrane is often in close proximity to or penetrates the pyrenoid itself, implying there is a functional cooperation between the pyrenoid and thylakoid. Here, GFP tagging and immunolocalization analyses revealed that a previously unidentified protein, Pt43233, is targeted to the lumen of the pyrenoid-penetrating thylakoid in the marine diatom Phaeodactylum tricornutum. The recombinant Pt43233 produced in Escherichia coli cells had both carbonic anhydrase (CA) and esterase activities. Furthermore, a Pt43233:GFP-fusion protein immunoprecipitated from P. tricornutum cells displayed a greater specific CA activity than detected for the purified recombinant protein. In an RNAi-generated Pt43233 knockdown mutant grown in atmospheric CO2 levels, photosynthetic dissolved inorganic carbon (DIC) affinity was decreased and growth was constantly retarded; in contrast, overexpression of Pt43233:GFP yielded a slightly greater photosynthetic DIC affinity. The discovery of a θ-type CA localized to the thylakoid lumen, with an essential role in photosynthetic efficiency and growth, strongly suggests the existence of a common role for the thylakoid-luminal CA with respect to the function of diverse algal pyrenoids.
Marine diatoms are major primary producers, which are responsible for up to 20% of annual global carbon fixation (1, 2). To overcome the difficulties of CO2 limitation in alkaline and high-salinity seawater, diatoms use a CO2-concentrating mechanism (CCM) for the intracellular accumulation of dissolved inorganic carbon (DIC) (3). It is known that the marine pennate diatom, Phaeodactylum tricornutum, uses solute carrier 4 (SLC4) family transporters to take up HCO3− actively from the surrounding seawater (4). Based upon physiological measurements of cellular DIC flux, it has been hypothesized that accumulated HCO3− is further concentrated in the chloroplast and that an ample flux of CO2 to ribulose-1,5-bisphosphate carboxylase/oxygenase (RubisCO) is facilitated by the pyrenoidal β-carbonic anhydrases (CAs), PtCA1 and PtCA2 (5, 6). In this process, α-type CAs present in the matrices of the four-layered chloroplast membranes are thought to prevent leakage of CO2 from the chloroplast in P. tricornutum (7, 8).
Algal CCMs are distinct from their carboxysomal counterparts in cyanobacteria, and were most likely acquired by an extensive convergent evolution process (9). It is postulated that the algal CCM is composed of active DIC transport systems at the plasma membrane and the chloroplast envelope, as well as a highly localized CO2 formation system within close proximity to RubisCO. The possibility remains that the latter process occurs within the pyrenoid, an inner-chloroplastic protein body packed with RubisCO aggregates (10). In the green alga, Chlamydomonas reinhardtii, the pyrenoid is considered to be a functional analog of the cyanobacterial carboxysome; the operation of the CCM is synchronous with the formation of the pyrenoid (11). It is postulated that the pyrenoid maintains the accumulated CO2 in C. reinhardtii by preventing CO2 leakage from the chloroplast through the concerted action of a stromal β-CA, carbonic anhydrase 6 (CAH6), and a low-CO2–inducible (LCI) B/C protein complex (12, 13). The LCIB/C complex is located at a peripheral region of the pyrenoid under CO2-limiting conditions in the presence of light. Moreover, impairment of LCIB results in a lethal phenotype under moderate CO2 limitation but is nonlethal under severe CO2 limitations, indicating it operates under a specific low-CO2 range (12). This pyrenoid-based CCM in C. reinhardtii also includes enzymes within the thylakoid-invaginating pyrenoid, such as the thylakoid-luminal α-CA, CAH3, an enzyme that could be essential for producing an ample flux of CO2 to RubisCO by using the acidity of the thylakoid lumen (14, 15). Alternatively, it is also hypothesized that CAH3 can remove a proton from the water-oxidizing complex on the donor side of photosystem II (PSII) by supplying HCO3−, thus maintaining an optimal rate of oxygen evolution (16, 17).
Recent studies on secondary symbionts (e.g., marine diatoms) provide evidence for an alternate CCM to the CCM known for the freshwater primary-symbiont C. reinhardtii. In P. tricornutum, there are a number of putative HCO3− transporter genes belonging to the SLC4 and SLC26 families; PtSLC4-2 is a sodium-dependent HCO3− transporter at the plasma membrane (4). There are nine CA genes present within the P. tricornutum genome; five are α-type CAs localized in the matrices of the four-layered plastid membranes, two are β-CAs located in the pyrenoid, and two are mitochondrial γ-CAs (8). By contrast, P. tricornutum CAs are not known to occur in the thylakoid lumen, although pyrenoidal (not stromal) β-CAs, PtCA1 and PtCA2, have been described (8). Taken together, it is suggested that there are differences in the control of DIC flux at the pyrenoid in diatoms relative to C. reinhardtii.
In the present study, we provide evidence that P. tricornutum contains a previously unidentified CA, herein designated as a θ-CA. This θ-CA is found in the lumen of the pyrenoid-penetrating thylakoid and appears to be critical for photosynthetic efficiency and growth in the marine diatom P. tricornutum.
Results
The Cys-Gly-His–Rich Family in Diatoms.
Putative orthologs of the C. reinhardtii LCIB protein are widely distributed in bacteria, chlorophyta, glaucophyta, and heterokontophyta (12), and are divided into four distinct clades in this study on the basis of dissimilarity at the overall amino acid sequence level (Fig. S1). However, these orthologs contain a domain with highly conserved amino acids, CDGAHPHGRCG, within a sequence length of ∼110 amino acids (Fig. 1). Henceforth, this domain is referred to as the Cys-Gly-His–rich (CGHR) domain.
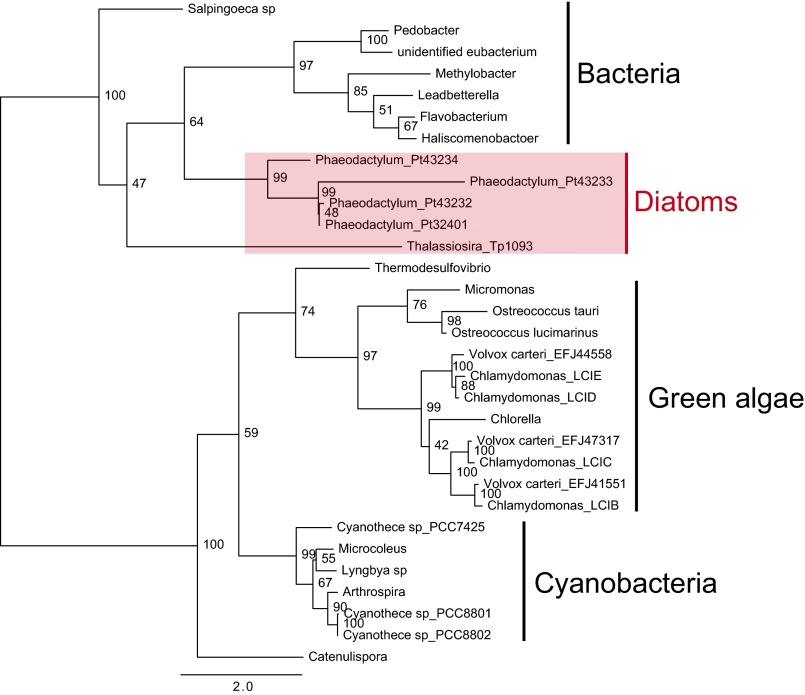
Fig. S1.
Phylogenetic tree of CGHR family proteins. Bootstrap values are shown at the node of the respective branches. The bar shown underneath the tree indicates the number of substitutions per site.
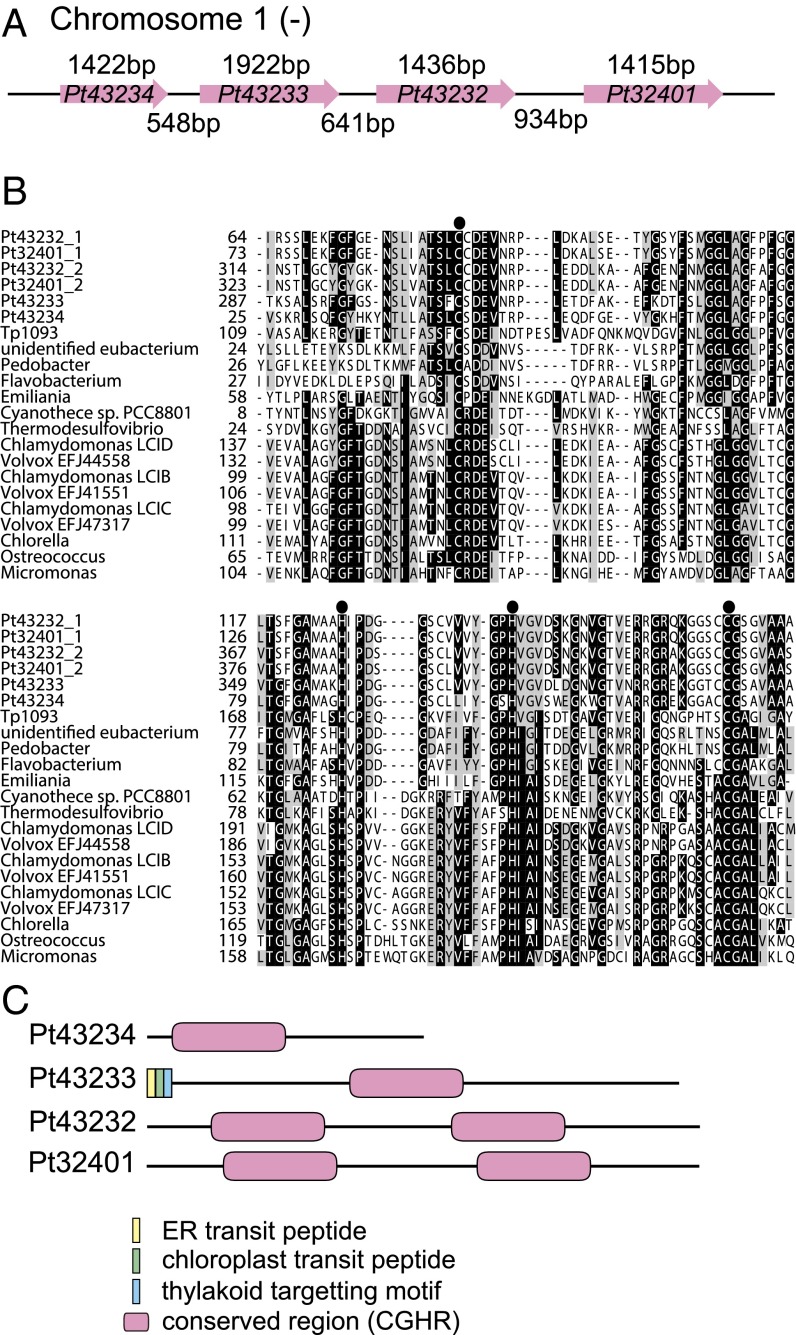
Fig. 1.
Structural comparison of CGHR family members in the P. tricornutum genome and conserved regions in CGHR family proteins from other photoautotrophs. (A) Schematic drawing of P. tricornutum CGHR family genes on chromosome 1. Magenta arrows indicate the cDNA sequence regions for CGHR family genes, and the numbers above the arrows represent their corresponding lengths. The numbers shown below the arrows indicate the length of noncoding regions. (B) Comparison of the conserved regions in CGHR family proteins from bacteria, cyanobacteria, and eukaryotic algae. (C) Schematic drawings of notable domain structures of four P. tricornutum CGHR family members.
The P. tricornutum genome contains four genes within the CGHR family that are clustered together on chromosome 1, specifically Pt43234, Pt43233, Pt43232, and Pt32401; in silico translations of these gene sequences revealed their CGHR domains are well conserved in proteins belonging to distant photoautotrophs (Fig. 1 A and B). Phylogenetic analysis revealed a similarity of the CGHR family proteins between diatoms and bacteria. In contrast, the diatom CGHR family was distinct from CGHR family proteins in cyanobacteria and green algae (Fig. S1). The P. tricornutum CGHR family contains diversely arranged CGHR domains (Fig. 1C). Pt43233 and Pt43234 each possess one CGHR domain, which is located at the central portion and N terminus of the polypeptide, respectively, whereas both Pt43232 and Pt32401 possess two CGHR domains and are 95% identical at the amino acid level. An in silico analysis of the four CGHR proteins revealed an absence of subcellular targeting signals for Pt43232, Pt43234, and Pt32401 (Fig. 1C). In addition, all four CGHR proteins did not possess membrane-spanning helices. The N-terminal transit peptide sequence in Pt43233 consisted of an endoplasmic reticulum (ER) signal and a plastid-transit sequence (TAA-FQT) at the predicted cleavage site of the ER signal (Fig. S2A), corresponding to one of the variants of the ASA-FAP motif (18). Moreover, the Pt43233 sequence contained the thylakoid-targeting domain (TTD) (19) (Fig. 1C and Fig. S2A). Thereafter, our primary focus was the biochemical and functional characterization of the putative chloroplastic CGHR protein, Pt43233.
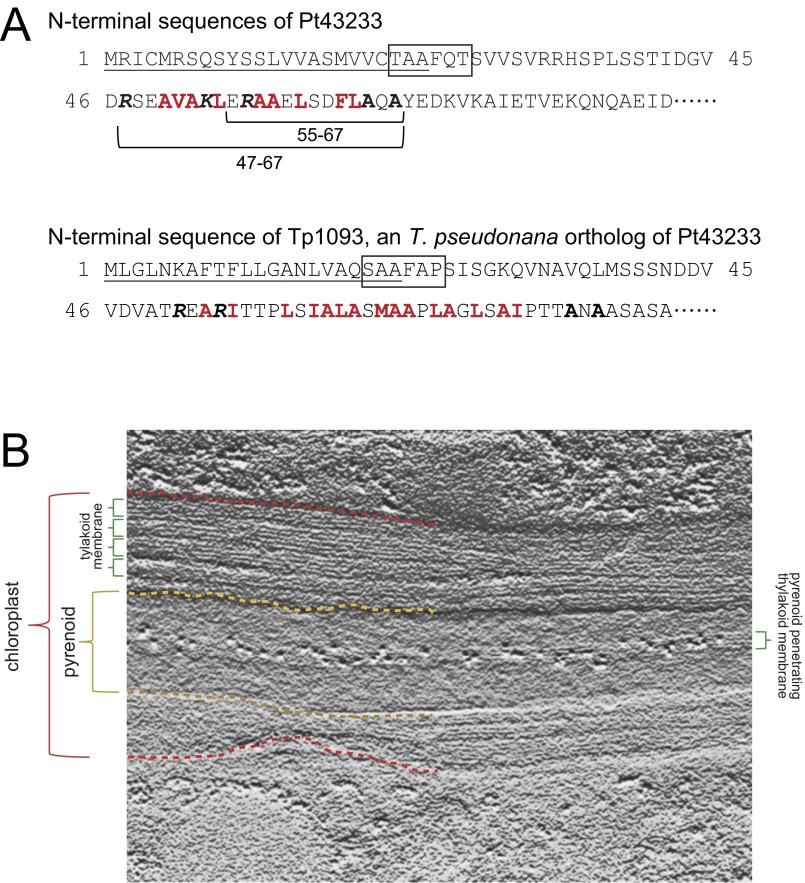
Fig. S2.
(A) N-terminal sequences of Pt43233 and Tp1093. (Upper) N-terminal sequence of a CGHR family protein, Pt43233, in P. tricornutum is shown. (Lower) N-terminal sequence of the T. pseudonana ortholog of Pt43233 is also shown. ER signals predicted by SignalP are underlined. Chloroplast transit sequences are boxed. Hydrophobic amino acid residues are represented by bold red font. The italicized bold K and R indicate positively charged Lys and Arg preceding the hydrophobic domain. Ala in the TTD AXA motif is represented by bold font. The TTD sequences deleted in the experiment presented in Fig. 2 I and J are indicated by horizontal parentheses with residue numbers in the N-terminal Pt43233 sequence. (B) Relief image conversion of a part of the photograph in Fig. 2E. An enhanced image of the membrane and pyrenoid structures displayed the chloroplast envelope area (dashed red line), the boundary between the stroma and the pyrenoid (dashed yellow line), and thylakoid membrane structures between the chloroplast envelope and the pyrenoid, or in the central part of the pyrenoid (green parentheses).
Subcellular Localization and Environmental Responses of Pt43233.
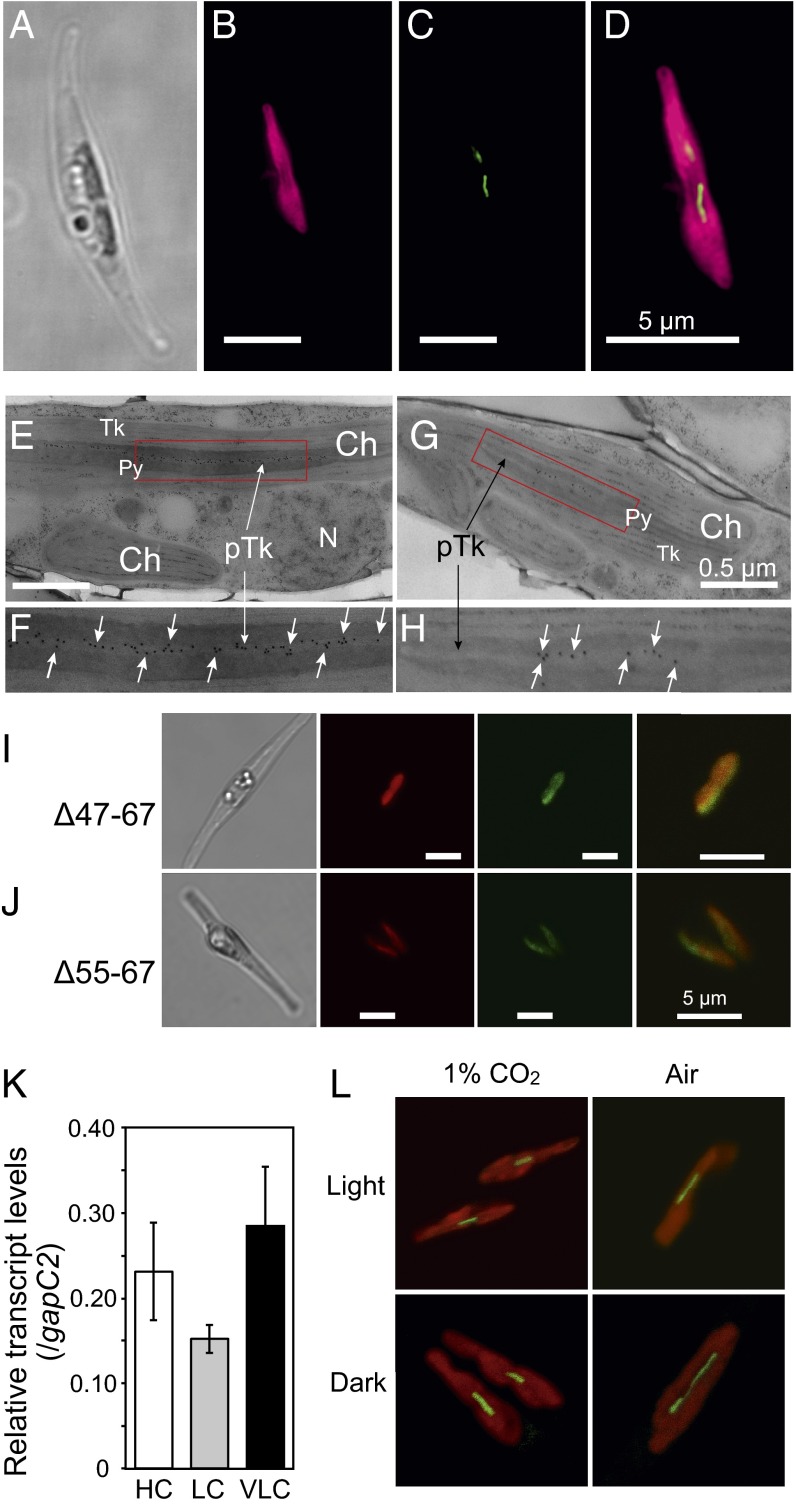
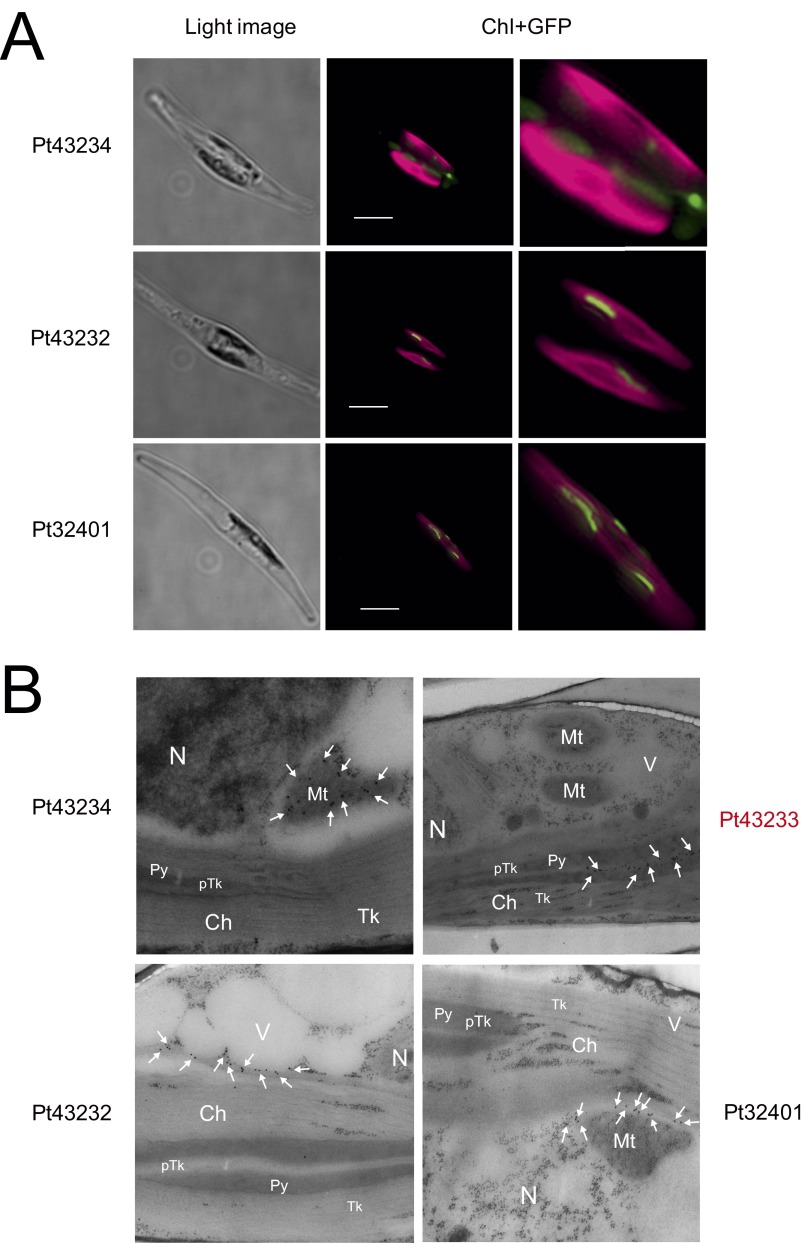
Subcellular localization of Pt43233 was carried out by expressing a C-terminal GFP-fusion protein in P. tricornutum. The fluorescence signal associated with a Pt43233:GFP transformant (clone 1, Pt43233:GFP1) was visible as a rod shape within the center of the chloroplast (Fig. 2 A–D). Additional analysis of Pt43233:GFP1 subcellular localization was done immunohistochemically using transmission electron microscopy (TEM) and compared with another clone harboring Pt43233:GFP (clone 2, Pt43233:GFP2). For both Pt43233:GFP transformants, the protein was located on the thylakoid membrane structure and within the pyrenoid (Fig. 2 E and F and Fig. S2B for clone 1 and Fig. 2 G and H for clone 2). This finding is in agreement with the in silico analysis of the N-terminal signal sequence (Fig. 1C). A similar analysis with a Pt43233:GFP-fusion protein minus the putative TTD (Pt43233Δ47–67:GFP) (Fig. S2A) revealed this protein to be targeted to the stroma (Fig. 2I). Stromal targeting was also evident for a deletion mutant of the second alanine-rich region in the TTD (Pt43233Δ55–67:GFP) (Fig. 2J). By comparison, fluorescence microscopy revealed that CGHR proteins, Pt43232 and Pt32401, were rod-like in appearance and localized to the extra-chloroplastic space (Fig. S3A). TEM confirmed these proteins resided in the mitochondrion or outside of the chloroplast (Fig. S3B). Taken together, these data indicate that amino acid residues 47–67 within the N terminus of Pt43233 serve as a TTD and that Pt43233 resides in the lumen of the pyrenoid-penetrating thylakoid. Interestingly, the centric diatom, Thalassiosira pseudonana, also possesses a putative CGHR family gene (Tp1093), and the deduced amino acid sequence also contains a plastid transit peptide and a TTD (Figs. S1 and S2A).
Fig. 2.
Subcellular localization and transcript abundance analysis of Pt43233. Superresolution microscopy analysis of Pt43233:GFP localization in a P. tricornutum Pt43233:GFP1 mutant: light image (A), chlorophyll autofluorescence (B, red), GFP fluorescence (C, green), and merged image of B and C (D). (Scale bars, 5 μm.) (E) Immunogold labeling TEM image of the Pt43233:GFP1 mutant. The Pt43233:GFP1 mutant was subjected to TEM following immunogold labeling with anti-GFP antibody. Representative gold particles are indicated by the white arrows in E–H. (F) Magnification of the box in E. (G) Immunogold labeling TEM image of the Pt43233:GFP2 mutant. (H) Magnification of the box in G. (I and J) Respective subcellular localization analysis of Pt43233Δ47–67:GFP and Pt43233Δ55–67:GFP by laser-scanning confocal microscopy. A light image (Left), chlorophyll autofluorescence (Left Center), GFP (Right Center), and merged image (Right) are shown. (Scale bars, 5 μm.) (K) Quantitative RT-PCR analysis of changes in transcript levels in response to changing CO2 conditions. Pt43233 transcript levels in P. tricornutum cells cultured under 5% (vol/vol) CO2 (HC), atmospheric air (LC), or very low CO2 (VLC; <0.002%) with continuous illumination. The gapC2 gene was used as the internal standard. The error bars indicate SDs of three separate experiments. (L) Localization analysis of Pt43233:GFP in Pt43233:GFP2 mutant grown under 1% CO2 (1%) and 0.04% CO2 (Air) under light and dark conditions.
Fig. S3.
Localization of CGHR family proteins in P. tricornutum. (A) SIM images of P. tricornutum mutants expressing Pt43234:GFP, Pt43232:GFP, or Pt32401:GFP. The light image (Left), merged image (Center), and magnified merged image (Right) are shown. (Scale bars, 5 μm.) The GFP signal was likely located at the surface or outside the chloroplast in all images. (B) Immunogold labeling TEM images of P. tricornutum cells expressing Pt43234:GFP, Pt43233:GFP, Pt43232:GFP, or Pt32401:GFP. Only Pt43233:GFP was targeted to the pyrenoid-penetrating thylakoid; however, in contrast, Pt43234:GFP was targeted to the mitochondria; Pt43232:GFP was targeted at the space between the chloroplast and the vacuole; and Pt32401 was targeted at the space between the mitochondria and the chloroplast. Arrows are used to represent gold particles. Ch, chloroplast; Mt, mitochondria; N, nucleus; pTk, pyrenoid-penetratng thylakoid; Py, pyrenoid; Tk, thylakoid; V, vacuole.
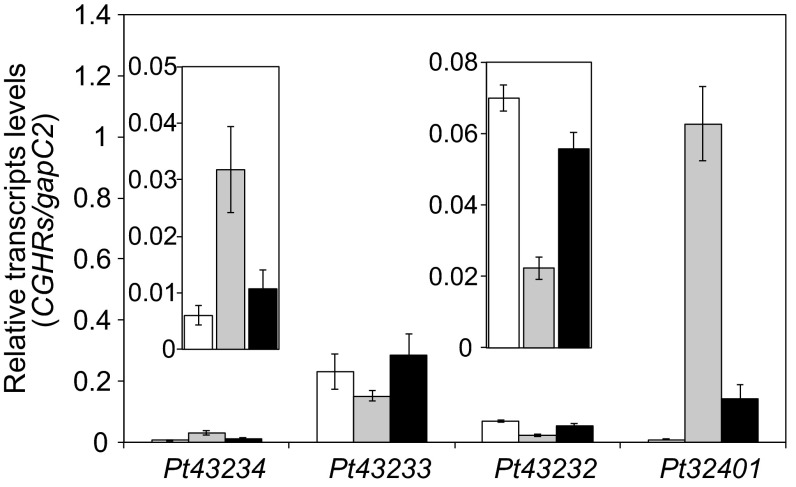
Transcript levels of endogenous Pt43233 were not altered in response to varying CO2 levels, including cells cultured under high (1% CO2), atmospheric air (0.04% CO2), and very low (<0.002% CO2) CO2, indicating that this protein is not transcriptionally regulated by CO2 (Fig. 2K). Subcellular localization of an exogenous Pt43233:GFP fusion in Pt43233:GFP2 cells was not altered by growth under a range of CO2/light conditions (Fig. 2L), implying that Pt43233 is a constitutive thylakoid-luminal factor specifically localized at the pyrenoid-penetrating thylakoid. Structural details of the pyrenoid-containing chloroplast with thylakoid membranes are illustrated in Fig. S2B. Localization and transcriptional responses of all CGHR factors are listed in Figs. S3 and S4.
Fig. S4.
Transcript levels quantified by qRT-PCR under changing CO2 conditions. Transcript levels of CGHR genes were measured in P. tricornutum cells grown under high-CO2 (open bar), atmospheric air (gray bar), or very-low-CO2 (closed bar) conditions with continuous illumination. Transcript levels were normalized to the transcript levels of the gapC2 gene. Data represent the mean ± SD of three separate experiments. The transcript level of Pt43232 under the high-CO2 condition was 3.1-fold higher than for air-grown cells. Respective Pt43234 and Pt32401 transcript levels were 5.4-fold and 120-fold higher, under the air-grown condition compared with the transcript levels of 1% CO2-grown cells. The transcript level of Pt32401 was more significantly responsive to low CO2 than the other CGHR factors, and the accumulation level of Pt32401 under the air-grown condition was higher than the other CGHR factors. Under the very-low-CO2 condition, the Pt43234 and Pt32401 transcript levels were reduced significantly.
Pt43233 as a θ-Type CA.
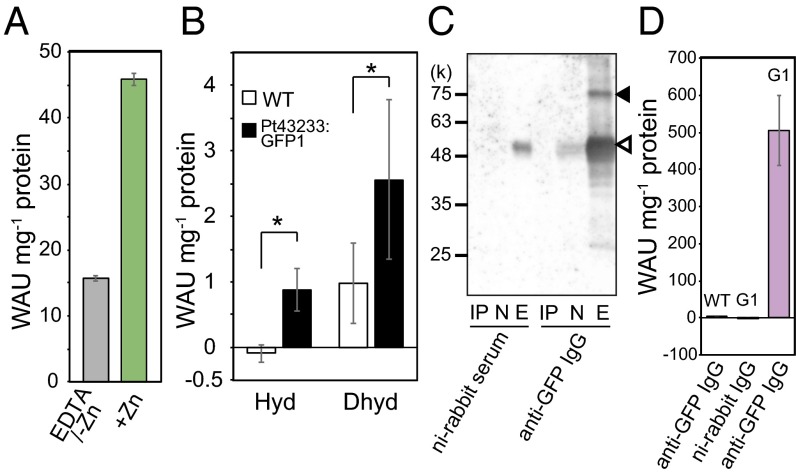
The CGHR domain contains a well-conserved sequence (Fig. 1B) with C, D, and H amino acid residues, forming a putative divalent cation-chelating moiety, which is a prominent feature in CA and zinc-finger proteins (20). In fact, the purified recombinant Pt43233 (Fig. S5A) contained a Zn/protein molar ratio of 1.43 ± 0.4, which was about 14-fold greater than the Zn/protein molar ratio of cytochrome c (0.10 ± 0.04 mol⋅mol−1 protein), a non-Zn chelating metalloprotein (Table S1). Indeed, the purified recombinant Pt43233 had CO2 hydration [30.9 ± 0.8 Wilbur–Anderson unit (WAU)⋅mg−1 protein] and HCO3− dehydration (42.2 ± 0.8 WAU⋅mg−1 protein) activities (Table S1). The recombinant Pt43233 was further treated with 1 mM EDTA to chelate Zn2+, followed by dialysis with a Zn2+-free buffer. The CA activity of the Zn-free Pt43233 preparation was reduced by 33% relative to the Zn-containing Pt43233 (Fig. 3A), confirming that Zn is required for optimal CA activity in Pt43233.
Fig. S5.
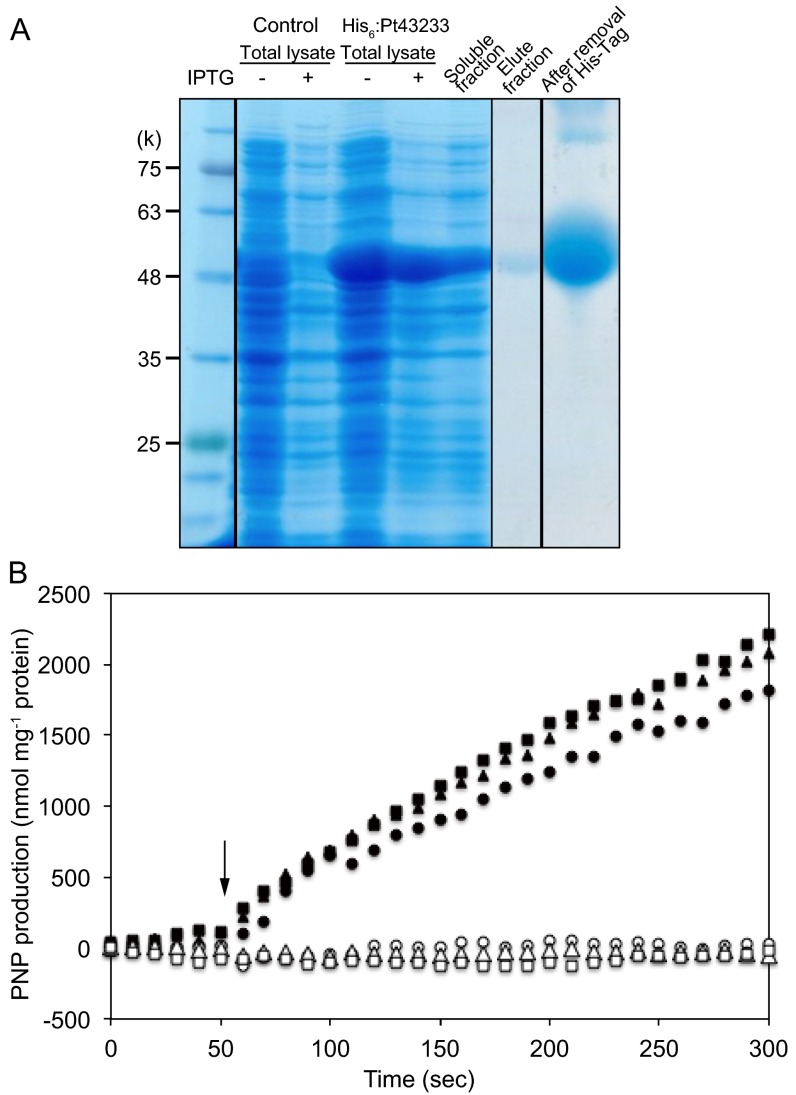
Purification of recombinant Pt43233 protein and determination of esterase activity. (A) Purification of recombinant Pt43233 from E. coli. The N-terminal His6-tagged Pt43233 protein was purified by an IMAC column, followed by His6-tag removal by thrombin cleavage. The fractions were separated by SDS/PAGE and visualized by Coomassie Brilliant Blue (CBB) staining. (B) Time course of esterase activity detected in the absence (open symbols) and presence (closed symbols) of Pt43233. The circles, squares, and triangles represent data from three independent measurements; the arrow indicates the addition point of the substrate, p-nitrophenyl (PNP) acetate.
Table S1.
Enzymological property of Pt43233
| Protein | Zinc content | CA activity | Esterase activity, nmol⋅min−1⋅mg−1 | |
| CO2 hydration | HCO3− dehydration | |||
| Pt43233 | 1.43 ± 0.40* | 30.9 ± 0.8† | 42.2 ± 0.8† | 773.9 ± 88.1† |
| BH Cytc | 0.10 ± 0.04† | N.D. | N.D. | N.D. |
| BSA | N.D. | 0.03 ± 0.03† | 0.04 ± 0.05† | −0.8 ± 59.4† |
Zinc content (mol⋅mol−1 protein), CA activity (WAU⋅mg−1 protein), and esterase activity (nmol⋅min−1⋅mg−1 protein) are listed for purified recombinant Pt43233 and two negative control proteins: bovine heart cytochrome c (BH Cytc) and BSA. N.D., not determined.
Values are the mean ± SD of the four separate measurements.
Values are the mean ± SD of the three separate measurements.
Fig. 3.
CA activity of Pt43233. (A) CA activity of the purified recombinant Pt43233 in the absence (gray) and presence (green) of Zn. (B) CO2 hydration (Hyd) and HCO3− dehydration (Dhyd) activities of cell lysates of WT (open bar) and Pt43233:GFP1 mutant (closed bars) grown under 1% CO2. The result of the t test is indicated (*P < 0.05). (C) Western blot analysis of Pt43233:GFP following immunoprecipitation with anti-GFP antibody. E, eluted fraction; IP, input; N, nonbinding fraction; ni, nonimmune. The protein band corresponding to Pt43233:GFP is represented by the closed arrowhead, and the IgG protein band is represented by the open arrowhead. (D) CA activity of Pt43233:GFP immunoprecipitated with anti-GFP antibody. As a control, WT and Pt43233:GFP1 (G1) cell lysates were immunoprecipitated with anti-GFP IgG and nonimmune rabbit IgG, respectively. The error bar indicates the SD of three separate experiments.
To confirm the occurrence of CA in vivo, cell lysate of the Pt43233:GFP overexpressing transformant (clone 1) was assayed for CA activity. Total CO2 hydration activity at pH 8.0–8.3 was marginal in cell lysate prepared from 1% CO2-grown wild-type (WT) cells, whereas the HCO3− dehydration rate at pH 5.7–6.0 was ∼1.0 WAU⋅mg−1 protein (Fig. 3B, open bar). By contrast, cell lysate prepared from 1% CO2-grown Pt43233:GFP1 cells displayed dramatically higher CO2 hydration and HCO3− dehydration (Fig. 3B, closed bar), implying this additional CA activity was due to the overexpression of Pt43233.
Pt43233:GFP was immunoprecipitated from the Pt43233 overexpression line, Pt43233:GFP1, with anti-GFP antibody. Western blotting analysis of the protein-A Sepharose chromatography eluate revealed the presence of an 85-kDa polypeptide matching the predicted molecular mass of the Pt43233:GFP fusion protein (Fig. 3C). The final preparation was contaminated with the 50-kDa anti-GFP IgG. The specific CO2 hydration activity of this partially purified Pt43233:GFP preparation was extremely high, whereas CA activity was not detected when the WT and Pt43233:GFP1 lysates were immunoprecipitated with anti-GFP IgG and nonimmune IgG, respectively (Fig. 3D).
Interestingly, the recombinant Pt43233 also displayed esterase activity (Fig. S5B and Table S1), which is a known characteristic of α- and δ-type CAs (21, 22). When p-nitrophenyl acetate was used as a substrate, Pt43233 contained an esterolysis specific activity of 773.9 ± 88.1 nmol⋅min−1⋅mg−1 protein. The results of CA and esterase assays suggest that Pt43233 is a previously unidentified type of CA, classified as a θ type, albeit with enzyme characteristics similar to those enzyme characteristics apparent for α- and δ-type CAs.
Impacts of Overexpression and Silencing of Pt43233 on Growth and Photosynthesis.
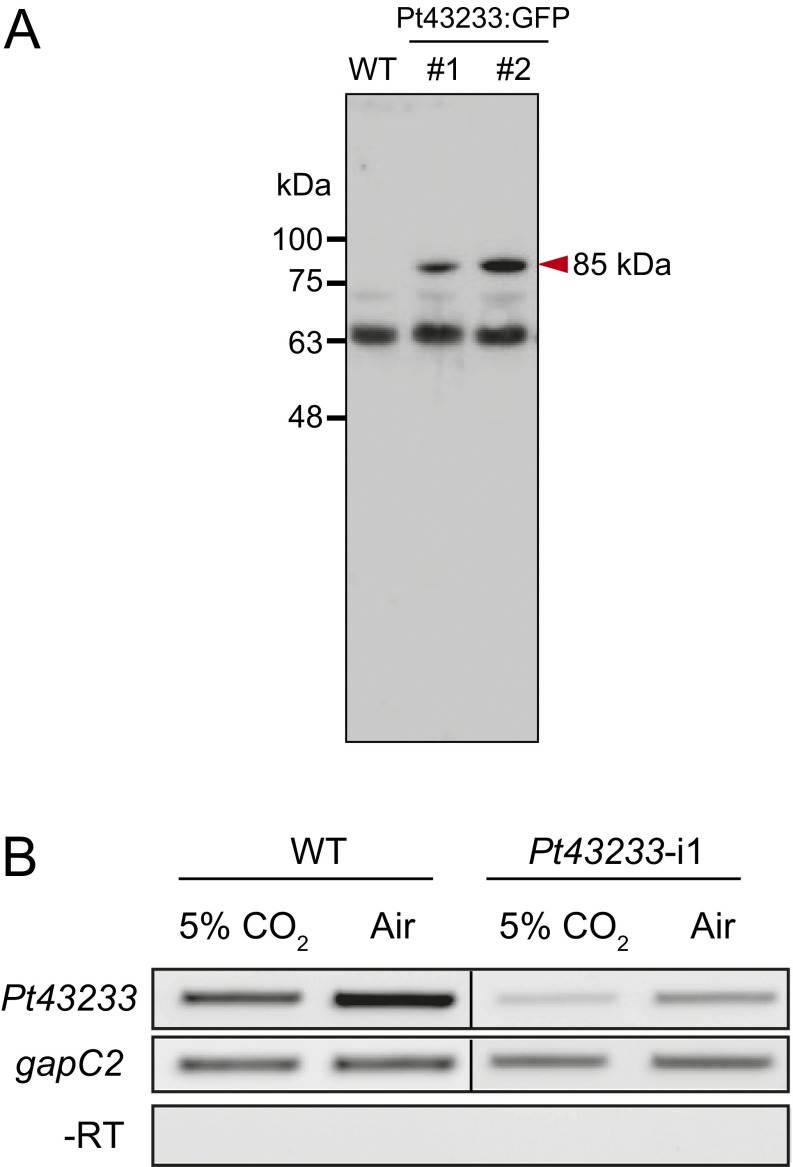
The separate impacts of an exogenously introduced Pt43233:GFP, driven by a fucoxanthin chlorophyll (Chl) a/c binding protein gene promoter (PfcpA), which is known to be a CO2-independent promoter, and RNAi silencing of Pt43233 on growth and photosynthesis were examined. Western blot analysis of cell lysates prepared from separate Pt43233:GFP transformants (clones 1 and 2) revealed an immunoreactive 85-kDa protein, matching the predicted Mr of the fusion protein (Fig. S6A). RNAi suppression of Pt43233 transcript levels in the Pt43233-i1 mutant was confirmed by RT-PCR (Fig. S6B); this mutant cell line was subjected to further experiments.
Fig. S6.
Confirmation of overexpression and silencing of Pt43233. (A) Western blot analysis of Pt43233:GFP-fusion protein in air-grown WT cells, Pt43233:GFP1 transformant (#1) cells, and Pt43233:GFP2 transformant (#2) cells probed with an anti-GFP rabbit antibody. Immunoblots indicate an 85-kDa immunoreactive band, the estimated size of Pt43233:GFP, in lysates of Pt43233:GFP cells (red arrowhead), but not in WT lysates. (B) Semi–qRT-PCR analysis of Pt43233 transcript level in Pt43233-i1 cells grown under 5% (vol/vol) CO2 and air. The gapC2 gene was used as the internal standard.
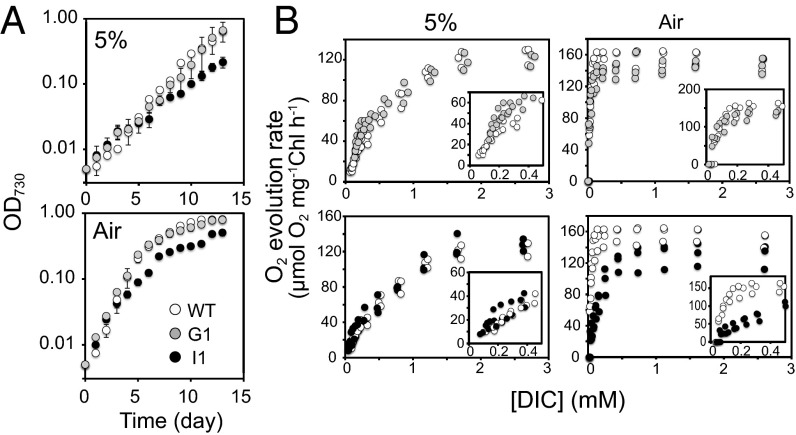
The growth characteristics of the Pt43233:GFP1 and Pt43233-i1 mutants were determined for cells cultured under air or 5% (vol/vol) CO2. The pH of the medium in the high-CO2 culture was in the range of 7.3–7.6, and it was in the range of 7.7–8.0 for air-cultured cells. The doubling rate of Pt43233:GFP1 cells was comparable to the doubling rate of WT cells, regardless of CO2 conditions. By contrast, the doubling rates of Pt43233-i1 cells were 64% and 57% of WT cells cultured under 5% (vol/vol) CO2 and air, respectively (Fig. 4A and Table 1), implying that Pt43233 is pivotal for growth.
Fig. 4.
Effect of Pt43233 overexpression and down-regulation on photosynthetic parameters and growth of P. tricornutum. (A) Growth curves of WT, Pt43233:GFP1 (G1), and Pt43233-i1 (I1) cells. Cells were cultured under 5% (vol/vol) CO2 (5%) or 0.04% CO2 (Air). Data represent mean ± SD of three separate experiments. (B) Kinetic plots of photosynthetic rate in WT, G1, and I1 cells cultivated under 5% (vol/vol) CO2 (5%; Left) and 0.04% CO2 (Air; Right). (Insets) Plots at low DIC concentrations. In all plots, open circles represent WT cells, closed gray circles represent G1 cells, and closed black circles represent I1 cells.
Table 1.
Growth and photosynthetic characteristics in WT, Pt43233:GFP1, and Pt43233-i1 cells determined in the standard seawater pH (8.2)
| CO2 | Cell | Doubling rate, times, d−1 | Pmax,* μmol O2 mg−1 Chl h−1 | K0.5[DIC],† μM | APC, μmol O2 L⋅μmol−1 DIC mg−1 Chl h−1 |
| 5% (vol/vol) | WT | 0.64 ± 0.07 | 157.4 ± 11.2 | 697.3 ± 136.5 | 0.19 ± 0.08 |
| Pt43233:GFP1 | 0.52 ± 0.07 | 149.1 ± 1.6 | 428.5 ± 117.2 | 0.38 ± 0.13 | |
| Pt43233-i1 | 0.41 ± 0.06 | 160.9 ± 15.9 | 757.7 ± 141.1 | 0.18 ± 0.15 | |
| Air | WT | 0.92 ± 0.13 | 163.0 ± 0.9 | 36.0 ± 2.7 | 4.2 ± 0.7 |
| Pt43233:GFP1 | 0.80 ± 0.04 | 152.4 ± 7.6 | 30.6 ± 8.3 | 3.5 ± 0.9 | |
| Pt43233-i1 | 0.52 ± 0.04 | 139.1 ± 19.3 | 168.9 ± 37.2 | 1.0 ± 0.4 |
All values are mean ± SD of the three separate experiments.
Maximum photosynthetic rate.
[DIC] to give half-maximum Pmax.
The impact of Pt43233 overexpression on photosynthetic parameters was determined for P. tricornutum cells cultured in standard seawater at pH 8.2. The DIC concentration to give one-half-maximum rate of photosynthesis (K0.5[DIC]) of Pt43233:GFP1 cells decreased to 61% relative to WT cells when cultured under 5% (vol/vol) CO2, although such a difference in photosynthetic parameters between Pt43233:GFP and WT cells was not observed when cultured in air (Fig. 4B and Table 1). This increase in photosynthetic affinity for DIC in 5% CO2-grown Pt43233:GFP1 cells was associated with an increase in the apparent photosynthetic conductance (APC), which was twofold greater than the APC of WT cells (Table 1). Pt43233:GFP2 cells grown under 1% CO2 rendered a K0.5[DIC] value that was about 67% of the K0.5[DIC] value apparent in WT cells under an assay condition at pH 7.5 (Table S2). These results suggest that overexpression of Pt43233 could confer a stimulated photosynthetic DIC affinity independent of assay pH on high-CO2–grown cells whose endogenous biophysical CCM is largely suppressed (3, 23). In contrast, photosynthetic parameters were not affected by the overexpression of Pt43233:GFP in air-grown cells (Fig. 4B and Table 1).
Table S2.
Growth and photosynthetic characteristics in WT, Pt43233:GFP2, and Pt43233-i1 cells determined in the seawater of altered pHs
| Growth CO2 | pH in the assay condition | Cell | Relative doubling rate to WT* | Relative Pmax to WT | Relative K0.5[DIC] to WT | Relative APC to WT |
| 1% | 7.5 | Pt43233:GFP2 | 1.06 ± 0.12 | 0.85 ± 0.04 | 0.67 ± 0.08 | 1.12 ± 0.11 |
| Air | 7.5 | Pt43233-i1 | 0.65 ± 0.04 | 0.72 ± 0.01 | 1.81 ± 0.24 | 0.40 ± 0.07 |
| 9.0 | Pt43233-i1 | 0.65 ± 0.04 | 0.72 ± 0.02 | 1.68 ± 0.61 | 0.45 ± 0.05 |
All values are mean ± SD of the three to five separate experiments.
Value was determined in the culture medium condition (pH 7.3–7.6 for 1% CO2 and pH 7.7–8.0 for 0.04% CO2).
The functional relevance of Pt43233 for photosynthetic efficiency was evaluated at a media pH of 8.2 in an experiment using Pt43233-i1 cells. K0.5[DIC] in air-grown Pt43233-i1 cells had an approximate 4.5-fold higher value relative to WT cells, although little difference in K0.5[DIC] was observed between high-CO2–grown WT and Pt43233-i1 cells (Fig. 4B and Table 1). When grown under air, the maximum photosynthetic capacity (Pmax) in Pt43233-i1 cells was reduced to 85% of the Pmax detected in WT cells (Fig. 4B and Table 1). The APC of air-grown Pt43233-i1 cells was about 24% of the APC of WT cells (Table 1). These photosynthetic characteristics in Pt43233-i1 cells relative to the photosynthetic characteristics in WT cells were highly similar in a range of the assay pHs from 7.5 to 9.0 in cells grown under air condition (Table S2).
Discussion
The variation in the localization of CA within chloroplasts of C. reinhardtii and P. tricornutum has suggested fundamental differences in the function of the pyrenoids with respect to their DIC flux control mechanisms and mechanistic diversity in the algal CCM (7, 8). However, the biochemical and physiological investigations of Pt43233 revealed that the potential function of the pyrenoid-penetrating thylakoid in the final step of the CCM is consistent between freshwater green alga and marine diatoms, implying the function of CA in the thylakoid lumen to be a general mechanism in some algal CCMs and photosynthesis. In addition, this study strongly implies the convergent evolution of algal CCMs consisting of a wide spectrum of CCM components of diverse origins, culminating in a common DIC flux control system around RubisCO by using the pH environment of the thylakoid lumen. Biochemical characterization of Pt43233 revealed it to be a previously unidentified θ-CA, which is targeted to the lumen of the pyrenoid-penetrating thylakoid by an N-terminal signal sequence (Fig. 2 I and J and Fig. S2), suggesting its role is tightly associated with pyrenoid function.
CAs are known to contain divalent metal ions (usually Zn) at their active site, whereby Zn is coordinated to three histidines in α, γ-, and δ-CAs, whereas β- and ζ-CAs are bound to one histidine, two cysteines,; and sometimes an additional aspartate (24, 25). A η-CA in the malaria parasite, Plasmodium falciparum, has three histidines for Zn coordination and is phylogenetically related to α-CA (26). Apart from their CGHR domains, the four CGHR family factors in P. tricornutum are dissimilar to LCIB/D in C. reinhardtii. The detection of Zn in purified Pt43233 strongly suggests that at least three residues of the highly conserved CGHR domain residues in Pt43233, specifically Cys307, Asp309, His349, His363, and Cys387, are responsible for Zn binding (Fig. 1B). Indeed, the presence of an active site coordinated Zn increased CA activity of Pt43233 (Fig. 3A). On the basis of putative active-site amino acids, θ-CA is dissimilar to α- and δ-CAs and most similar to β- and ζ-CAs, which use cysteine, histidine, and sometimes aspartate for Zn coordination (24, 25). By contrast, the recombinant Pt43233 exhibited esterase activity in addition to CA activity (Fig. S5B and Table S1). Esterase activity is well known for α- and δ-CAs, and together with the evidence for Zn binding to the active site, the biochemical properties of this θ-CA appear to be distinct from other known CAs.
The specific CA activity of the recombinant Pt43233 was low for this type of enzyme. The reason for this low activity is unclear, but it is possible that a posttranslational activation mechanism is required for maximum activity in diatom cells, such as redox modification, glycosylation, or phosphorylation, which could be absent in the recombinant protein produced in E. coli cells. In fact, immunoprecipitation of a Pt43233:GFP fusion protein from P. tricornutum transformants with anti-GFP antibody yielded a partially purified CA with a specific activity of 500 WAU⋅mg−1 protein (Fig. 3D). It is worth mentioning that the immunoprecipitated Pt43233:GFP-fusion protein preparation was contaminated with anti-GFP IgG (Fig. 3C); it is expected that final specific activity in a homogeneous preparation should be a few fold higher, approximating the specific activity known for α- and β-type CAs, measured at 900–6,500 WAU⋅mg−1 protein and 1,200 WAU⋅mg−1 protein, respectively (21, 27). Taken together, these results suggest that θ-CA activity is posttranslationally regulated in vivo. Such CA activation mechanisms are not without precedent, because the activity of CAH3, a thylakoid-luminal CA in C. reinhardtii, is regulated by phosphorylation (28).
Recent evidence points to the LCIB/C complex being localized around the pyrenoid in C. reinhardtii, and these proteins are postulated to be a part of a CO2 recapturing system following leakage from the pyrenoid associated with the stromal β-CA, CAH6 (12). Alternatively, these proteins have been proposed to serve as components of the physical diffusion barrier against the CO2 leakage (12, 29). This assumption is rational, given the spatial configurations of known CCM factors, specifically CAs that exist outside of the pyrenoid in C. reinhardtii. Furthermore, this DIC flux control system in C. reinhardtii is supported by a vast supply of CO2 from the thylakoid-luminal α-CA, CAH3, which is promoted by luminal acidity under active photosynthesis (13, 15); no pyrenoidal CA has been described for C. reinhardtii. By contrast, the distribution of CA around the pyrenoid in marine diatoms does not fit the model described for the Chlamydomonas-type pyrenoid function; specifically, there is no thylakoidal CA or a free stromal CA in P. tricornutum, although pyrenoidal β-CAs, PtCA1 and PtCA2, do exist (8). However, the discovery of the θ-CA Pt43233 in the thylakoid lumen partially resolves this discrepancy regarding the location of biochemical and functional components associated with both CCMs. The direct utilization of the pH gradient across the thylakoid membrane yields an ample flux of CO2 toward RubisCO, which could represent an essential evolutionary driving force for the functionality of the pyrenoid to ensure the efficient generation of CO2 from HCO3− accumulated by algal biophysical CCMs. Although the origin of the components involved in this process appear to be extremely diverse and their physiological roles are inconsistent across CCM-using organisms, evolution may have strongly selected for this CCM system regardless of taxa and living environment.
Overexpression and knockdown mutants of Pt43233, respectively, culminated in the stimulation of photosynthetic efficiency at limited [DIC] conditions in high-CO2–grown cells (Fig. 4B) and suppressed photosynthetic affinity in air-grown cells (Fig. 4B), and these phenotypes were stable over a range of assay medium pHs (Table 1 and Table S2). These results clearly demonstrate that the thylakoidal θ-CA participates in the supply of CO2 to photosynthesis. Even though these phenotypic characteristics are more evident under limited DIC, the constitutive expression of Pt43233 (Fig. 2K) and the slower growth rate displayed in Pt43233-i1 mutant relative to WT cells under both high-CO2 and air conditions (Fig. 4A) suggest a fundamental role of this luminal θ-CA in addition to the CCM, whereby it could stabilize the pH gradient and/or photosystem components by facilitating DIC/proton equilibrium in the thylakoid lumen. This potential dual functionality of the P. tricornutum luminal CA is similar to the dual functionality known for CAH3 in C. reinhardtii. The impairment of CAH3 in C. reinhardtii yields a high-CO2-requiring phenotype, indicative of its pivotal function in the CCM (14, 30), but expression of CAH3 is constitutive and CAH3 might regulate PSII activity by removing a proton from the water-oxidizing complex (16, 17).
The precise mechanisms underlying the dual function of luminal CAs on CCM and PSII activity are not fully understood for algae. However, the physiological data in this study strongly suggest that Pt43233 is crucial for the generation of CO2 flux toward RubisCO, presumably using (and/or regulating) the thylakoidal ΔpH. Thus, pyrenoidal PtCA1 and PtCA2 could have alternate functions apart from providing CO2 to RubisCO from accumulated HCO3− in the pyrenoid (5, 6, 8). In a model of the CCM in C. reinhardtii proposed by Raven (15), thylakoid-based CO2 formation requires HCO3− transport into the lumen. Thus, PtCA1 and PtCA2 could work in recapturing any leaked CO2 to supply HCO3− to a putative transport system in the thylakoid membrane, although this transporter is yet to be discovered. The possibility also remains that the CGHR family in C. reinhardtii, specifically LCIB/C, could have CA activity. Under this scenario, the LCIB/C complex could support the CO2-recapturing model of C. reinhardtii by converting leaking CO2 into HCO3− at the peripheral pyrenoid area in the absence of functional association with stromal β-CA, CAH6.
In this study, the discovery of a thylakoid-luminal θ-CA in P. tricornutum indicates that the pyrenoid (thus, eukaryotic CCM) coevolved with the function of the thylakoid membrane regardless of habitat and taxa. The marine centric diatom, T. pseudonana, also contains a CGHR factor with structural similarity to Pt43233 (Fig. S2A), suggesting that luminal θ-CA is a general feature of marine diatoms. Thylakoid-luminal CAs evolved from diverse origins across distant algal taxa, which strongly suggests that the thylakoid-based control system of DIC flux and DIC/proton balance was a pivotal driving force for the evolution of the photosynthetic mechanism in algae.
Materials and Methods
Cells and Culture Conditions.
The marine diatom P. tricornutum Bohlin (UTEX642) was obtained from the University of Texas Culture Collection of Algae and grown in artificial seawater supplemented with one-half-strength Guillard’s “F” solution (F/2ASW) (31) under continuous illumination (50–75 μmol⋅m−2⋅s−1) at 20 °C with atmospheric air (0.04% CO2) or with elevated CO2 [1% or 5% (vol/vol)].
Measurement of CA Activity.
CA activity was measured as described by Wilbur and Anderson (32), with some modifications. Briefly, a 20-μL aliquot of CA solution was added to 1.48 mL of 20 mM barbital buffer (pH 8.4) in a water-jacketed acrylic chamber maintained at 2 °C. The CO2 hydration reaction was initiated by the addition of 0.5 mL of ice-cold CO2-saturated water, and the time required for the pH to drop from 8.3 to 8.0 was determined. Alternatively, 50 mM Mes⋅NaOH (pH 5.5) buffer with the addition of 0.5 mL of ice-cold 50 mM NaHCO3, and the following pH increase from 5.7 to 6.0, was monitored for the HCO3− dehydration assay. The activity of CA was calculated as the WAU according to Eq. 1:
| [1] |
where T0 and T are the times required for the pH shift in the absence and the presence of CA, respectively.
Determination of Photosynthetic Parameters.
Cultured cells were harvested by centrifugation at mid-logarithmic phase and washed with DIC-free F/2ASW (pH 7.5, 8.2, or 9.0). Cells were suspended in the DIC-free F/2ASW at a Chl a concentration of 10 μg⋅mL−1. The kinetics plot of the rate of photosynthetic O2 evolution versus DIC concentration was based upon the value measured with a Clark-type oxygen electrode (3). The [DIC] at the CO2 compensation point was measured by gas chromatography (3). K0.5[DIC] and Pmax values were determined by curve fitting with the nonlinear least squares method. The APC value was calculated from the initial slope of the kinetics plot.
Additional details on materials and methods are provided in SI Materials and Methods, and a list of primers is provided in Table S3.
Table S3.
List of the primers used in this study
| PCR target | Primer name | 5′-sequence-3′ |
| 5′ RACE of CGHR family genes | ||
| Pt43234 | First: LCIB1-5′-Rv2 | ACGCGTCACTTCGTCACTACACAAGGAA |
| Second: LCIB1-5′-Rv3 | AAGGAAGTGGCCAAGAGCGTGTTGTACTTG | |
| Pt43233 | First: LCIB2-5′-Rv2 | TTCCAACTTGGCTACCGCTTCGCTCC |
| Second: LCIB2-5′-Rv3 | GCTCCGATCCACACCGTCAATCGTC | |
| Pt43232 | First: LCIB3-5′-Rv4 | GAGCGGCGAACGATCTCCACAAGAACTT |
| Second: LCIB3-5′-Rv5 | CTCCACAAGAACTTCAACAGGTTAATGGTTACACTGATCC | |
| Pt32401 | First: LCIB4-5′-Rv2 | ACAAGCTTGATCACGACGTTAACGGCGA |
| Second: LCIB4-5′-Rv3 | GCGATGATAGCGAGGAAGGCAACAGCA | |
| Amplification of putative ORF of CGHR family genes | ||
| Pt43234 | PtLCIB1-ORF-FW | ATGAATGTAACTCTAACTGCCGTGAAGAAGG |
| LCIB1-Rv noTGA | TTCCCTACCTGCCGTGAGCG | |
| Pt43233 | PtLciB2-fw | ATGAGGATTTGCATGCGCAGT |
| PtLciB2-rv(-TAA) | GAACAACGCTCGCTTTTCGTACA | |
| Pt43232 | LCIB3-Fw-2 | ATGGAAGAGGCTATGGAAACAGGCGACATT |
| LCIB3-Rv noTAG | GGTACCAGTCTCTACCAGGAAATCTT | |
| Pt32401 | LCIB4-Fw | ATGTTCAAGAAAAAGCAACCCGTTATCGCTG |
| LCIB4-Rv noTAA | GGCCATGAAATCATCAAAAACAACTCCG | |
| 3′ RACE of CGHR family genes | ||
| Pt43234 | PtLciB1Fw | CGTGATGGTGACGTTACCGGTATCC |
| Pt43233 | PtLciB2Fw | ACCTACGAACCCCTCGACGATCTTATG |
| Pt43232 | PtLciB3Fw | ACAGGACGAGCTAATGCAGAAGATTGTTG |
| Pt32401 | PtLciB4Fw | ATTGCTCTCTTGGGAGGAATTCAAATCAA |
| Analysis of transcriptional levels | ||
| Pt43234 | PtLciB1Fw | ATGAATGTAACTCTAACTGCCGTGAAGAAGG |
| PtLciB1Rv | CATTGACTGTGAGTGAGCCTCCGTTC | |
| Pt43233 | PtLciB2Fw | ACCTACGAACCCCTCGACGATCTTATG |
| PtLciB2Rv | AACTACGGACTATGGACCAAGGGCG | |
| Pt43232 | PtLciB3Fw | ACAGGACGAGCTAATGCAGAAGATTGTTG |
| PtLciB3Rv | ATAGCGATTGGCCTGCGTCATAGC | |
| Pt32401 | PtLciB4Fw | ATTGCTCTCTTGGGAGGAATTCAAATCAA |
| PtLciB4Rv | GCCCCATATGATAGTTAGTTGAGGTCATGC | |
| Construction of GFP-fusion vectors | ||
| Pt43234 | PtLCIB1-ORF-FW | ATGAATGTAACTCTAACTGCCGTGAAGAAGG |
| LCIB1-Rv noTGA | TTCCCTACCTGCCGTGAGCG | |
| Pt43233 | PtLciB2-fw | ATGAGGATTTGCATGCGCAGT |
| PtLciB2-rv(-TAA) | GAACAACGCTCGCTTTTCGTACA | |
| Pt43232 | LCIB3-Fw-2 | ATGGAAGAGGCTATGGAAACAGGCGACATT |
| LCIB3-Rv noTAG | GGTACCAGTCTCTACCAGGAAATCTT | |
| Pt32401 | LCIB4-Fw | ATGTTCAAGAAAAAGCAACCCGTTATCGCTG |
| LCIB4-Rv nota | GGCCATGAAATCATCAAAAACAACTCCG | |
SI Materials and Methods
Cloning of the CGHR Family Genes.
Total RNA was extracted from air-grown P. tricornutum cells with the RNeasy Plant Mini Kit (QIAGEN), and subsequently used for 3′ rapid amplification of cDNA ends (RACE). The 3′RACE was performed by synthesizing cDNA with the reverse transcriptase, ReverTra Ace (TOYOBO) in a reaction containing a 5′-GAGCTAGCAGCAGCAGCACTCGAG(T)10-3′ primer. For 5′RACE, total RNA was extracted from air-grown P. tricornutum cells using an RNeasy Midi Kit (QIAGEN). The mRNA was further purified from total RNA using Oligotex-dT30 Super mRNA Purification Kit (TaKaRa). cDNA for 5′RACE was synthesized by SMARTScribe Reverse Transcriptase (Clontech) with the following primers, 5′-(T)25VN-3′ and 5′-AAGCAGTGGTATCAACGCAGAGTACGCGGG-3′, according to the supplier’s recommended protocol. All PCR amplifications were performed with PrimeSTAR HS DNA polymerase (TaKaRa). Primers used in 3′RACE and 5′RACE are listed in Table S3.
Phylogenetic Analysis of CGHR Family Proteins.
For phylogenetic analysis of the CGHR family proteins, full-length protein sequences containing the CGHR domain from different origins were compared using the Clustal Omega program with the slow setting. Maximum likelihood analysis was done with PhyML (33); phylogenetic calculation initiated with a neighbor-joining tree (BIONJ) was computed by the PhyML program. The fast algorithm performing nearest neighbor interchanges was used to improve a reasonable starting tree topology. The amino acid replacement matrix LG was selected with four substitution rate categories. Bootstrap analyses with 100 replicates were performed. The resulting tree was imported into FigTree version 1.4.0.
Prediction of the Localization of the CGHR Family Proteins in P. tricornutum.
Cloned sequences were analyzed for the presence of N-terminal signal peptides with the SignalP 4.1 Server (www.cbs.dtu.dk/services/SignalP/), and hidden Markov models were used to predict cleavage sites. For prediction of plastid and periplastidal compartment or chloroplastic endoplasmic reticulum targeting, the presence of an “ASA-FAP” motif and variants thereof around the predicted ER signal cleavage site were analyzed according to Gruber et al. (18). To predict whether proteins were targeted to the thylakoid, the sequence was analyzed for the presence of the thylakoid targeting motif downstream of the plastid targeting domain (19). The TargetP 1.1 Server (www.cbs.dtu.dk/services/TargetP/) was used to predict mitochondrial localization. For prediction of the transmembrane domain, the TMHMM Server 2.0 (www.cbs.dtu.dk/services/TMHMM/) was used.
Construction of GFP-Fusion Vectors.
Inverse PCR was performed with a ptca2::egfp fusion vector (34) and a primer pair: egfp forward (Fw): 5′-ATGGTGAGCAAGGGCGAGGAGCTGTTC-3′ and FcpAp reverse (Rv): 5′-TCGAAACGGCAGACAAATTTGTG-3′. CGHR factor genes were amplified from single-strand cDNA with primer pairs as shown in Table S3, phosphorylated, and ligated at the upstream region of egfp in the inverse PCR product described above. Thylakoid-targeting signal of Pt43233 was deleted by an inverse PCR technique with a vector of Pt43233 fused with the egfp gene as a temple and primer pairs: pt43233 202–225 Fw: 5′-TACGAAGACAAGGTCAAGGCCATC-3′ and pt43233 138–118 Rv: 5′-ATCCACACCGTCAATCGTCGA-3′ for Pt43233Δ47–67 or pt43233 162–142 Rv: 5′-CAACTTGGCTACCGCTTCGCT-3′ for Pt43233Δ55–67. All PCR amplifications were done with PrimeSTAR HS DNA polymerase.
Transformation of Diatoms and Screening of Transformants.
Each vector was introduced into WT P. tricornutum cells by microprojectile bombardment using the Bio-Rad Biolistic PDS-1000/He Particle Delivery System (Bio-Rad). Cells were grown in atmospheric air under continuous illumination and harvested at the mid-logarithmic phase (OD730 = 0.3–0.4). Approximately 5 × 10⁷ cells were placed as a plaque with a 2.5-cm diameter on the surface of the F/2AWS agar plate. A 500-μg amount of tungsten microcarriers (0.79-μm particle size; Nihonshinkinzoku Co.) were coated with 1 μg of plasmid DNA containing 1 M CaCl2 and 16 mM spermidine. Bombardment was performed at a pressure of 10.7 MPa under a negative pressure of 92 kPa with a target distance of 6 cm. Bombarded cells were cultured for 1 d in the dark and suspended in 5 mL of F/2ASW. Thereafter, cells were collected by centrifugation at 1,700 × g at 20 °C for 5 min, resuspended in 0.3 mL of F/2ASW, and plated onto an F/2ASW agar plate containing 100 μg⋅mL−1 Zeocin. Zeocin-resistant P. tricornutum cells were allowed to form colonies. These antibiotic-resistant clones were further subjected to a second screening based upon detection of a GFP signal or an insertion of the RNAi construct, followed by quantification of transcript levels.
Quantifications of the CGHR Gene Transcripts.
Total RNA was isolated from P. tricornutum cells grown under 1% CO2, atmospheric air, or very low O2 (<0.002%) conditions using NucleoSpin RNA (TaKaRa). The first-strand cDNAs were synthesized in a reaction containing ReverTra Ace (TOYOBO) reverse transcriptase. The primers used for quantitative RT-PCR (qRT-PCR) analysis are provided in Table S3. The qRT-PCR assay was standardized with a known amount of template using plasmids containing the Pt43234, Pt43233, Pt43232, and Pt32401 cDNAs. The entire process of qRT-PCR was performed on a Thermal Cycler Dice Real-Time System II (TaKaRa) using GeneAce SYBR qPCR Mixα No ROX (Nippon Gene) under the following PCR conditions; heating at 95 °C for 10 min, followed by 45 cycles of denaturing at 95 °C for 30 s, annealing, and elongation at 60 °C for 1 min. Transcript levels corresponding to each P. tricornutum CGHR gene were compared with transcript levels of the cytosolic glyceraldehyde-3-phosphate dehydrogenase gene (gapC2; GenBank accession no. AF063805), which was used as the constitutive marker gene. In some experiments, quantification was carried out semiquantitatively by agarose gel electrophoresis. For the semi-quantitative RT-PCR process, the dilution ratio of the template first-strand cDNA was standardized to give the same band intensity as the gapC2 fragment by 21 cycles of PCR amplification. Quantification of Pt43233 was carried out with 23 cycles of PCR amplification using the standardized dilution ratio of the template.
Fluorescent Microscopy.
Subcellular localization analysis of chlorophyll autofluorescence and GFP-fusion proteins of CGHR family proteins was carried out with structured illumination microscopy (SIM) using a superresolution microscope, N-SIM (Nikon). The N-SIM microscope was equipped with Apochromat (Apo) total internal reflection fluorescence (TIRF) 100× Oil differential interference contrast N2 (Nikon). Chlorophyll autofluorescence was excited at 561 nm and detected by an electron-multiplying CCD (EM-CCD) with a bandpass (BP) filter (575–640 BP). GFP fluorescence was performed at an excitation wavelength of 488 nm and detected with a BP filter (500–545 BP). Obtained images were reconstructed with NIS-Elements Ar (Nikon). All of the microscope settings, the exposure time, and the multiplier were set identically to the conditions for the real images.
Fluorescence microscopy of chlorophyll autofluorescence and GFP was also carried out in some experiments with a laser-scanning confocal microscope, A1Rsi (Nikon) equipped with Apo 60× Oil λS (Nikon). Chlorophyll autofluorescence was detected at a 662- to 737-nm emission following excitation with a 638-nm laser; for GFP fluorescence, emission was monitored at 500–550 nm following excitation at 488 nm. All of the microscope, pinhole, and photomultiplier tube settings were identical to those settings used for the real images.
Immunogold Labeling TEM of Expressed Pt43233:GFP Fusions.
WT and transformed P. tricornutum cells were picked up from an agar plate on a formvar-coated gold loop. The samples were rapidly immersed into liquid propane cooled to −180 °C by liquid nitrogen, and then transferred into liquid nitrogen. The loops were dipped in ethanol at −80 °C for 1 wk, followed by incubation at −40 °C for 2 h and then at 4 °C for 2 h. Infiltration of Lowicryl HM20 resin (Electron Microscopy Sciences) into the cells was performed at 25%, 50%, 75%, and 100% (vol/vol) in ethanol at 4 °C for 1 h each. After this procedure, the resin was exchanged freshly and the samples were put overnight at −40 °C. Polymerization of resin was carried out at −40 °C for 3 d and at 4 °C for 4 d under UV light (35). Thin sections were cut and mounted on nickel slot grids. For edging the samples, the thin sections were treated with 1% sodium periodate for 30 min. The sections were incubated with blocking solution [2.5% (wt/vol) skim milk, 5% (vol/vol) normal goat serum, and 0.1% NaN3 in PBS; 137 mM NaCl, 2.7 mM KCl, 4.9 mM Na2HPO4, and 1.5 mM KH2PO4 (pH 7.4)] for 1 h at room temperature, and subsequently reacted with polyclonal anti–GFP-Tag antibody (AnaSpec, Inc.) diluted 1:500 in 3% (wt/vol) BSA in PBS at 20 °C overnight. After rinsing with PBS, they were incubated for 60 min at room temperature with a goat anti-rabbit IgG conjugated to 10-nm colloidal gold particles (1:50 diluted in PBS; BBInternational). After washing with distilled water, the thin sections were stained with TI blue (Nisshin EM) and observed with a JEM-1011 electron microscope (JEOL).
Construction of RNAi Vector for Silencing Pt43233.
Two fragments of the Pt43233 gene were amplified by PCR from cDNA. Briefly, a 669-bp fragment of the Pt43233 gene sequence from position 886–1,554 was obtained with Pt43233-RNAi3-S-E5-fw (5′-GATATCTTCGGTTCCAATTCACTAGTCGC-3′) and Pt43233-RNAi3-S-B1-rv (5′-CGCGGATCCTTAGAACAACGCTCG-3′). A 564-bp antisense fragment, including the region from 886 to 1,449 bp of Pt43233, was generated using Pt43233-RNAi3-A-B1-fw (5′-CGCGGATCCGGTATTAATTTGCAAGC-3′) and Pt43233-RNAi3-A-H3-rv (5′-CCCAAGCTTTTCGGTTCCAATTCACTAGT-3′). The 564-bp antisense fragment was digested with BamHI and HindIII, and then inserted between the BamHI and HindIII sites of pPha-T1 (GenBank accession no. AF219942). The 669-bp sense fragment was digested with EcoRV and BamHI, and then introduced between the EcoRV and BamHI sites of the pPha-T1 vector immediately upstream of the 564-bp fragment. This vector was designated as pFcpApt43233RNAi3. The vector was introduced into WT cells by microprojectile bombardment as described above.
Expression and Purification of Recombinant Pt43233.
The mature region of Pt43233 minus the N-terminal ER signal and the putative transit sequences (Δ67Pt43233) was cloned for this study. Briefly, NdeI-LCIB2-Fw (5′-CATATGTACGAAGACAAGGTCAAGGCC-3′) and HindIII-LCIB2-Rv (5′-AAGCTTAGAACAACGCTCGCTTTTCG-3′) primers and PrimeSTAR HS DNA polymerase were used for PCR amplification of mature Pt43233 with the NdeI and the HindIII sites from cDNA fragments. The PCR product was digested with NdeI and HindIII, and ligated into the NdeI and HindIII sites of the pET28a expression vector (Novagen). The expression vector containing Pt43233 (pET28a-His6:Pt43233) was transformed into E. coli BL21 (DE3) cells and cultured at 37 °C until an OD600 of 0.4 was attained. Thereafter, cells were induced by the addition of 0.1 mM isopropyl-β-d-1-thiogalactopyranoside (Wako) and the following incubation at 30 °C for 10 h in a rotary shaker (Bio-Shaker, BR-43FM; TAITEC) at a rotation speed of 180 rpm. E. coli cells from 1 L of culture were harvested by centrifugation at 4,000 × g for 10 min and resuspended in the immobilized metal-affinity chromatography (IMAC) binding buffer [50 mM Tris⋅HCl (pH 7.5), 500 mM NaCl, and 5 mM imidazole]. Cells were disrupted with a high-pressure homogenizer, EmulsiFlex-C5 (AVESTIN), at 103.4 MPa at 4 °C for 15 min. The cell lysate was centrifuged at 30,000 × g for 20 min at 4 °C, and the supernatant was then applied to an IMAC (Bio-Rad) column (φ10 × 40 mm) pre-equilibrated with binding buffer. The column was washed with binding buffer until the A280 was less than 0.05, followed by the addition of washing buffer [50 mM Tris⋅HCl (pH 7.5), 500 mM NaCl, and 50 mM imidazole] until the A280 was less than 0.02. The His-tag fusion protein was then eluted with elution buffer [50 mM Tris⋅HCl (pH 7.5), 500 mM NaCl, and 500 mM imidazole]. Protein concentration was determined by the Bradford method (BioRad) using BSA as a standard. Purity of the eluted protein was assessed by SDS/PAGE (Fig. S5A).
For purification of Pt43233:GFP fusion protein from P. tricornutum by immuno-precipitation, 120 mL of culture was harvested, resuspended in 150 μL of Lysis buffer [25 mM HEPES-KOH (pH 7.9), 200 mM NaCl, 12.5 mM MgCl2, 0.2% NP-40, 1 mM DTT, 10% (vol/vol) glycerol, 0.5 mM PMSF], and disrupted by sonication (Ultrasonic disruptor model UD-201; Tomy Seiko Co. Ltd.); 5 min of a repeat cycle of 0.3 s disruption and 0.7 s of pause in ice bath. Cell lysate was centrifuged at 10,000 × g for 20 min and the supernatant of 6–10 mg of total lysate protein was mixed with 10 μL of Protein Mag Sepharose (GE Healthcare) loaded with 100 μg of anti-GFP rabbit IgG (Anti-GFP, poly; Bethyl Laboratories, Inc.) or preimmune rabbit serum (Sigma) of an equivalent IgG level in a total 500 μL of PBS. This mixture was gently mixed for 1 h at room temperature and Protein Mag Sepharose resin was washed with 500 μL of PBS three times. Elution of Pt43233:GFP bound with IgG was carried out by 100 μL of 0.1 M glycine-HCl (pH 3.0), and the eluate was immediately neutralized by 2 μL of 1 M Tris-HCl (pH 9.0).
Measurement of Esterase Activity.
The rate of p-nitrophenyl acetate hydrolysis was determined at 20 °C. The reaction mixture contained 5 mM p-nitrophenyl acetate in 990 μL of 25 mM Tris⋅HCl (pH 7.5) with 1 mM ZnCl2, and the reaction was initiated by the addition of 10 μL of enzyme solution. The enzyme reaction was monitored by the increase in A405 over a 5-min period.
Acknowledgments
We thank Dr. Gale G. Bozzo for critical reading of this manuscript, Yukiko Yamazaki and Nobuko Higashiuchi for their technical assistance, and Miyabi Inoue for her skillful secretarial aid. This work was supported by Grant-in-Aid for Scientific Research B 24310015 (to Y.M.); Grant-in-Aid for Scientific Research on Innovative Areas 16H06557 (to Y.M.); Grants-in-Aid for Young Scientists B 15K21531 (to S.K.), 26870750 (to K.N.), and 15K16156 (to Y.T.) from the Japan Society for the Promotion of Science (JSPS); Science Research Promotion Fund Grant g135011 (to S.K.) from the Japan Private School Promotion Foundation; by the MEXT-supported program for the Strategic Research Foundation for the Advancement of Environmental Protection Technology and for Development of Intelligent Self-Organized Biomaterials; and by the PMAC-supported Science Research Promotion Fund (Y.M.).
Footnotes
The authors declare no conflict of interest.
This article is a PNAS Direct Submission.
Data deposition: The sequences reported in this paper have been deposited in the GenBank database (accession nos. LC111565, LC111566, LC111567, and LC111568).
This article contains supporting information online at www.pnas.org/lookup/suppl/doi:10.1073/pnas.1603112113/-/DCSupplemental.
References
- 1.Falkowski P, et al. The global carbon cycle: A test of our knowledge of earth as a system. Science. 2000;290(5490):291–296. doi: 10.1126/science.290.5490.291. [DOI] [PubMed] [Google Scholar]
- 2.Field CB, Behrenfeld MJ, Randerson JT, Falkowski P. Primary production of the biosphere: Integrating terrestrial and oceanic components. Science. 1998;281(5374):237–240. doi: 10.1126/science.281.5374.237. [DOI] [PubMed] [Google Scholar]
- 3.Matsuda Y, Hara T, Colman B. Regulation of the induction of bicarbonate uptake by dissolved CO2 in the marine diatom, Phaeodactylum tricornutum. Plant Cell Environ. 2001;24(6):611–620. [Google Scholar]
- 4.Nakajima K, Tanaka A, Matsuda Y. SLC4 family transporters in a marine diatom directly pump bicarbonate from seawater. Proc Natl Acad Sci USA. 2013;110(5):1767–1772. doi: 10.1073/pnas.1216234110. [DOI] [PMC free article] [PubMed] [Google Scholar]
- 5.Hopkinson BM. A chloroplast pump model for the CO2 concentrating mechanism in the diatom Phaeodactylum tricornutum. Photosynth Res. 2014;121(2-3):223–233. doi: 10.1007/s11120-013-9954-7. [DOI] [PubMed] [Google Scholar]
- 6.Hopkinson BM, Dupont CL, Allen AE, Morel FMM. Efficiency of the CO2-concentrating mechanism of diatoms. Proc Natl Acad Sci USA. 2011;108(10):3830–3837. doi: 10.1073/pnas.1018062108. [DOI] [PMC free article] [PubMed] [Google Scholar]
- 7.Samukawa M, Shen C, Hopkinson BM, Matsuda Y. Localization of putative carbonic anhydrases in the marine diatom, Thalassiosira pseudonana. Photosynth Res. 2014;121(2-3):235–249. doi: 10.1007/s11120-014-9967-x. [DOI] [PubMed] [Google Scholar]
- 8.Tachibana M, et al. Localization of putative carbonic anhydrases in two marine diatoms, Phaeodactylum tricornutum and Thalassiosira pseudonana. Photosynth Res. 2011;109(1-3):205–221. doi: 10.1007/s11120-011-9634-4. [DOI] [PubMed] [Google Scholar]
- 9.Badger MR, Hanson D, Price GD. Evolution and diversity of CO2 concentrating mechanisms in cyanobacteria. Funct Plant Biol. 2002;29(2-3):161–173. doi: 10.1071/PP01213. [DOI] [PubMed] [Google Scholar]
- 10.Kaplan A, Reinhold L. CO2 concentrating mechanisms in photosynthetic microorganisms. Annu Rev Plant Physiol Plant Mol Biol. 1999;50:539–570. doi: 10.1146/annurev.arplant.50.1.539. [DOI] [PubMed] [Google Scholar]
- 11.Ramazanov Z, et al. The induction of the CO2-concentrating mechanism is correlated with the formation of the starch sheath around the pyrenoid of Chlamydomonas reinhardtii. Planta. 1994;195(2):210–216. [Google Scholar]
- 12.Yamano T, et al. Light and low-CO2-dependent LCIB-LCIC complex localization in the chloroplast supports the carbon-concentrating mechanism in Chlamydomonas reinhardtii. Plant Cell Physiol. 2010;51(9):1453–1468. doi: 10.1093/pcp/pcq105. [DOI] [PubMed] [Google Scholar]
- 13.Moroney JV, Ynalvez RA. Proposed carbon dioxide concentrating mechanism in Chlamydomonas reinhardtii. Eukaryot Cell. 2007;6(8):1251–1259. doi: 10.1128/EC.00064-07. [DOI] [PMC free article] [PubMed] [Google Scholar]
- 14.Funke RP, Kovar JL, Weeks DP. Intracellular carbonic anhydrase is essential to photosynthesis in Chlamydomonas reinhardtii at atmospheric levels of CO2. Demonstration via genomic complementation of the high-CO2-requiring mutant ca-1. Plant Physiol. 1997;114(1):237–244. doi: 10.1104/pp.114.1.237. [DOI] [PMC free article] [PubMed] [Google Scholar]
- 15.Raven JA. CO2-concentrating mechanisms: A direct role for thylakoid lumen acidification? Plant Cell Environ. 1997;20(2):147–154. [Google Scholar]
- 16.Shutova T, et al. The photosystem II-associated Cah3 in Chlamydomonas enhances the O2 evolution rate by proton removal. EMBO J. 2008;27(5):782–791. doi: 10.1038/emboj.2008.12. [DOI] [PMC free article] [PubMed] [Google Scholar]
- 17.Benlloch R, et al. Crystal structure and functional characterization of photosystem II-associated carbonic anhydrase CAH3 in Chlamydomonas reinhardtii. Plant Physiol. 2015;167(3):950–962. doi: 10.1104/pp.114.253591. [DOI] [PMC free article] [PubMed] [Google Scholar]
- 18.Gruber A, et al. Protein targeting into complex diatom plastids: Functional characterisation of a specific targeting motif. Plant Mol Biol. 2007;64(5):519–530. doi: 10.1007/s11103-007-9171-x. [DOI] [PubMed] [Google Scholar]
- 19.Ishida K, Green BR. Second- and third-hand chloroplasts in dinoflagellates: Phylogeny of oxygen-evolving enhancer 1 (PsbO) protein reveals replacement of a nuclear-encoded plastid gene by that of a haptophyte tertiary endosymbiont. Proc Natl Acad Sci USA. 2002;99(14):9294–9299. doi: 10.1073/pnas.142091799. [DOI] [PMC free article] [PubMed] [Google Scholar]
- 20.Supuran CT. Carbonic anhydrase inhibitors. Bioorg Med Chem Lett. 2010;20(12):3467–3474. doi: 10.1016/j.bmcl.2010.05.009. [DOI] [PubMed] [Google Scholar]
- 21.Lee RBY, Smith JAC, Rickaby REM. Cloning, expression and characterization of the δ-carbonic anhydrase of Thalassiosira weissflogii (Bacillariophyceae) J Phycol. 2013;49(1):170–177. doi: 10.1111/j.1529-8817.2012.01226.x. [DOI] [PubMed] [Google Scholar]
- 22.Pocker Y, Sarkanen S. Carbonic anhydrase: Structure catalytic versatility, and inhibition. Adv Enzymol Relat Areas Mol Biol. 1978;47:149–274. doi: 10.1002/9780470122921.ch3. [DOI] [PubMed] [Google Scholar]
- 23.Burkhardt S, Amoroso G, Riebesell U, Sültemeyer D. CO2 and HCO3- uptake in marine diatoms acclimated to different CO2 concentrations. Limnol Oceanogr. 2001;46(6):1378–1391. [Google Scholar]
- 24.Xu Y, Feng L, Jeffrey PD, Shi Y, Morel FM. Structure and metal exchange in the cadmium carbonic anhydrase of marine diatoms. Nature. 2008;452(7183):56–61. doi: 10.1038/nature06636. [DOI] [PubMed] [Google Scholar]
- 25.Mitsuhashi S, et al. X-ray structure of β-carbonic anhydrase from the red alga, Porphyridium purpureum, reveals a novel catalytic site for CO(2) hydration. J Biol Chem. 2000;275(8):5521–5526. doi: 10.1074/jbc.275.8.5521. [DOI] [PubMed] [Google Scholar]
- 26.Supuran CT, Capasso C. The η-class carbonic anhydrases as drug targets for antimalarial agents. Expert Opin Ther Targets. 2015;19(4):551–563. doi: 10.1517/14728222.2014.991312. [DOI] [PubMed] [Google Scholar]
- 27.Bayram E, Senturk M, Kufrevioglu OI, Supuran CT. In vitro inhibition of salicylic acid derivatives on human cytosolic carbonic anhydrase isozymes I and II. Bioorg Med Chem. 2008;16(20):9101–9105. doi: 10.1016/j.bmc.2008.09.028. [DOI] [PubMed] [Google Scholar]
- 28.Blanco-Rivero A, Shutova T, Román MJ, Villarejo A, Martinez F. Phosphorylation controls the localization and activation of the lumenal carbonic anhydrase in Chlamydomonas reinhardtii. PLoS One. 2012;7(11):e49063. doi: 10.1371/journal.pone.0049063. [DOI] [PMC free article] [PubMed] [Google Scholar]
- 29.Wang Y, Spalding MH. Acclimation to very low CO2: Contribution of limiting CO2 inducible proteins, LCIB and LCIA, to inorganic carbon uptake in Chlamydomonas reinhardtii. Plant Physiol. 2014;166(4):2040–2050. doi: 10.1104/pp.114.248294. [DOI] [PMC free article] [PubMed] [Google Scholar]
- 30.Karlsson J, et al. A novel α-type carbonic anhydrase associated with the thylakoid membrane in Chlamydomonas reinhardtii is required for growth at ambient CO2. EMBO J. 1998;17(5):1208–1216. doi: 10.1093/emboj/17.5.1208. [DOI] [PMC free article] [PubMed] [Google Scholar]
- 31.Harrison PJ, Waters RE, Taylor FJR. A broad-spectrum artificial seawater medium for coastal and open ocean phytoplankton. J Phycol. 1980;16(1):28–35. [Google Scholar]
- 32.Wilbur KM, Anderson NG. Electrometric and colorimetric determination of carbonic anhydrase. J Biol Chem. 1948;176(1):147–154. [PubMed] [Google Scholar]
- 33.Guindon S, et al. New algorithms and methods to estimate maximum-likelihood phylogenies: Assessing the performance of PhyML 3.0. Syst Biol. 2010;59(3):307–321. doi: 10.1093/sysbio/syq010. [DOI] [PubMed] [Google Scholar]
- 34.Kitao Y, Harada H, Matsuda Y. Localization and targeting mechanisms of two chloroplastic beta-carbonic anhydrases in the marine diatom Phaeodactylum tricornutum. Physiol Plant. 2008;133(1):68–77. doi: 10.1111/j.1399-3054.2008.01053.x. [DOI] [PubMed] [Google Scholar]
- 35.Fu G, Nagasato C, Oka S, Cock JM, Motomura T. Proteomics analysis of heterogeneous flagella in brown algae (stramenopiles) Protist. 2014;165(5):662–675. doi: 10.1016/j.protis.2014.07.007. [DOI] [PubMed] [Google Scholar]


