Significance
This work contributes to the scientific effort focused on developing an accurate assessment of the impact that global warming will have on the Greenland ice sheet. By focusing on the last interglacial, a period warmer than today, we learn about the sensitivity of the ice sheet to climate change. We combine data and model simulations to characterize the Eemian history of the Greenland ice sheet. Our data and insights will be useful for simulating the future of the ice sheet in response to climate change.
Keywords: Greenland ice sheet, last interglacial, ice cores, sea level rise
Abstract
The Eemian (last interglacial, 130–115 ka) was likely the warmest of all interglacials of the last 800 ka, with summer Arctic temperatures 3–5 °C above present. Here, we present improved Eemian climate records from central Greenland, reconstructed from the base of the Greenland Ice Sheet Project 2 (GISP2) ice core. Our record comes from clean, stratigraphically disturbed, and isotopically warm ice from 2,750 to 3,040 m depth. The age of this ice is constrained by measuring CH4 and δ18O of O2, and comparing with the historical record of these properties from the North Greenland Ice Core Project (NGRIP) and North Greenland Eemian Ice Drilling (NEEM) ice cores. The δ18Oice, δ15N of N2, and total air content for samples dating discontinuously from 128 to 115 ka indicate a warming of ∼6 °C between 127–121 ka, and a similar elevation history between GISP2 and NEEM. The reconstructed climate and elevation histories are compared with an ensemble of coupled climate-ice-sheet model simulations of the Greenland ice sheet. Those most consistent with the reconstructed temperatures indicate that the Greenland ice sheet contributed 5.1 m (4.1–6.2 m, 95% credible interval) to global eustatic sea level toward the end of the Eemian. Greenland likely did not contribute to anomalously high sea levels at ∼127 ka, or to a rapid jump in sea level at ∼120 ka. However, several unexplained discrepancies remain between the inferred and simulated histories of temperature and accumulation rate at GISP2 and NEEM, as well as between the climatic reconstructions themselves.
During the last interglacial (Eemian, 130–115 ka), Arctic summer temperatures were 3–5 °C warmer than today (1), and peak global eustatic sea level was likely 6–9 m higher than the present (2). In the next century, due to anthropogenic emissions of greenhouse gases, we face a similar temperature scenario with 2–6 °C of northern hemispheric polar warming (3), and a likely initial sea level rise (by 2100) of 0.3–1.0 m (4), with higher, but uncertain, levels beyond. Certainly there are important differences between the warming and sea level change observed during the last climatic warm period and future projections, notably the rate at which warming is expected to occur and its spatial pattern. Nevertheless, the Eemian history of the Greenland ice sheet (GrIS) serves as an essential test bed for understanding changes in ice sheets and sea level rise in response to rising global temperatures.
Ice sheet modeling studies have estimated a wide range of GrIS contributions to sea level during the Eemian, with simulations producing 0.4–5.5 m of equivalent sea level rise above the present datum (5). Although ice dating to the Eemian or beyond has been observed in six ice cores drilled to the base of the Greenland ice sheet [North Greenland Ice Core Project (NGRIP), GRIP, Greenland Ice Sheet Project 2 (GISP2), Camp Century, Dye 3, and North Greenland Eemian Ice Drilling (NEEM)] (Fig. 1), only the most recently drilled core at NEEM has provided a continuous climate history through the Eemian, with ice as old as 128 ka (6). The NEEM climate record includes data on gas stratigraphy (which defines the timescale), isotopic temperature, gas-trapping depth (from δ15N of N2), and total air content (7).
Fig. 1.
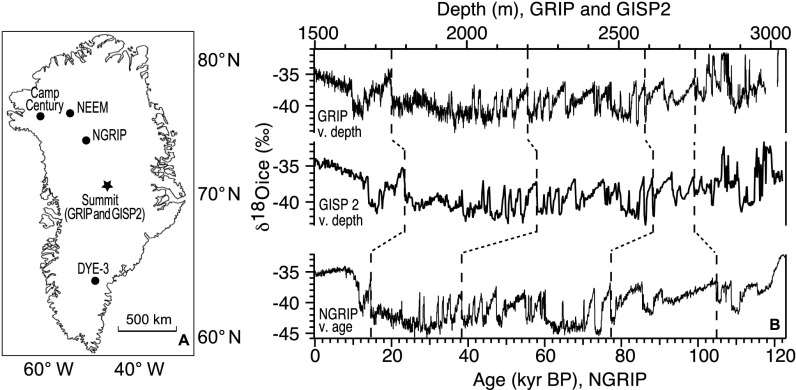
(A) Relevant Greenland ice core drilling sites. (B) Comparison of δ18Oice for GRIP, GISP2, and NGRIP ice cores (10, 11). GRIP and GISP2 are plotted on the top axis vs. depth and are continuous to ∼2,750 m. NGRIP is plotted on the bottom axis vs. age and is continuous to ∼121 ka. Dotted lines show δ18Oice correlations between cores.
Here, we revisit the climate archive of the deep section of the GISP2 ice core, which contains stratigraphically disturbed layers of ice dating to the last interglacial and beyond (8, 9). The GISP2 ice core was drilled to bedrock in 1993, producing a 3,053.44-m ice core at Summit, Greenland. Its stratigraphy is continuous to only ∼105 ka, or to a depth of ∼2,750 m (Fig. 1). Below, there are ∼290 m with alternating intervals of isotopically warm (heavy δ18Oice) and cold (light δ18Oice) ice (10). The warmest of these sections have δ18Oice values warmer than that of the current interglacial, and gas properties consistent with an Eemian age, indicating that Eemian ice is present near the bed of GISP2 (Fig. 1; refs. 9, 11).
We targeted the warmest disturbed ice, sampling all 48 one-meter sections of the GISP2 ice core between 2,760 and 3,040 m depth with δ18Oice values heavier than −37‰ (Fig. S1). Measurements of the δ18O of paleoatmospheric O2 (δ18Oatm) and the concentration of CH4 constrain the ages of discrete samples. We then use these dates to improve our understanding of the sequence of events at Summit, Greenland, during the last interglacial. The product is a discontinuous record of isotopic temperatures and ice accumulation rates, as well as the elevation of GISP2 with respect to NEEM, over the Eemian at Summit, Greenland. Finally, we compare model simulations to the reconstructed GISP2 and NEEM records to estimate the regional climatic change and sea level contribution from the GrIS during the Eemian.
Fig. S1.
Sampled sections from the clean, disturbed section of GISP2 (48 samples), shown in the context of the curve of δ18Oice vs. depth.
Age Reconstruction
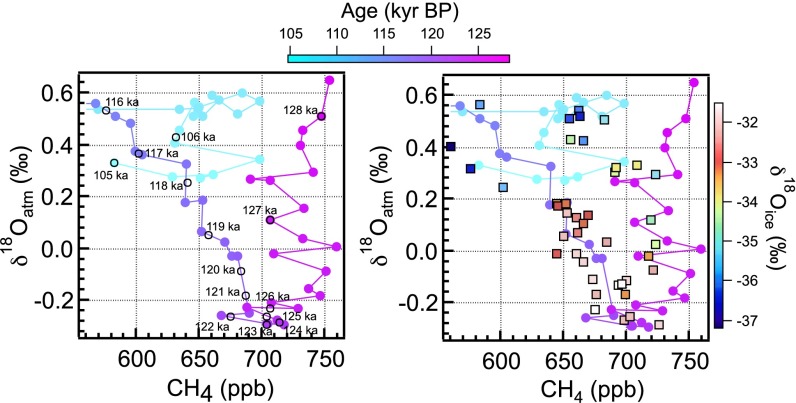
To establish a chronology for the sampled sections, we follow earlier work in measuring the δ18O of paleoatmospheric oxygen (δ18Oatm), and the concentration of CH4, in the trapped air bubbles in the ice (8, 9). Throughout the global atmosphere, δ18Oatm and CH4 each vary with time, more or less uniformly. We date disturbed ice by determining when, according to existing Greenland and Antarctic ice core records, the atmosphere had the same CH4 concentration and δ18Oatm we observe in a particular sample (Fig. 2 and Fig. S2). The following ice core records provide the reference δ18Oatm and CH4 stratigraphy: NGRIP from 121.1 to 105 ka (12); NEEM from 128.2 to 119.9 ka [ref. 6; EPICA Dronning Maud Land (EDML1) gas age timescale]; and European Project for ice coring in Antarctica (EPICA) Dome C, dated continuously to ∼800 ka (refs. 13, 14; Antarctic Ice Core Chronology 2012 gas age timescale). In the NEEM dataset, samples with elevated CH4 and N2O concentrations are associated with melt layers, and are removed from the reference curve (ref. 6; Fig. S3). Our analysis dates ice at 28 depths in the GISP2 core between 116 and 128 ka. Details are given in the Supporting Information.
Fig. 2.
Reference curves of CH4 vs. δ18Oatm color-coded for age. (A) Reference curve based on NGRIP (121.1–105 ka; 12) and NEEM (128.2–119.9 ka; 6) CH4 and δ18Oatm data. (B) Analyzed sample sections plotted as squares, color-coded for δ18Oice on the reference curve from A.
Fig. S2.
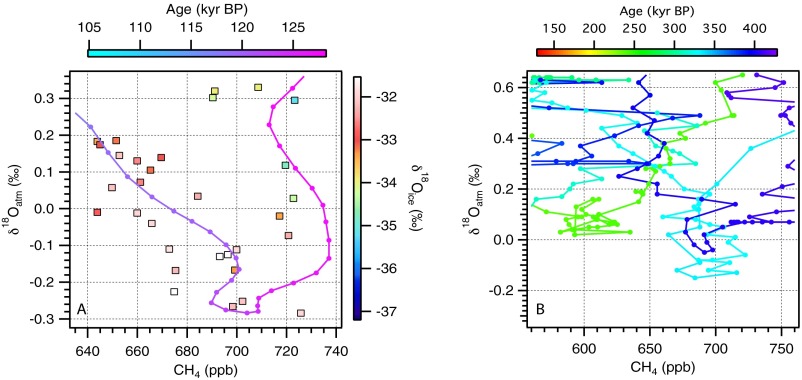
Reference curves of CH4 vs. δ18Oatm color-coded for age. (A) Zoom in on Eemian section of scatterplot with a three-point smoothing over the curve, which is used to interpolate sample ages. (B) Reference curve based on EPICA Dome C CH4 and δ18Oatm data (130-427 ka; refs. 13, 14).
Fig. S3.
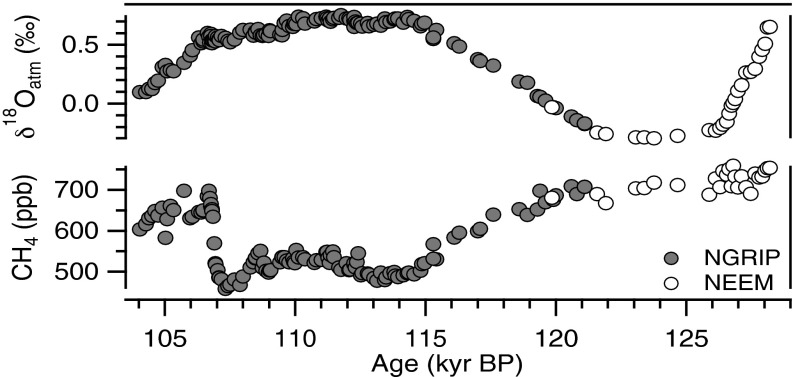
Reference curves for CH4 and δ18Oatm based on NGRIP (121.1–105 ka; 12) and NEEM (128.2–119.9 ka; 6). Elevated CH4 data, associated with melt layers in the NEEM core, are excluded.
Coupled Climate–Ice-Sheet Model
The coupled climate–ice-sheet model approach, Regional Energy-Moisture Balance - Simulation Code for Polythermal Ice Sheets (REMBO-SICOPOLIS), was used to simulate the evolution of the GrIS through the Eemian. Regional climatic conditions over Greenland and the surface mass balance are calculated by the intermediate complexity regional climate model REMBO (15). REMBO includes a computationally efficient 2D atmospheric component and a simplified energy-balance model for calculating the surface mass balance of the ice sheet. The evolution of the ice sheet is calculated via the 3D thermomechanical, shallow-ice approximation ice sheet model SICOPOLIS (16). SICOPOLIS is driven by the ice surface temperature and surface mass balance fields calculated in REMBO, and in turn it provides ice sheet thickness and elevation as topographic input back to REMBO. The coupled model is run at 20-km resolution, and it has been shown to simulate the volume and distribution of the present-day ice well (16). Importantly for this study, the model accounts for the albedo–temperature and elevation–melt feedbacks that are active in times of transient ice sheet evolution, such as during the Eemian. REMBO is driven at the boundaries by monthly temperature anomalies around Greenland, computed using the CLIMBER-2 earth system model of intermediate complexity in a global glacial cycle simulation from 860 ka to the present driven by greenhouse gas forcing and Milankovitch variability (17).
An ensemble of simulations was performed through the Eemian accounting for parametric uncertainty associated with the melt model and the sensitivity of precipitation to temperature changes (18), which are dominant factors affecting the transient evolution of the ice sheet. In addition, the positive monthly temperature anomalies during the Eemian were scaled by a random factor to test a wide range of interglacial temperatures. The ensemble was generated using Latin hypercube sampling, where the parameter values were perturbed within a range consistent with present-day constraints (18), and the interglacial temperature anomalies were perturbed to give a peak summer warming range of between approximately 1 and 6 °C. Prior estimates of parameter weights were assigned to each model version and a posterior likelihood of each simulation was obtained by statistical comparison between the modeled and reconstructed precipitation-weighted temperature anomalies at GISP2 and the NEEM deposition site (see Supporting Information for details).
Results and Discussion
Climate at Summit, Greenland, over the Last Interglacial.
Fig. 3 shows climate properties for samples from the clean, disturbed section of the GISP2 core plotted vs. reconstructed age. Also plotted are similar GISP2 data of Suwa et al. (8), along with the reconstructed records from NEEM (6). We note that temperature reconstructions are based on precipitation-weighted δ18Oice, which is likely biased toward warmer summer months rather than the annual mean temperature (19).
Fig. 3.
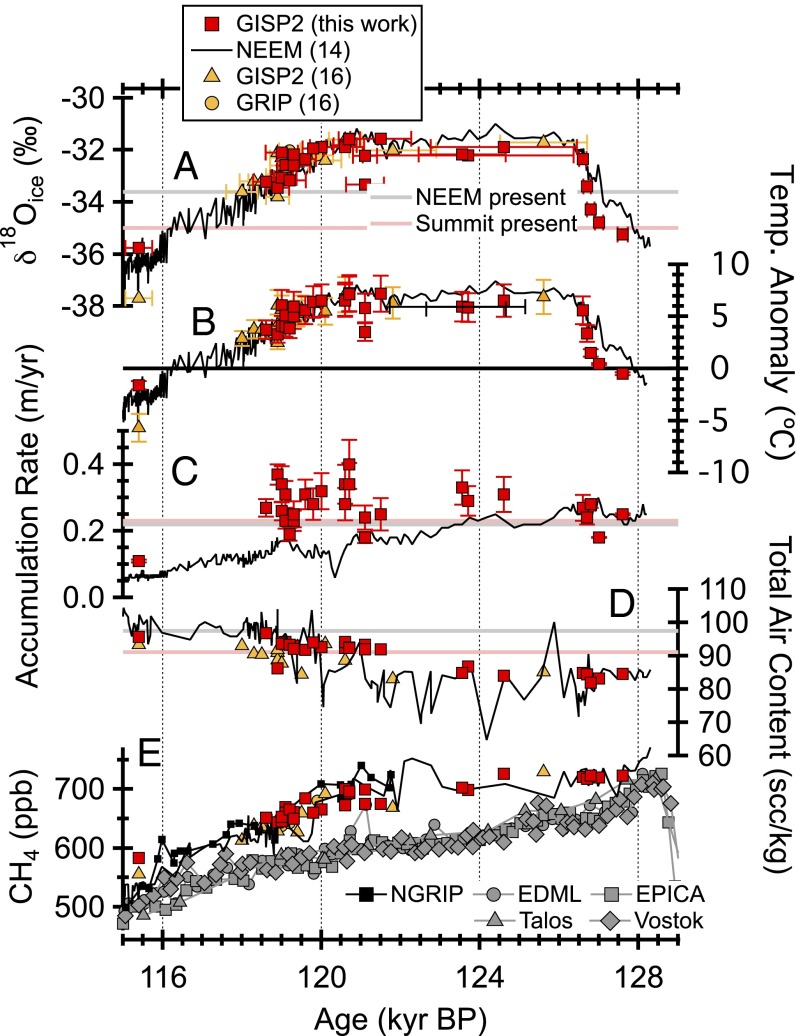
Summary of data from GISP2 (present study) in red, GRIP and GISP2 in orange (8), and NEEM in black (6) through the last interglacial. (A) Reconstructed δ18Oice. (B) Calculated temperature anomaly relative to the mean of the last millennium for a dT/dδ18O relationship of 2.1 ± 0.5 °C ‰−1 (6). (C) Estimated accumulation rate. (D) Reconstructed total air content. (E) A comparison of CH4 data from GISP2 (present study), GRIP and GISP2 (8), NEEM (6), NGRIP (12), EDML (28), EPICA Dome C (13), Talos (29), and Vostok (30).
Temperature.
We observe a rapid deglacial warming at Summit, similar to that seen in the NEEM core. From 127.6 to 126.6 ka, GISP2 δ18Oice increases by 2.9‰ from −35.2‰ to −32.3‰ (Fig. 3A). To estimate temperatures, we adopt the temperature–δ18O relationship of Vinther et al. (20), with the larger uncertainty of NEEM (6), i.e., dT/δ18Oice = 2.1 ± 0.5 °C ‰−1. This value is similar to the present-day spatial relationship of δ18Oice vs. temperature, 1.5 °C ‰−1 (21). The dT/dδ18O relationship may differ between the Eemian and the Holocene due to changes in seasonality and sources of precipitation (19), as well as topographic feedbacks with a reduced ice sheet size (22), which is reflected in the uncertainty range used here. Using this conversion factor, the δ18Oice change corresponds to a precipitation-weighted warming of 6 ± 1.5 °C at Summit over an ∼1,000-y period. After a plateau of several kiloyears, δ18Oice gradually decreases by ∼1.5‰ from 121.8 to 118 ka, corresponding to a cooling of 3 ± 1 °C, again, much like that seen at NEEM.
During the middle of the Eemian, δ18Oice at GISP2 is slightly lower than at NEEM, suggesting that the Summit anomaly was perhaps 1 °C lower. At NEEM, highly variable total air content data, along with sharp spikes in CH4 and N2O concentrations, indicate frequent surface melt layers between 128 and 118 ka (6). Such features are not observed at GISP2. Unfortunately, our ability to describe this interval at GISP2 is limited by the paucity of GISP2 and GRIP samples dating between 126 and122 ka (this work; ref. 8), which notably corresponds to the period of warmest Eemian temperatures and significant Greenland ice sheet loss (6).
The reconstructed temperature anomaly relative to the mean of the last thousand years is calculated and plotted in Fig. 3B. For reference, present-day values of δ18Oice and temperature are −35‰ and −31 °C for GISP2 and −35‰ and −29 °C for the estimated upstream Eemian NEEM deposition site (6), respectively. Between 126 and 122 ka, Summit temperatures are estimated to have been 4–8 °C higher than the recent average. This warming reflects the combination of higher regional temperatures and lower ice sheet elevation.
Accumulation rate.
We calculate the accumulation rate as described in the Supporting Information. In brief, we calculate temperature from δ18Oice as described above. Next, we calculate gas-trapping depth from δ15N of N2 (23). The equations of Herron and Langway (24) are then solved to calculate the accumulation rate, in units of water-equivalent meters/year, accounting for close off at the observed temperature and gas-trapping depth. Estimated accumulation rates are shown in Fig. 3C. Accumulation rates decline steadily through the Eemian at NEEM, although they are more variable and do not show a trend at GISP2. Accumulation rates are similar between the two sites at the onset and end of the interglacial period, but reach lower values at NEEM by ∼120 ka.
Total air content and elevation.
The change in total air content (TAC) at GISP2 is easily quantified. However, at NEEM, the situation is complicated by melting, which leads to anomalously low total air content in many of the samples. The reliable TAC values at NEEM are the highest values except for one anomalously high point at 126 ka. These values are very similar to values at GISP2 throughout the record (Fig. 3D).
In principle, TAC serves as a proxy for elevation. The premise is that, in ice reaching the close-off depth, open porosity is a function of temperature (7, 25). TAC is then the open porosity at the close-off depth multiplied by the temperature-dependent density of air. Reversing the approach, one can calculate atmospheric pressure during gas trapping from temperature (δ18Oice), the empirical relationship between close-off volume and temperature, and the ideal gas law. In addition, Raynaud et al. (7) and others (26, 27) identified a link between total air content and local summertime insolation. Accounting for this link, NEEM et al. (6) quantified the effect of insolation and estimated that, during the Eemian, elevation at NEEM was within a few hundred meters of the present elevation.
The similarity in TAC at NEEM and GISP2 is at least partly due to the fact that the insolation change is nearly identical at these sites. However, the similarity in the records also requires that the magnitude of elevation change between 127 and 121 ka be similar at the two sites. We have less confidence in absolute elevations computed from the TAC data (Supporting Information), because of the large uncertainty associated with the insolation effect as well as the potential for unquantified regional atmospheric pressure changes. Therefore, they are not considered in our analysis.
In summary, GISP2 data place three important constraints on the history of the Greenland ice sheet. First, Summit warmed to the present temperature at ∼127 ka, and was ∼5 °C warmer than present between 126 and 120 ka. Second, Eemian accumulation rates at Summit were ∼40% higher than during the Holocene. Third, the elevation and temperature difference between Summit and the deposition site of NEEM was approximately constant during the Eemian.
Data–Model Comparison.
We compare output from an ensemble of coupled climate–ice sheet model simulations to the reconstructed temperature, accumulation rate, and elevation change data for Summit and the NEEM upstream deposition location during the Eemian.
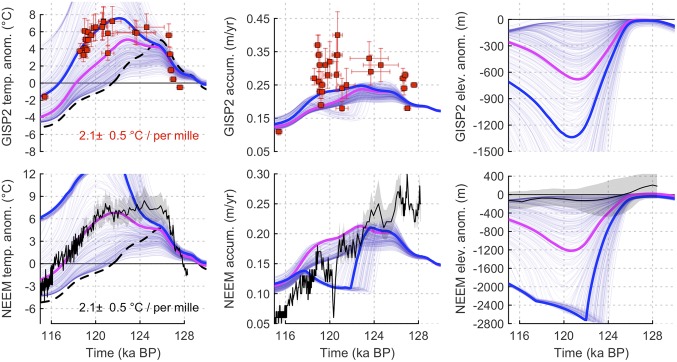
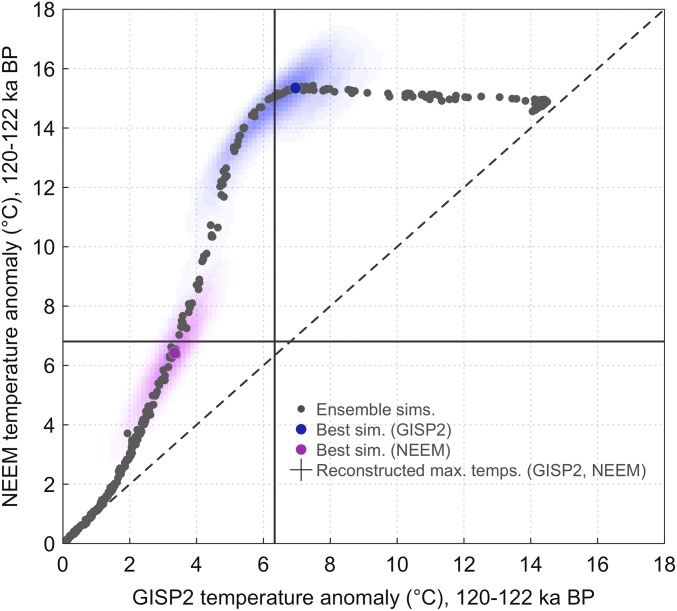
Several simulations capture either the GISP2 or the NEEM temperature record fairly well, but it is not possible to simulate both well simultaneously (Fig. 4). The basic problem is that the NEEM–GISP2 elevation difference should not change appreciably according to TAC data and the isotopic temperature difference between sites. In our simulations, however, NEEM always declines in elevation more than GISP2, and its isotopic temperature increases more. Given our inability to simultaneously simulate climate records at both sites, we derive histories of temperature and elevation by independently optimizing properties of the model to fit the NEEM and GISP2 temperature histories.
Fig. 4.
Simulation output (light-blue lines) of the local precipitation-weighted temperature anomaly (Left), the accumulation rate (Center), and the elevation (Right) compared with reconstructions at GISP2 (Upper, in red) and NEEM (Lower, in black; gray shading represents SE). The most likely simulations compared with the GISP2 (thick blue lines) and NEEM (thick magenta lines) temperature reconstructions are shown, along with the respective regional summer temperature anomaly forcing in Left (dashed black lines).
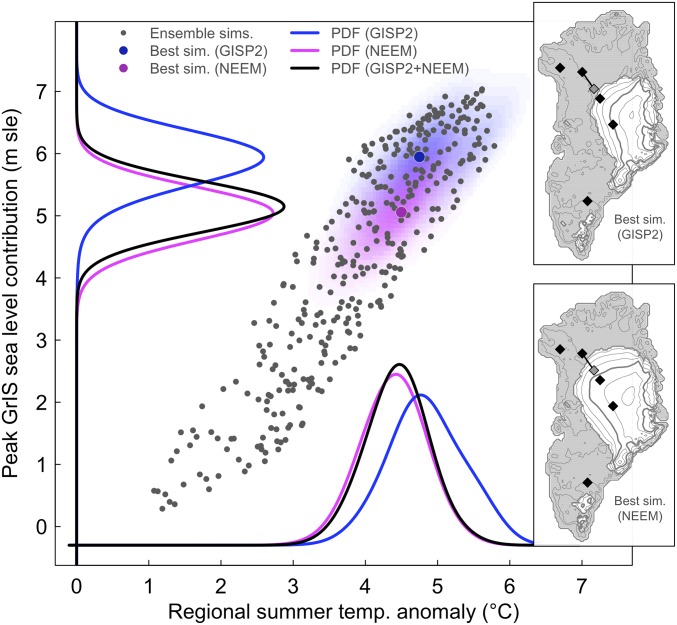
The optimal simulation accounting only for the GISP2 temperature reconstruction (Fig. 4, blue lines) produces a peak sea level contribution from the GrIS of 6 m (Fig. 5). The trajectory of warming during the Eemian is well captured by the simulation, aside from an underestimation of warming early on of ∼2 °C. It is interesting to note that the model fits the data best toward the end of the interglacial when the combination of transient elevation changes and regional climatic forcing leave the model with the most degrees of freedom (Fig. 6). In this case, the ice sheet is reduced to a small central dome with a reduction in the GISP2 elevation by around 1,300 m (Fig. 6, Top). This solution seems to fail because it predicts the absence of an Eemian ice sheet at the NEEM deposition site inferred by ref. 6.
Fig. 5.
Simulated maximum GrIS contribution to sea level (m sle) vs. the peak regional summer temperature anomaly (°C) during the Eemian (black points). Background shading shows the 2D marginal probabilities for GISP2 (blue) and NEEM (magenta) estimated using a weighted kernel density estimate. Probabilities projected onto each variable are shown along with the combined (GISP2 + NEEM) estimate. Insets show the minimum ice sheet distribution for the best simulation for GISP2 (Upper) and NEEM (Lower). The black diamonds on the ice sheet indicate drilling sites, and correspond to sites in Fig. 1. The gray diamond connected to the NEEM point is the estimated upstream deposition site for Eemian age ice.
Fig. 6.
Simulated average precipitation-weighted temperature anomalies (°C) at NEEM vs. those of GISP2 during the Eemian for the period 120–122 ka BP (black points). Background shading and the colored points shows the 2D marginal probabilities estimated using a weighted kernel density estimate and the optimal simulations, respectively, for GISP2 (blue) and NEEM (magenta), and the cross indicates the corresponding reconstructed temperature anomalies from the ice cores for this time period. For comparison, the 1:1 relationship of temperature anomalies at NEEM vs. GISP2 is shown by the dashed line.
The optimum solution using the NEEM reconstruction (Fig. 4, magenta lines) still gives a rather large peak sea level contribution of 5 m (Fig. 5). As with the GISP2-optimal simulation, the initial warming entering the Eemian is underestimated by ∼3 °C, and the simulation matches the later trajectory of the reconstruction quite well. This simulation implies an elevation reduction of approximately 1,200 m relative to today at the NEEM deposition site, and a much smaller reduction in elevation at GISP2 of only 700 m (Fig. 5, Bottom Right). This solution also seems deficient. It fails to simulate the constant elevation difference between NEEM and GISP2. It also underestimates the temperature anomaly at GISP2 by 3 ± 1 °C between 119 and 123 ka.
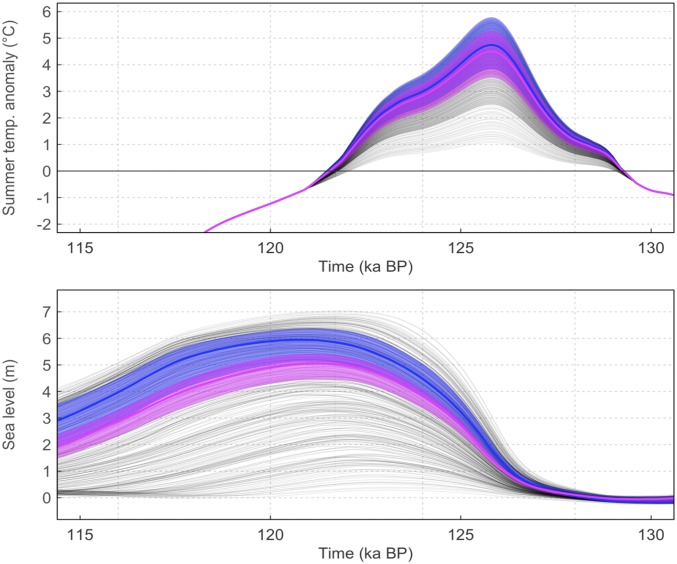
The estimated peak regional summer warming (black dashed lines in Fig. 4, prescribed as boundary forcing in the regional climate model) is quite similar in both cases. The combined GISP2 and NEEM posterior likelihood using this forcing gives a best estimate of ∼4.5 °C regional summer warming, and a 95% credible interval of 3–5 °C. This range is quite consistent with previous best estimates of Arctic summer warming during this time period (1). The optimal solutions are also consistent in placing the greatest sea level contribution late in the Eemian, at ∼121 ka (Fig. S4), which is also when the regional summer temperature falls below the modern value in the simulations. At its minimum, the resulting GrIS is reduced to a rather small northern dome and some sporadic ice-covered regions in the south (Fig. 5, Insets).
Fig. S4.
Time series of simulated regional summer temperature anomaly (Upper) and GrIS contribution to sea level (Lower) during the Eemian. All ensemble members are shown (thin black lines), along with the best estimates for GISP2 (blue line) and NEEM (magenta line), along with the respective 95% credible intervals (shading).
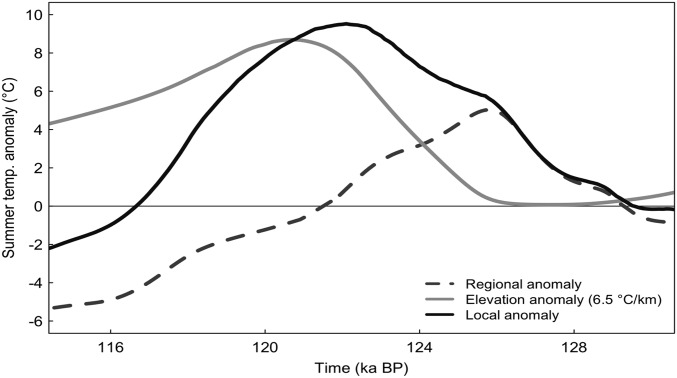
The initial rise in temperature seen in all of the simulations is predominantly due to the background regional warming. These high temperatures initiate melting and a reduction of the volume and area of the ice sheet. Ice dynamics dictate that there must be a lag between the onset of melting and the volume reduction, because the former can only occur at a limited rate. By 125 ka, regional temperatures begin to fall. In the both optimum simulations, Summit and NEEM remain warm until ∼122.5 ka due to declining elevations, which counteract the regional cooling signal (see Fig. S5 for the Summit-optimal case). At around 122–121 ka, the simulated ice volume reaches its minimum, elevations stabilize and the background cooling again dominates the local temperature signal.
Fig. S5.
Time series of the decomposition of the simulated local summer temperature anomaly at GISP2 (solid black line) into the contributions from local elevation change corrected by a lapse rate of 6.5 °C/km (gray line) and the regional summer temperature anomaly forcing (dashed line).
There are a number of features that the optimum models fail to capture. First, and most apparent, is the magnitude of the early temperature anomalies of approximately 6–8 °C at both GISP2 and NEEM. This poor fit is in stark contrast to the rather good fit later in the Eemian. It is unlikely that the regional temperature forcing was larger than simulated here, because it would result in even faster ice sheet melt and an even worse overall fit with the reconstructions. Furthermore, the sensitivity of δ18Oice to temperature may not always be within the range 2.1 ± 0.5 °C/‰. Temporal deviations away from this factor may account for the misfit between inferred and simulated temperature histories early in the Eemian. In general, the use of a constant conversion factor in time could in fact erroneously suggest a constant temperature difference between GISP2 and NEEM and should also be regarded cautiously.
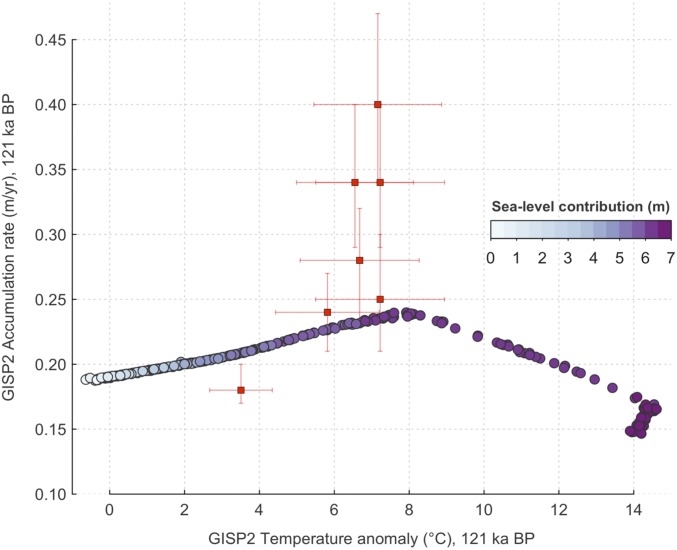
Second, the optimum simulation predicts maximum accumulation rates at GISP2 similar to the Holocene, although the data suggest that rates were considerably higher (Fig. 4 and Fig. S6). Gas-trapping depths (based on the gravitational enrichment of N2) are temperature dependent, and they were similar during the Holocene and Eemian. However, Eemian isotopic temperatures were much warmer. Warmer temperatures imply higher accumulation rates to prevent shoaling of the trapping depth. The model does not reproduce the NEEM accumulation rate record well. Thus, it may be that simulated SLR contributions are slightly overestimated as a result of mismatches between inferred and simulated accumulation rates, although the work of Cuffey and Marshall (31) suggest that the bias would be less than ∼0.5 m.
Fig. S6.
Simulated relationship between the GISP2 accumulation rate and temperature anomaly with respect to the present at 121 ka. The shading shows the corresponding GrIS contribution to sea level for each simulation. Also shown are observations from GISP2 in the time period 121 ± 0.5 ka.
The poor fit with some aspects of the reconstructions may imply that a more detailed modeling approach is needed. The dominant driver of GrIS changes during the Eemian is changes in surface mass balance and, thus, changes in climate. Here we applied a spatially constant temperature anomaly to force our simple regional climate model, which could bias the comparison between the two cores if in reality the climate showed more complex patterns of anomalies. Nonetheless, the overall sensitivity of the ice sheet to large-scale climate changes (as well as its uncertainty) should be well represented by our ensemble of simulations, which gives confidence to the estimated ice sheet retreat and sea level contribution.
Optimizing the Greenland sea level rise (SLR) contribution against both temperature records suggests that the GIS contribution was 5.1 m (4.1–6.2 m; 95% credible interval). Given regional summer temperature anomalies in the range of 3–5 °C, a substantial elevation reduction at both sites is required to achieve and sustain the high Eemian temperatures implied by the δ18Oice data. If, instead, the minimum elevations at these sites would have been comparable to today, the regional temperature anomaly required to reproduce the δ18Oice signal would be closer to 8–10 °C (Fig. S5). Such warm values would be inconsistent with other Arctic paleo archives (32), as well as global climate model simulations for the period (33), which show no more than 0.5–6.5 °C summer warming. In addition, summer temperature anomalies of 8–10 °C would melt the GrIS completely in even the most conservative members of the model ensemble. Such a fate would obviously be inconsistent with the existence of Eemian-age ice at the base of the GrIS. Invoking a lower sensitivity of T to δ18Oice, say 1.5°/‰, diminishes the magnitude of the temperature change, but does not change the basic picture.
The data–model comparison reveals a key challenge to our understanding of the climatic reconstructions from the two sites. Both the TAC and δ18Oice data indicate that changes in elevation and temperature in both cores were similar throughout the Eemian (Figs. 3 and 6). However, the simulations indicate that for only moderate warming at GISP2 of less than 2 °C, the NEEM temperature already becomes significantly higher (Fig. 6). This is not surprising. The NEEM deposition site sits closer to the margin in a rather arid zone of the ice sheet, where a small amount of warming leads to ice loss in the region. Therefore, it is not possible to obtain high enough temperatures to match the GISP2 reconstruction while maintaining low enough temperatures to match the NEEM reconstruction. This apparent paradox could potentially be resolved if the location of the NEEM deposition site changed much more dynamically during the Eemian than has been assumed until now.
Implications for the Source of Last Interglacial Sea Level Rise.
Our optimum simulations give a maximum Greenland contribution of 5 and 6 m to Eemian sea level rise, using NEEM and GISP2, respectively. The 95% credible uncertainty interval supports a large contribution from Greenland of at least 3.9 m (based on the more conservative NEEM–optimal comparison), and the joint probability density function (PDF) gives a range of 4.1–6.2 m. This range is considerably higher than most recent estimates (5). Our model includes an explicit representation of the albedo–melt feedback, as well as the effect of changing insolation on surface mass balance, which could explain a greater sensitivity here to Eemian climate changes than seen in previous studies (e.g., 34, 35). Helsen et al. (36) estimate the maximum sea level contribution from Greenland to be between 1.2 and 3.5 m, using a regional climate model coupled to an ice sheet model via a full energy balance model at the surface. Their results are quite consistent with the TAC-based reconstruction of small elevation changes at NEEM during the Eemian (6). However, at both the Summit and at NEEM, their modeled temperature anomaly is underestimated by several degrees compared with the reconstructions. In contrast, we find that the simulations with significant reductions in elevation at both Summit and NEEM are most consistent with the isotopic temperature reconstructions.
According to the data, GISP2 and NEEM initially reach temperatures comparable to preindustrial levels only at ∼127 ka. In the simulations, Greenland first begins contracting below its present volume at ∼126 ka. The maximum Greenland sea level contribution is attained in the most likely simulations at ∼121 ka, just as Greenland temperatures start to fall below preindustrial levels. Meanwhile, according to Dutton et al. (5) and O’Leary et al. (37), global sea level was already elevated by 3–6 m above the modern level at 127 ka. East Antarctica warmed to Holocene temperatures by ∼131 ka, and reached a temperature maximum shortly thereafter (38). Therefore, Antarctica is a much stronger candidate than Greenland as the source of elevated the sea level early in Eemian (see also ref. 38). Our data suggest that Greenland contributed to elevated sea level at the end of the Eemian (∼121 ka) and its maximum contribution was likely not coeval with that of Antarctica.
Finally, at neither Summit nor NEEM do we observe any evidence for a collapse of the GrIS that would correspond to the sea level rise at 120 ka inferred from western Australian coral samples (37). If there was such a collapse its source must have been east or west Antarctica.
Conclusions
We have presented a reconstructed history of temperature, accumulation rate, and elevation change at Summit, Greenland, during the Eemian. The δ18Oice data from the GISP2 ice core indicate that Summit warmed rapidly through the deglacial, with local, precipitation-weighted temperatures rising to ∼4–8 °C above the modern millennial average between 128 and 126 ka. The local temperature remained high throughout the Eemian until ∼121 ka, even as the regional temperature likely fell because of lower insolation. This sustained plateau in Summit temperature results from the sum of regional temperature and local elevation effects on δ18Oice. Accumulation rates remain high and variable through the early and mid-Eemian at Summit, which contrasts with the steady decline in accumulation rates observed at NEEM. Total air content data indicate that the elevation difference between GISP2 and NEEM remained relatively constant during the Eemian.
In the data and in the simulations, Greenland surpassed its preindustrial temperature at ∼127 ka. Both the data and the simulations suggest that Greenland was not responsible for the elevated global sea level observed at this time. By 121 ka, however, we estimate that the Greenland ice sheet contributed 5.1 m (4.1–6.2 m, 95% credible interval) to excess sea level rise relative to the modern. There is no evidence, however, that Greenland melting contributed to the inferred rapid rise in sea level at 120 ka. Finally, although our results imply a large contribution of Greenland to sea level during this time, discrepancies between the simulated and observed relative changes between the ice cores remain to be explained. In addition, of course, this and similar studies are also limited by the fidelity of the climate and ice sheet models used in the simulations.
Methods
Air Analysis.
CH4 and total air content measurements were conducted at Oregon State University (OSU) following analytical methods detailed in Grachev et al. (39), Mitchell et al. (40), and Rosen et al. (41). Out of 48 samples, we excluded two in which replicate subsamples differed by more than 25 ppb. We also eliminated five samples with likely excess concentrations of CH4 (Results and Discussion). The SD of replicates for the remaining 41 samples was ±3 ppb. An interlaboratory comparison of Holocene and Younger Dryas CH4 data shows good agreement and validates comparisons of CH4 concentrations between the NEEM and NGRIP (analyzed at University of Bern; ref. 6) and GISP2 ice cores (analyzed at OSU). The early Holocene NEEM CH4 average from OSU is ∼736 ppb (41), and from Bern is ∼735 ppb (44). During the Younger Dryas, the NEEM CH4 average from OSU is 503 ppb; that of Bern is 506 ppb.
δO2/N2, δAr/N2, δ15N, and δ18Oatm of trapped air was measured using an adapted extraction and equilibration technique based on Emerson et al. (42) and Dreyfus et al. (43). In these extractions, ∼20 g of ice were used, and the equilibrating time of the headspace and melt water was 1 h. The analytical uncertainty based on the SDs of modern air standards (air taken directly from the roof of the Princeton University Geosciences building in New Jersey; n = 28) for δO2/N2 is ±0.49‰, for δAr/N2 is ±0.29‰, for δ15N is ±0.02‰, and for δ18O of O2 is ±0.04‰. The paleoatmospheric δ18O, δ18Oatm, is equal to δ18O of O2 corrected for gravitational fractionation: δ18Oatm = δ18O – 2.01 * δ15N. The SD for δ18Oatm of modern air standards is ±0.04‰.
Dating Samples from the Concentration of CH4 and the δ18O of O2
δ18O of the samples analyzed in this study are plotted vs. depth in Fig. S1. Reference curves for CH4 concentration and δ18Oatm vs. time are shown in Fig. S3. From a scatterplot of CH4 concentration vs. δ18Oatm, one can graphically solve for the age of a sample (Fig. 2; refs. 8, 9). To exploit this approach, we generated a three-point smoothed reference curve from which ages are interpolated back to ∼130 ka (Fig. S2A). Fig. S2B shows the CH4–δ18Oatm reference curve for the period between 427 and 130 ka. It assumes an interhemispheric methane gradient of 8%, likely too high for glacial times, though generally representative of interglacial periods (e.g., ref. 44). This plot serves to illustrate the locus of points for the interval of ∼300 ky preceding 130 ka, and allows us to determine if any of our samples have gas properties consistent with ages between 427 and 130 ka.
During the Eemian, δ18Oatm measures the true age of a sample more accurately than CH4 (Fig. S3) for two reasons. First, during much of the Eemian, δ18Oatm is changing rapidly and CH4 is changing slowly. Second, there is less natural noise in δ18Oatm than in CH4. Therefore, we derive ages by allowing methane values to range by as much as 25 ppb from the closest point of the reference curve, maintaining δ18Oatm at the measured values. Methane variations of ±25 ppb are similar to the short-term atmospheric variability as observed in Antarctic ice cores from Vostok, Talos Dome, and Dome C (Fig. 3E); analytical variability is much smaller (Methods). If the methane concentration of a sample falls more than 25 ppb from the reference curve, we do not evaluate its age. The analytical uncertainty of δ18Oatm is approximately ±0.04‰ (1σ; Methods).
Here and elsewhere, uncertainties span the age range consistent with δ18Oatm values greater than and less than the observed values by 0.05‰. Between 128 and 126 ka, δ18Oatm changes rapidly, and ages are highly resolved (∼100 y analytical uncertainty). However, from 126 to 121 ka, both CH4 and δ18Oatm change slowly, and ages have large uncertainties (up to ± 3 ky analytical uncertainty). Between 121 and 115 ka, δ18Oatm once again changes rapidly, and age uncertainties are small (±0.3 ky). In assigning ages, we assume that the disturbed ice is older than 105 ka, and no older than 250 ka (glacial isotope stage 7). Ages and geochemical data are listed in Table S1. These assigned ages are gas ages. We make no correction for gas age–ice age difference, but note that Eemian values of this difference are likely less than 0.3 ky and thus within the dating uncertainty itself.
Table S1.
Geochemical data (averages of replicates)
| Depth (m) | δO2/N2 (‰) | δAr/N2 (‰) | δ15N2 (‰) | CH4 (ppb) | δ18Oatm (‰) | δ18Oatm st dev | δ18Oice (‰) | TAC (scc/kg) | Age (ka) | Alt. Age (ka) |
| 2,761.19 | −14.85 | −2.05 | 0.46 | 665.3 | 0.43 | 0.019 | −35.82 | 88.4 | ∼106 | — |
| 2,771.87 | −14.22 | −2.92 | 0.29 | 583.2 | 0.56 | 0.024 | −35.76 | 94.5 | 115.4 | - |
| 2,801.16 | −20.64 | −2.17 | 0.45 | 662.3 | 0.54 | 0.049 | −35.89 | 87.7 | ∼106 | |
| 2,815.85 | −20.14 | −2.85 | 0.44 | 662.3 | 0.52 | 0.010 | −36.42 | 87.7 | ∼106 | |
| 2,841.85 | −16.87 | −4.48 | 0.31 | 669.6 | 0.14 | 0.059 | −33.07 | 93.0 | 119.1 | — |
| 2,845.85 | −10.18 | −0.99 | 0.28 | 674.8 | −0.23 | 0.084 | −31.56 | 91.5 | 121.5 | — |
| 2,854.95 | −12.08 | −0.13 | 0.31 | 698.4 | −0.27 | 0.024 | −32.21 | 85.4 | 122.5 | 124.9 |
| 2,860.95 | −16.09 | −4.18 | 0.31 | 725.8 | −0.28 | 0.024 | −31.89 | 82.8 | 124.6 | — |
| 2,883.05 | −17.49 | −2.02 | 0.31 | 720.8 | −0.07 | 0.000 | −32.34 | 83.1 | 126.6 | — |
| 2,886.95 | −15.67 | −4.04 | 0.29 | 699.2 | −0.17 | 0.010 | −33.33 | 91.1 | 121.1 | — |
| 2,890.95 | −17.24 | −3.09 | 0.39 | 643.9 | 0.18 | 0.021 | −33.44 | 85.8 | 118.9 | — |
| 2,894.05 | −14.00 | −2.33 | 0.38 | 560.1 | 0.40 | 0.064 | −37.17 | 88.7 | — | — |
| 2,921.85 | −15.94 | −1.92 | 0.39 | 723.3 | 0.29 | 0.057 | −35.24 | 83.8 | 127.6 | - |
| 2,949.05 | −15.96 | −2.89 | 0.32 | 717.2 | −0.02 | 0.104 | −33.39 | 83.2 | 126.7 | - |
| 2,952.85 | −17.06 | −4.57 | 0.33 | 651.4 | 0.18 | 0.003 | −33.22 | 95.4 | 118.6 | - |
| 2,955.85 | −16.38 | −3.88 | 0.33 | 702.3 | −0.25 | 0.003 | −32.17 | 83.1 | 121.8 | 125.3 |
| 2,957.85 | −14.49 | −0.60 | 0.41 | 601.7 | 0.24 | 0.074 | −35.54 | 86.1 | — | — |
| 2,959.05 | −17.65 | −4.26 | 0.33 | 719.6 | 0.12 | 0.064 | −34.79 | 82.3 | 127.0 | — |
| 2,962.95 | −14.44 | −2.84 | 0.37 | 722.8 | 0.03 | 0.023 | −34.28 | 80.2 | 126.8 | — |
| 2,969.05 | −18.93 | −4.64 | 0.33 | 663.1 | −0.17 | 0.020 | −34.08 | 90.2 | — | — |
| 2,975.84 | −16.51 | −3.31 | 0.33 | 659.9 | 0.13 | 0.043 | −32.57 | 92.3 | 119.1 | — |
| 2,977.85 | −15.01 | −4.82 | 0.32 | 645.0 | 0.17 | 0.007 | −33.05 | 91.2 | 119.0 | — |
| 2,978.05 | −19.01 | −5.66 | 0.30 | 672.8 | −0.11 | 0.045 | −31.82 | 89.4 | 120.6 | — |
| 2,982.14 | −20.32 | −2.28 | 0.33 | 652.7 | 0.14 | 0.004 | −32.10 | 91.9 | 119.0 | — |
| 2,986.95 | −12.85 | −1.90 | 0.32 | 665.8 | −0.04 | 0.054 | −31.89 | 91.3 | 120.0 | — |
| 2,987.85 | −15.85 | −3.11 | 0.30 | 661.2 | 0.07 | 0.051 | −32.60 | 91.0 | 119.3 | — |
| 2,990.95 | −19.15 | −3.90 | 0.33 | 684.3 | 0.03 | 0.081 | −32.34 | 90.1 | 119.6 | — |
| 2,991.85 | −18.25 | −5.70 | 0.29 | 675.4 | −0.17 | 0.035 | −32.23 | 90.6 | 121.1 | — |
| 2,992.95 | −12.69 | −2.28 | 0.33 | 699.9 | −0.11 | 0.014 | −31.88 | 91.7 | 120.6 | — |
| 2,993.85 | −12.03 | −2.35 | 0.29 | 665.3 | 0.11 | 0.034 | −33.17 | 92.9 | 119.2 | — |
| 2,994.95 | −12.43 | −2.88 | 0.30 | 659.9 | −0.01 | 0.032 | −31.94 | 91.4 | 119.8 | — |
| 2,996.85 | −18.72 | −6.23 | 0.27 | 643.9 | −0.01 | 0.033 | −32.86 | 91.4 | — | — |
| 2,997.90 | −14.50 | −2.41 | 0.32 | 693.2 | −0.13 | 0.101 | −31.56 | 91.3 | 120.7 | — |
| 3,000.93 | −15.04 | −4.53 | 0.29 | 649.8 | 0.06 | 0.016 | −32.17 | 90.3 | 119.3 | — |
| 3,001.85 | −15.61 | −2.61 | 0.34 | 696.4 | −0.12 | 0.042 | −31.59 | 92.1 | 120.7 | — |
| 3,004.27 | 1.32 | 1.14 | 0.34 | 708.6 | 0.33 | 0.022 | −33.96 | 87.2 | >220 | 127.7 |
| 3,009.85 | −13.03 | −1.95 | 0.32 | 655.6 | 0.43 | 0.066 | −34.53 | 89.6 | >220 | — |
| 3,011.85 | −7.62 | 0.15 | 0.35 | 575.4 | 0.32 | 0.035 | −36.43 | 86.4 | >220 | — |
| 3,019.05 | −9.81 | −2.37 | 0.31 | 633.7 | 0.31 | 0.069 | −35.29 | 87.5 | — | — |
| 3,021.29 | −21.19 | −0.75 | 0.44 | 654.7 | 0.51 | 0.089 | −36.19 | 86.3 | >220 | — |
| 3,023.85 | −9.06 | −1.28 | 0.37 | 681.8 | 0.51 | 0.042 | −35.20 | 86.8 | >220 | — |
| 3,024.95 | −2.19 | 1.50 | 0.31 | 690.4 | 0.30 | 0.081 | −34.19 | 85.5 | >220 | — |
| 3,026.05 | −4.21 | 0.07 | 0.34 | 691.2 | 0.32 | 0.055 | −33.94 | 85.2 | >220 | — |
| 3,031.20 | — | — | — | 7,705.5 | — | — | — | — | — | — |
| 3,032.93 | — | — | — | 980.2 | — | — | — | — | — | — |
| 3,034.07 | — | — | — | 844.7 | — | — | — | — | — | — |
| 3,036.46 | — | — | — | 756.8 | — | — | — | — | — | — |
| 3,037.85 | — | — | — | 1,511.4 | — | — | — | — | — | — |
Lines in bold type are the 28 new samples used in this study. Dashes in the place of numbers mean that no data are available, or that age values cannot be calculated. scc, standard cubic centimeters.
Of our 48 original samples, the 5 deepest were excluded because of obvious CH4 contamination. Two samples were excluded because of poor CH4 reproducibility, three are too young to be of interest (∼106 ka), three did not fall on the reference curve, and seven were older than 220 ka. Twenty-six samples date to the interval between 127.6 and 115.4 ka, and are the source of the reconstructed record discussed below. We also retain data for two additional Eemian samples that can each be dated to two possible ages, both of which fall within the warm part of the Eemian (122.5 or 124.9 ka at 2,854-m depth; 121.8 or 125.3 ka at 2,955.85-m depth).
Excluded Samples
Depleted δO2/N2 values (down to −170‰) and enriched δ18Oatm values indicate that O2 preferentially escapes through microfractures during core storage (45). A correction for the enrichment of δ18Oatm relative to the depletion of δO2/N2 values was not well constrained, so samples were excluded when O2 loss exceeded the expected range for typical trapped air (δO2/N2 < −25‰). Sampled sections from each depth segment were also cut ∼1 cm away from the edge of the core surface to reduce gas loss.
Of the 48 new samples analyzed in this study (Fig. S1), we excluded two samples in which replicate CH4 subsamples differed by more than 25 ppb. In addition, four samples had CH4 concentrations between 845 and 7,705 ppb, higher than any observed in the deep continuous Antarctic ice cores. These four samples were from depths greater than 3,030 m; only one sample beyond 3,030-m depth contained CH4 levels within the expected range. Dirty basal ice at GISP2 is first found at a depth of 3,040 m, and extends to the base of the core at 3,054 m depth (46). The elevated CH4 concentrations observed in clean ice between 3,030- and 3,040-m depth are likely a result of contamination with dirty ice, mixed up from the bed. In GRIP, dirty basal ice has a methane concentration of ∼6,000,000 ppb, due to in situ production by methanogens (47). Therefore, extremely small amounts of dirty ice can account for the observed methane contamination. Based on these results, we exclude all five samples from below 3,030-m depth; 41 samples remain.
Unique ages were not established for 15 of these 41 samples. Of these, three had CH4 concentrations lying more than 25 ppb from the reference curve. Three of the shallowest samples (from 2,801 to 2,816 m) date to ∼106 ka. Seven samples from the deepest part of the clean, disturbed ice section (3,004–3,027 m) date back to at least ∼220 ka. Two other samples had more than one possible age; both fell within the Eemian temperature plateau and were retained. These 2 samples, and 26 uniquely dated new samples, are the basis of our updated records.
Considerations on the Interhemispheric CH4 Gradient
Between 124 and 119 ka, Greenland CH4 levels are higher than those in Antarctica by ∼90 ppm, or ∼15% (Fig. 3E). This difference is observed in records from NGRIP and NEEM, as well as in the discontinuous GISP2 record. Such a large gradient is unprecedented in data covering the past 118 ka. Due to the rapid mixing time of the atmosphere, typical interglacial interhemispheric gradients range between ∼6% and 9%. Glacial gradients are smaller (44), at least at those times when the Arctic is not being warmed by an interstadial event. In the context of the modern CH4 budget, a sustained interhemispheric gradient exceeding 10% seems unlikely, as it would require a major change in Northern Hemisphere vs. tropical sources of CH4. This could suggest that, between 124 and 119 ka, the three relevant Greenland cores are contaminated with enough methane to raise the concentration by ∼5% (47). However, contamination is improbable, as it would require equal levels in all three cores. We follow earlier work (6, 8, 9, 12) in regarding the elevated Greenland CH4 values as a primary feature. Two factors that might contribute to the large interhemispheric gradient are a large permafrost methane source induced by the warmth of the Eemian, and especially strong Eemian monsoons.
Gas Age–Ice Age Difference
An estimation of the Eemian gas age–ice age difference (Δage) is made based on correlating δ18Oice and Δage of the GISP2 Holocene section of the ice core, and interpolating this scaling to the last interglacial (48). Parameterizing ∆age in terms of temperature is appropriate because ∆age depends on temperature and the accumulation rate, a related property. This simple estimation of Δage predicts a 68-y change in Δage per ‰ of δ18Oice from the modern value. By this metric, Δage was at most 300 y during the Eemian. Thus, the ages in Table S1 can be used in the discussion of both δ18Oice and total air content during the Eemian with a likely uncertainty, between records, of at most 300 y. No correction was made for the gas age–ice age difference.
Accumulation Rate Calculation
The accumulation rate, in units of meters water equivalent/year, was estimated using the following approach. First, we calculated the paleotemperature as above from the δ18Oice data. Second, we defined the gas-trapping depth as that depth in the firn column that would account for the δ15N enrichment by invoking gravitational fractionation. This depth can be calculated using a form of the barometric equation (from ref. 23):
| [S1] |
Δm is the mass difference between 14N2 and 15N14N in kg mol−1, g is gravitational acceleration (9.8 m s−2), z is depth (m), R is the ideal gas constant (8.314 J K−1 mol−1), and T is the temperature (K). All terms are known except z, which is calculated. Finally, from the equations of Herron and Langway relating firn depth, density, temperature, and accumulation rate (24), we calculated the accumulation rate that is required to give the inferred gas-trapping depth.
The gas-trapping depth thus calculated is different from the close-off depth, which may be defined as the depth where density = 0.83 g ice cm−3, at which point ice becomes impermeable (25). In the case of GISP2, the observed accumulation rate and temperature give a modern close-off depth of 73 m. By contrast, the modern gas-trapping depth, calculated from δ15N, is 65 m. The difference between these two depths reflects the fact that gas trapping begins well above the depth of final close-off. In our calculations, we assume that the gas-trapping depth, as registered by δ15N, is achieved when the density of ice is 0.81 g cm−3. We then calculate, given the temperature and the Herron–Langway equations, the accumulation rate that gives the calculated gas-trapping depth. These values have an estimated uncertainty of ±0.05 m/y. We apply the same technique, using a close-off density = 0.80 g cm−3, to calculate accumulation rate for NEEM samples.
Total Air Content and Elevation
Total air content is related to elevation: lower elevation corresponds to higher atmospheric pressure and a larger mass of air trapped in the porosity of ice. Neglecting confounding effects for the moment, we can reconstruct past atmospheric pressure and elevation. The porosity upon close-off is a function of temperature, and the gas density is related to atmospheric pressure and temperature by the ideal gas law (49, 50). Restricting the GISP2 TAC data to that collected in this work, we calculate an ice sheet lowering of 750 m between 127 and 121 ka.
A number of factors introduce uncertainties into this calculation. First, firnification processes at the ice grain level introduce a relationship between insolation (especially that component driven by obliquity) and TAC (7, 27). This relation can explain a large part of the TAC increase between 127 and 121 ka, but the insolation effect is not well quantified. Second, there are uncertainties in the gradient of atmospheric pressure with elevation, in the effects of wind speed on TAC, and in regional patterns of atmospheric pressure. Largely because of the possible effects of insolation, in our view, the elevation change implied by the TAC data remains to be accurately quantified.
Statistical Method
The simulated evolution of precipitation-weighted temperature at the GISP2 and NEEM deposition sites (Fig. 4, Left) were compared with the reconstructed temperature anomalies using a Gaussian likelihood function that accounts for uncertainty in both the x and y dimensions assuming errors in x and y are independent.
where is the probability of each observed value i (subscript “o”) given a trajectory of model values (subscript “m”) of times t. Here y is the precipitation-weighted annual mean temperature and x is time, and σy and σx are the SE in the observed y and x values, respectively. The summation stems from the fact that any observation of the model “truth” could stem from a variety of combination of errors in x and in y.
The overall likelihood of an individual time series of observations, e.g., at GISP2 or NEEM, is given by the sum of the individual likelihood values of each observation, scaled by q.
In the present case, when using a time series of observations, it is necessary to account for autocorrelation. However, this is a priori unknown and difficult to estimate, given the sparse sampling at GISP2 and the varying resolution of data points at NEEM. To circumvent this problem, we correct the likelihood by assuming it should be scaled by an exponent in the range , where N is the total number of observations in the time series. Setting q = 1/N corresponds to a geometric mean over the observations (effectively reducing the number of observations in the time series to 1, and thus increasing uncertainty), and setting q = 1 implies that all observations in the time series are statistically independent. The choice of q can have a strong effect on the width of the posterior PDF. To avoid a wholly subjective choice, we chose q = 0.04 such that the 1-sigma width of the posterior PDF encapsulates ∼68% of the observations.
The time series at GISP2 and NEEM are considered as independent, so their likelihoods can be multiplied together to give the combined likelihood of the observations for a given model trajectory.
The likelihood functions are normalized such that the sum over all likelihoods is 1.
Following Bayes theorem, we calculate the posterior likelihood as:
is calculated as described above and because all observations are given equal weight (i.e., a flat prior), can be factored out of the equation given that the integral is 1. Thus, the remaining unknown is the likelihood of each model version, , which is determined by the prior weights assigned to the model versions. Following previous work (20), we prescribe Gaussian priors to the model parameters perturbed in our ensemble, namely a free parameter in the melt model (parameter c) and the sensitivity of the precipitation to changing temperatures (parameter p):
Finally, the likelihood of each model version is then determined as . The likelihoods are used as weighting in a kernel density estimate (using the package ks in R) to produce the posterior PDF for the ensemble.
Model Evaluation–Accumulation Rate and Temperature Relationship
Fig. S6 shows the reconstructed GISP2 accumulation vs. the GISP2 temperature anomaly relative to the Holocene at 121 ka. Temperature anomalies up to 8 °C correspond to increasing accumulation rates, because warmer air carries more moisture. For temperature anomalies above 8 °C, however, the accumulation rate falls, reflecting not regional climatic changes, but a reduction in orographic precipitation due to ice retreat. At 121 ka, the median temperature increase calculated from dT/dδ18Oice is ∼6 °C, which leads to almost total melting of the ice sheet, in the range of 6–7 m sle.
The underestimation of GISP2 accumulation rates by the model appears to suggest that the GrIS sea level contribution may be somewhat overestimated, because higher accumulation rates favor a larger ice sheet. However, the significance of this bias is ambiguous, because higher local accumulation rates may simply be a consequence of lower elevation and warmer temperatures. The model simulates the changes in the NEEM accumulation rates quite poorly. However, it is known that NEEM, which is closer to the margin, could experience local climatic changes that do not have large-scale impacts on the ice sheet.
Acknowledgments
We thank the members of the National Ice Core Laboratory for their support in recovering samples from the ice core archive. We are grateful to Mahé Perrette for help with the statistical analysis. This work was supported by Grants PLR 1107343 and 1107744 from the U.S. National Science Foundation. A.R. was funded by the Marie Curie Seventh Framework Programme [Project PIEF-GA-2012-331835; European Ice Sheet Modeling Initiative (EURICE)] and the Spanish Ministerio de Economía y Competitividad [Project CGL2014-59384-R; Modeling Abrupt Climate Change (MOCCA)]. M.L.B. was funded by the Princeton-BP Amoco Carbon Mitigation Initiative.
Footnotes
The authors declare no conflict of interest.
This article is a PNAS Direct Submission.
This article contains supporting information online at www.pnas.org/lookup/suppl/doi:10.1073/pnas.1524766113/-/DCSupplemental.
References
- 1.Clark PU, Huybers P. Global change: Interglacial and future sea level. Nature. 2009;462(7275):856–857. doi: 10.1038/462856a. [DOI] [PubMed] [Google Scholar]
- 2.Kopp RE, Simons FJ, Mitrovica JX, Maloof AC, Oppenheimer M. Probabilistic assessment of sea level during the last interglacial stage. Nature. 2009;462(7275):863–867. doi: 10.1038/nature08686. [DOI] [PubMed] [Google Scholar]
- 3. IPCC (2013) Annex I: Atlas of global and regional climate projections. Climate Change 2013: The Physical Science Basis. Contribution of Working Group I to the Fifth Assessment Report of the Intergovernmental Panel on Climate Change eds Stocker TF et al. (Cambridge Univ Press, Cambridge, UK)
- 4.IPCC . Annex II: Climate system scenario tables. In: Stocker TF, et al., editors. Climate Change 2013: The Physical Science Basis. Contribution of Working Group I to the Fifth Assessment Report of the Intergovernmental Panel on Climate Change. Cambridge Univ Press; Cambridge, UK: 2013. [Google Scholar]
- 5.Dutton A, et al. Sea-level rise due to polar ice-sheet mass loss during past warm periods. Science. 2015;349(6244):aaa4019. doi: 10.1126/science.aaa4019. [DOI] [PubMed] [Google Scholar]
- 6.NEEM Community Members Eemian interglacial reconstructed from a Greenland folded ice core. Nature. 2013;493(7433):489–494. doi: 10.1038/nature11789. [DOI] [PubMed] [Google Scholar]
- 7.Raynaud D, et al. The local insolation signature of air content in Antarctic ice. A new step toward an absolute dating of ice records. Earth Planet Sci Lett. 2007;261(3-4):337–349. [Google Scholar]
- 8.Suwa M, von Fischer JC, Bender ML, Landais A, Brook EJ. Chronology reconstruction for the disturbed bottom section of the GISP2 and the GRIP ice cores: Implications for Termination II in Greenland. J Geophys Res Atmos. 2006;111 doi: 10.1029/2005JD006032. [DOI] [Google Scholar]
- 9.Chappellaz J, Brook E, Blunier T, Malaize B. CH4 and delta O-18 of O-2 records from Antarctic and Greenland ice: A clue for stratigraphic disturbance in the bottom part of the Greenland Ice Core Project and the Greenland Ice Sheet Project 2 ice cores. J Geophys Res Oceans. 1997;102(C12):26547–26557. [Google Scholar]
- 10.Grootes PM, Stuiver M, White JWC, Johnsen S, Jouzel J. Comparison of oxygen-isotope records from the GISP2 and GRIP Greenland ice cores. Nature. 1993;366(6455):552–554. [Google Scholar]
- 11.Johnsen SJ, et al. Oxygen isotope and palaeotemperature records from six Greenland ice-core stations: Camp Century, Dye-3, GRIP, GISP2, Renland and NorthGRIP. J Quat Sci. 2001;16(4):299–307. [Google Scholar]
- 12.Capron E, et al. Synchronising EDML and NorthGRIP ice cores using delta O-18 of atmospheric oxygen (delta O-18(atm)) and CH4 measurements over MIS5 (80-123 kyr) Quat Sci Rev. 2010;29(1-2):222–234. [Google Scholar]
- 13.Loulergue L, et al. Orbital and millennial-scale features of atmospheric CH4 over the past 800,000 years. Nature. 2008;453(7193):383–386. doi: 10.1038/nature06950. [DOI] [PubMed] [Google Scholar]
- 14.Dreyfus GB. 2008. Dating an 800,000 year Antarctic ice core record using the isotopic composition of trapped air. Thesis dissertation (Princeton University, Princeton, NJ) [Google Scholar]
- 15.Robinson A, Calov R, Ganopolski A. An efficient regional energy-moisture balance model for simulation of the Greenland Ice Sheet response to climate change. Cryosph. 2010;4(2):129–144. [Google Scholar]
- 16.Greve R. A continuum–mechanical formulation for shallow polythermal ice sheets. Philos Trans R Soc London Ser A Math Phys Eng Sci. 1997;355(1726):921–974. [Google Scholar]
- 17.Ganopolski A, Calov R. The role of orbital forcing, carbon dioxide and regolith in 100 kyr glacial cycles. Clim Past. 2011;7(4):1415–1425. [Google Scholar]
- 18.Robinson A, Calov R, Ganopolski A. Multistability and critical thresholds of the Greenland ice sheet. Nat Clim Chang. 2012;2(4):429–432. [Google Scholar]
- 19.van de Berg WJ, van den Broeke MR, van Meijgaard E, Kaspar F. Importance of precipitation seasonality for the interpretation of Eemian ice core isotope records from Greenland. Clim Past. 2013;9(4):1589–1600. [Google Scholar]
- 20.Vinther BM, et al. Holocene thinning of the Greenland ice sheet. Nature. 2009;461(7262):385–388. doi: 10.1038/nature08355. [DOI] [PubMed] [Google Scholar]
- 21.Johnsen SJ, Dansgaard W, White JWC. The origin of Arctic precipitation under present and glacial conditions. Tellus B Chem Phys Meteorol. 1989;41(4):452–468. [Google Scholar]
- 22.Merz N, Born A, Raible CC, Fischer H, Stocker TF. Dependence of Eemian Greenland temperature reconstructions on the ice sheet topography. Clim Past. 2014;10(4):1221–1238. [Google Scholar]
- 23.Sowers T, Bender ML, Raynaud D. Elemental and isotopic composition of occluded O2 and N2 in polar ice. J Geophys Res Atmos. 1989;94(D4):5137–5150. [Google Scholar]
- 24.Herron MM, Langway CC. Firn densification – An empirical model. J Glaciol. 1980;25(93):373–385. [Google Scholar]
- 25.Martinerie P, Raynaud D, Etheridge DM, Barnola JM, Mazaudier D. Physical and climatic parameters which influence the air content in polar ice. Earth Planet Sci Lett. 1992;112(1-4):1–13. [Google Scholar]
- 26.Eicher O, et al. Climatic and insolation control on the high-resolution total air content in the NGRIP ice core. Cllim. Past Discuss. 2015;11:5509–5548. [Google Scholar]
- 27.Lipenkov V, Raynaud D, Loutre M, Duval P. On the potential of coupling air content and O2/N2 from trapped air for establishing an ice core chronology tuned on local insolation. Quat Sci Rev. 2011;30(23-24):3280–3289. [Google Scholar]
- 28.Schilt A, et al. Atmospheric nitrous oxide during the last 140,000 years. Earth Planet Sci Lett. 2010;300(1-2):33–43. [Google Scholar]
- 29.Buiron D, et al. TALDICE-1 age scale of the Talos Dome deep ice core, East Antarctica. Clim Past. 2011;7(1):1–16. [Google Scholar]
- 30.Petit JR, et al. Climate and atmospheric history of the past 420,000 years from the Vostok ice core, Antarctica. Nature. 1999;399(6735):429–436. [Google Scholar]
- 31.Cuffey KM, Marshall SJ. Substantial contribution to sea-level rise during the last interglacial from the Greenland ice sheet. Nature. 2000;404(6778):591–594. doi: 10.1038/35007053. [DOI] [PubMed] [Google Scholar]
- 32.Capron E, et al. Temporal and spatial structure of multi-millennial temperature changes at high latitudes during the Last Interglacial. Quat Sci Rev. 2014;103:116–133. [Google Scholar]
- 33.Bakker P, et al. Last interglacial temperature evolution – A model inter-comparison. Clim Past. 2013;9(2):605–619. [Google Scholar]
- 34.Quiquet A, Ritz C, Punge HJ, Salas y Melia D. Greenland contribution to sea level rise during the last glacial period: A modeling study driven and constrained by ice core data. Clim Past. 2013;9(1):353–366. [Google Scholar]
- 35.Stone EJ, Lunt DJ, Annan JD, Hargreaves JC. Quantification of the Greenland ice sheet contribution to Last Interglacial sea level rise. Clim Past. 2013;9(2):621–639. [Google Scholar]
- 36.Helsen MM, van der Berg WJ, van de Wal RSW, van den Broeke MR, Oerlemans J. Coupled regional climate-ice-sheet simulation shows limited Greenland ice loss during the Eemian. Clim Past. 2013;9(4):1773–1788. [Google Scholar]
- 37.O’Leary MJ, et al. Ice sheet collapse following a prolonged period of stable sea-level during the last interglacial. Nat Geosci. 2013;6(9):796–800. [Google Scholar]
- 38.Steig EJ, et al. Influence of West Antarctic Ice Sheet collapse on Antarctic surface climate. Geophys Res Lett. 2015;42(12) doi: 10.1002/2015GL063861. [DOI] [Google Scholar]
- 39.Grachev AM, Brook EJ, Severinghaus JP, Pisias NG. Relative timing and variability of atmospheric methane and GISP2 oxygen isotopes between 68 and 86 ka. Global Biogeochem Cycles. 2009;23 doi: 10.1029/2008GB003330. [DOI] [Google Scholar]
- 40.Mitchell LE, Brook EJ, Sowers T, McConnell JR, Taylor K. Multidecadal variability of atmospheric methane, 1000-1800 CE. J Geophys Res Biogeosci. 2011;116 doi: 10.1029/2010JG001441. [DOI] [Google Scholar]
- 41.Rosen JL, et al. An ice core record of near-synchronous global climate changes at the Bolling transition. Nat Geosci. 2014;7(6):459–463. [Google Scholar]
- 42.Emerson S, Quay PD, Stump C, Wilbur D, Schudlich R. Chemical tracers of productivity and respiration in the subtropical Pacific Ocean. J Geophys Res. Oceans. 1995;100(C8):15873–15887. [Google Scholar]
- 43.Dreyfus GB, et al. Anomalous flow below 2700 m in the EPICA Dome C ice core detected using delta O-18 of atmospheric oxygen measurements. Clim Past. 2007;3(2):341–353. [Google Scholar]
- 44.Baumgartner M, et al. High-resolution interpolar difference of atmospheric methane around the Last Glacial Maximum. Biogeosciences. 2012;9(11):3961–3977. [Google Scholar]
- 45.Bender ML, Sowers T, Lipenkov V. On the concentrations of O-2, N-2, and Ar in trapped gases from ice cores. J Geophys Res Atmos. 1995;100(D9):18651–18660. [Google Scholar]
- 46.Bender ML, Burgess E, Alley RB, Barnett B, Clow GD. On the nature of the dirty ice at the bottom of the GISP2 ice core. Earth Planet Sci Lett. 2010;299(3-4):466–473. [Google Scholar]
- 47.Souchez R, Janssens L, Lemmens M, Stauffer B. Very-low oxygen concentration in basal ice from Summit, Central Greenland. Geophys Res Lett. 1995;22(15):2001–2004. [Google Scholar]
- 48.Seierstadt I, et al. Consistently dated records from the Greenland GRIP, GISP2 and NGRIP ice cores for the past 104 ka reveal regional millennial-scale δ18O gradients with possible Heinrich event imprint. Quat Sci Rev. 2014;106:29–46. [Google Scholar]
- 49.Raynaud D, Chappellaz J, Ritz C, Martinerie P. Air content along the Greenland Ice Core Project core: A record of surface climatic parameters and elevation in central Greenland. J Geophys Res Oceans. 1997;102(C12):26607–26613. [Google Scholar]
- 50.Martinerie P, et al. Air content paleo record in the Vostok ice core (Antarctica): A mixed record of climatic and glaciological parameters. J Geophys Res. 1994;99(D5):10565–10576. [Google Scholar]


