Significance
Notch-mediated lateral inhibition regulates binary cell fate choice, resulting in salt and pepper patterns during various developmental processes. The wave of differentiation in the Drosophila visual center accompanies Notch activity that is propagated without the formation of a salt and pepper pattern, implying that Notch does not regulate lateral inhibition during this process. In this study, by combining mathematical modeling and genetic analysis, we showed that Notch-mediated lateral inhibition is implemented within the proneural wave. The combination of Notch-mediated lateral inhibition and EGF-mediated reaction diffusion enables a function of Notch signaling that regulates propagation of the wave of differentiation.
Keywords: Notch, lateral inhibition, EGF, reaction diffusion, proneural wave
Abstract
Notch-mediated lateral inhibition regulates binary cell fate choice, resulting in salt and pepper patterns during various developmental processes. However, how Notch signaling behaves in combination with other signaling systems remains elusive. The wave of differentiation in the Drosophila visual center or “proneural wave” accompanies Notch activity that is propagated without the formation of a salt and pepper pattern, implying that Notch does not form a feedback loop of lateral inhibition during this process. However, mathematical modeling and genetic analysis clearly showed that Notch-mediated lateral inhibition is implemented within the proneural wave. Because partial reduction in EGF signaling causes the formation of the salt and pepper pattern, it is most likely that EGF diffusion cancels salt and pepper pattern formation in silico and in vivo. Moreover, the combination of Notch-mediated lateral inhibition and EGF-mediated reaction diffusion enables a function of Notch signaling that regulates propagation of the wave of differentiation.
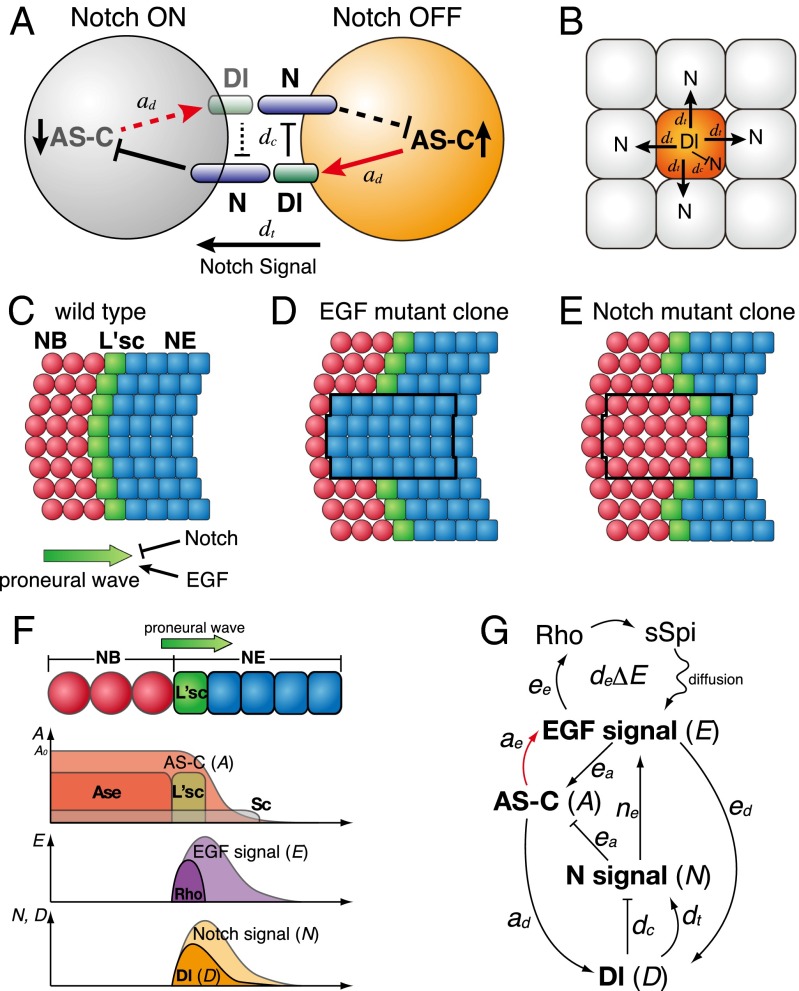
Notch signaling is evolutionarily conserved throughout the animal kingdom and regulates various biological processes. In particular, when the expression of its ligand and targets are not predetermined but are regulated by Notch signaling interplay between neighboring cells (Fig. 1A), lateral inhibition takes place. Notch-mediated lateral inhibition plays an essential role in specifying differentiated cells from a sheet of undifferentiated cells in a spatially regulated manner (1, 2). During the development of the nervous system, neural precursor cells and neuroepithelial cells (NEs) form a salt and pepper pattern as a result of Notch-mediated lateral inhibition (Fig. 1 A and B). The differentiating cells up-regulate the basic helix–loop–helix proneural transcription factors of the Drosophila Achaete–Scute Complex (AS-C) family in the process of becoming neural precursors. These factors induce the expression of Delta (Dl), a Notch ligand, in differentiating cells (3). Because Dl is a transmembrane ligand, it activates the Notch receptor only in neighboring cells, which remain undifferentiated and eventually become epithelial cells. In undifferentiating cells, Notch activity down-regulates AS-C expression to prevent neural differentiation and Dl expression. Furthermore, Dl autonomously represses Notch in differentiating cells through the process of cis-inhibition (4, 5). Consequently, differentiating cells send stronger Notch signals and undifferentiating cells send weaker Notch signals to neighboring cells, establishing a binary cell fate and resulting in a salt and pepper pattern. Notch-mediated lateral inhibition takes place when Dl expression is not predetermined but is under the control of Notch signaling and/or AS-C expression and was first discovered by fly geneticists (2). Its system behavior has been extensively studied via mathematical modeling (6, 7).
Fig. 1.
The molecular mechanisms of Notch-mediated lateral inhibition and proneural wave progression. (A) Notch signaling between two cells mediates the binary cell fate decision. (B) The differentiating cells prevent the neighboring cells from differentiating via Dl/Notch signaling. (C–F) The proneural wave sweeps across the NE sheet (blue). The NE cells express L’sc (green), triggering the differentiation from NE to NB (red). (C) The WT. (D and E) In clones mutant for EGF and Notch signaling (black lines), the proneural wave is eliminated and accelerated, respectively. (F) A schema showing the relative distributions of AS-C family (L’sc, Sc, and Ase), Rho and Dl expression, and the activities of EGF and Notch signaling. (G) A schema showing the relationship between the EGF signal (E), Notch signal (N), Dl expression (D), and AS-C expression (A). Black and red arrows are based on known observations and findings in this work, respectively.
Notch signaling plays more diverse roles when combined with other signaling systems. For example, Notch and EGF cooperate to regulate vulval development in Caenorhabditis elegans and photoreceptor cell differentiation in the fly retina (8–10). When the interplay between Notch and other signaling includes complex feedback with oscillatory behavior, the role of Notch becomes difficult to study without mathematical models. For example, vertebrate segmentation is controlled by the interplay between Notch and FGF, including multiple negative feedbacks. Interdisciplinary approaches have revealed that oscillatory gene networks constitute the segmentation clock machinery (11, 12).
The waves of differentiation in visual system development are key examples of such complex interplays between Notch and other signaling systems. The development of the retina in fly, fish, and chicken includes waves of differentiation that accompany Notch-mediated lateral inhibition and secreted factors, such as Hedgehog, that trigger neural differentiation (13–16). During the propagation of the differentiation wave, the expression of Dl and proneural genes is not predetermined, but always accompanies the propagating wave. Therefore, many of the theoretical studies regard the mode of Notch action during wave propagation as lateral inhibition. Previous mathematical modeling has revealed essential roles for Notch signaling in the formation of a salt and pepper pattern of photoreceptor neurons (17–20). Although it was suggested that Dl restricts wave propagation during eye development (17), Notch signaling is also required for undifferentiated cells to acquire a proneural state before the wave progression in the fly retina (21, 22). Therefore, the loss of Notch signaling causes the loss of photoreceptor differentiation, which conflicts with the prediction of the above theoretical study, in which the early proneural function of Notch was not implemented (17). The previous in vivo studies using the fly retina did not specifically inhibit the later function of Notch to examine its role to suppress the wave propagation (21, 22).
A wave of differentiation has also been observed in the developing fly brain. In this study, we focused on a wave of differentiation called the “proneural wave” (23, 24), which occurs in the largest component of the fly visual center, the “medulla.” During proneural wave progression, the sheet-like NEs sequentially differentiate to neural stem cells called neuroblasts (NBs) (Fig. 1 C and F). The differentiation boundary is defined by the transient expression of the proneural transcription factor Lethal of scute (L'sc) in NEs, which acts as a trigger of differentiation. The proneural wave sweeps across the NE sheet as L'sc expression progresses, and all NEs eventually differentiate into NBs without exhibiting the salt and pepper pattern. EGF and Notch play central roles in this process by positively and negatively regulating wave progression, respectively (Fig. 1 D and E) (25–27). The ligands of the EGF and Notch signaling pathways are produced in L’sc-positive NEs immediately before NB differentiation. These pathways induce their own ligand production, forming positive feedback loops (26, 27). Additionally, EGF and Notch positively regulate each other to form a mutual feedback loop (Fig. 1G) (27). The wave progression and NB differentiation are eliminated in EGF mutant clones and accelerated in Notch mutant clones (Fig. 1 D and E). A significant decrease in the number of NBs and neurons is observed in Notch mutant brains, because NEs are precociously differentiated to NBs before they extensively proliferate via symmetric division (25, 27). Additionally, JAK/STAT and Hippo signaling has also been shown to regulate the proneural wave progression (24, 26, 28). Among these signaling systems, ligand expressions and signal activations of EGF and Notch are restricted to the cells nearby the wave front. In this study, we focused on the roles of EGF and Notch that constitute the central components of the proneural wave.
There are critical differences between the proneural wave and the waves of differentiation in the retina. (i) During development of the retina, the distribution of differentiated cells exhibits a salt and pepper pattern (29). By contrast, all NE cells eventually differentiate to NBs during proneural waves without exhibiting a salt and pepper pattern (24). Nevertheless, all of the components required for lateral inhibition are expressed in the proneural wave and the expression of Dl and AS-C is not predetermined, but accompanies wave progression. (ii) The loss of Notch signaling clearly indicates acceleration of proneural wave propagation and precocious differentiation of NBs in vivo (26, 27) in contrast to the loss of differentiation phenotype observed in the fly retina, in which the early proneural function of Notch was impaired (22). The proneural function of Notch has not been observed in the proneural wave (27). Thus, Notch signaling seems to regulate the speed of proneural wave propagation instead of generating the salt and pepper pattern by unidentified mechanisms. Does Notch form a lateral inhibitory feedback? If so, how does Notch control wave propagation without forming a salt and pepper pattern? By combining mathematical modeling and genetic analysis, we show that EGF diffusion cancels salt and pepper pattern formation and that Notch-mediated lateral inhibition plays a role in the control of proneural wave propagation when combined with EGF-mediated reaction diffusion.
Our results also suggest that the difference between the retinal wave and the proneural wave is much smaller than it looks and that the core mechanisms of the wave progression are conserved because both systems include Notch-mediated lateral inhibition. The comparative analyses of the two systems in silico and in vivo will expand our understanding of the wave of differentiation.
Results
Establishing the Four-Component Model.
During proneural wave progression, no salt and pepper pattern is observed in the distribution of NB and Notch activity (Fig. 1C) (24, 26, 27). Thus, the model of Notch-mediated lateral inhibition is superficially inconsistent with the proneural wave. However, the proneural wave is associated with Dl, Notch, and proneural genes, which form a feedback loop of lateral inhibition during neural precursor differentiation processes. Therefore, it is very unlikely that the behavior of Notch signaling is completely different from that of lateral inhibition. We assume that these components form a feedback loop of lateral inhibition.
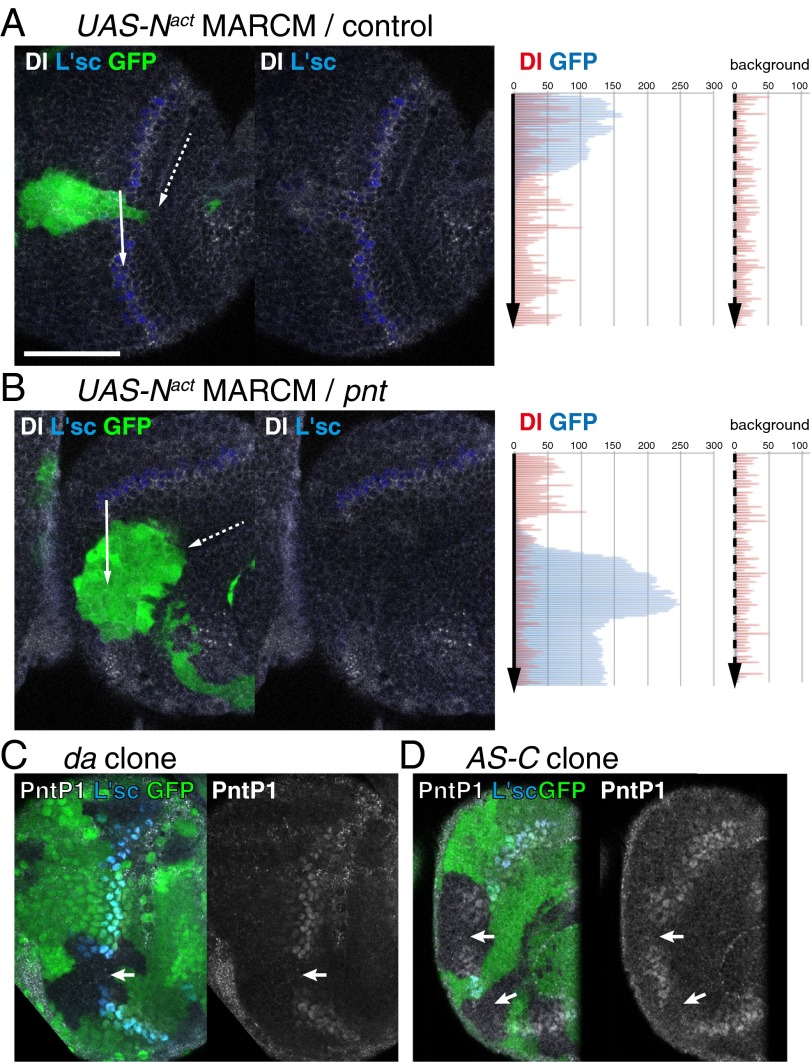
Contradicting this notion, Dl is expressed in Notch-ON cells, and Dl expression is up-regulated by the activation of Notch signaling during proneural wave progression as shown previously (Fig. 1F) (26, 27). During Notch-mediated lateral inhibition, the down-regulation of Dl expression in Notch-ON cells is essential for establishing binary cell fate (Fig. 1A). However, Dl expression may be indirectly activated by Notch signaling via EGF signaling, because EGF and Notch signaling pathways are mutually dependent, and Dl expression remains in Notch mutant clones as shown previously (Fig. 1G) (27, 30). Additionally, Dl expression is up-regulated in clones in which EGF signaling is activated (31). To confirm this idea in vivo, we performed the following genetic experiments. In clones expressing the constitutively active form of Notch, Dl expression was activated, despite the absence of L'sc expression (Fig. 2A) (n = 11 of 17) (26). However, Dl expression was suppressed by the pnt mutation, which eliminates EGF signaling (Fig. 2B) (n = 22 of 22), in the presence of the active form of Notch. These results suggest that Dl expression is not directly activated by Notch but is primarily activated by EGF signaling in vivo (Fig. 1G). These observations imply that EGF, Dl, Notch, and AS-C are all essential for understanding proneural wave progression. Therefore, we formulated a four-component model of the proneural wave using a reaction diffusion system for EGF and a lateral inhibition system for Notch based on previous observations and our own findings (Figs. 1G, black and red arrows, respectively, and 3A) (23, 24, 26, 27, 30, 31).
Fig. 2.
Notch activity along the proneural wave. The proneural wave in vivo in late third instar larval brain (anterior to the left and dorsal to the top). (A) In cells expressing the active form of Notch (GFP-positive; green), L'sc (blue) is suppressed, and Dl (white) is induced (white arrow). (B) In pnt mutant cells expressing the active form of Notch, L'sc and Dl are suppressed (white arrow). Left shows the expression levels of Dl (red) and GFP (blue) along the arrows (mutant clones), and Right shows the expression levels of Dl (red) and GFP (blue) along the dashed arrows (background) in A and B. (C) L'sc (blue) and PntP1 (white) are reduced in da mutant clone visualized by the absence of GFP (green). (D) L'sc (blue) is eliminated and PntP1 (white) is reduced in clones homozygous for Df(1)260–1 visualized by the absence of GFP (green). (Scale bar: 50 μm.)
Fig. 3.
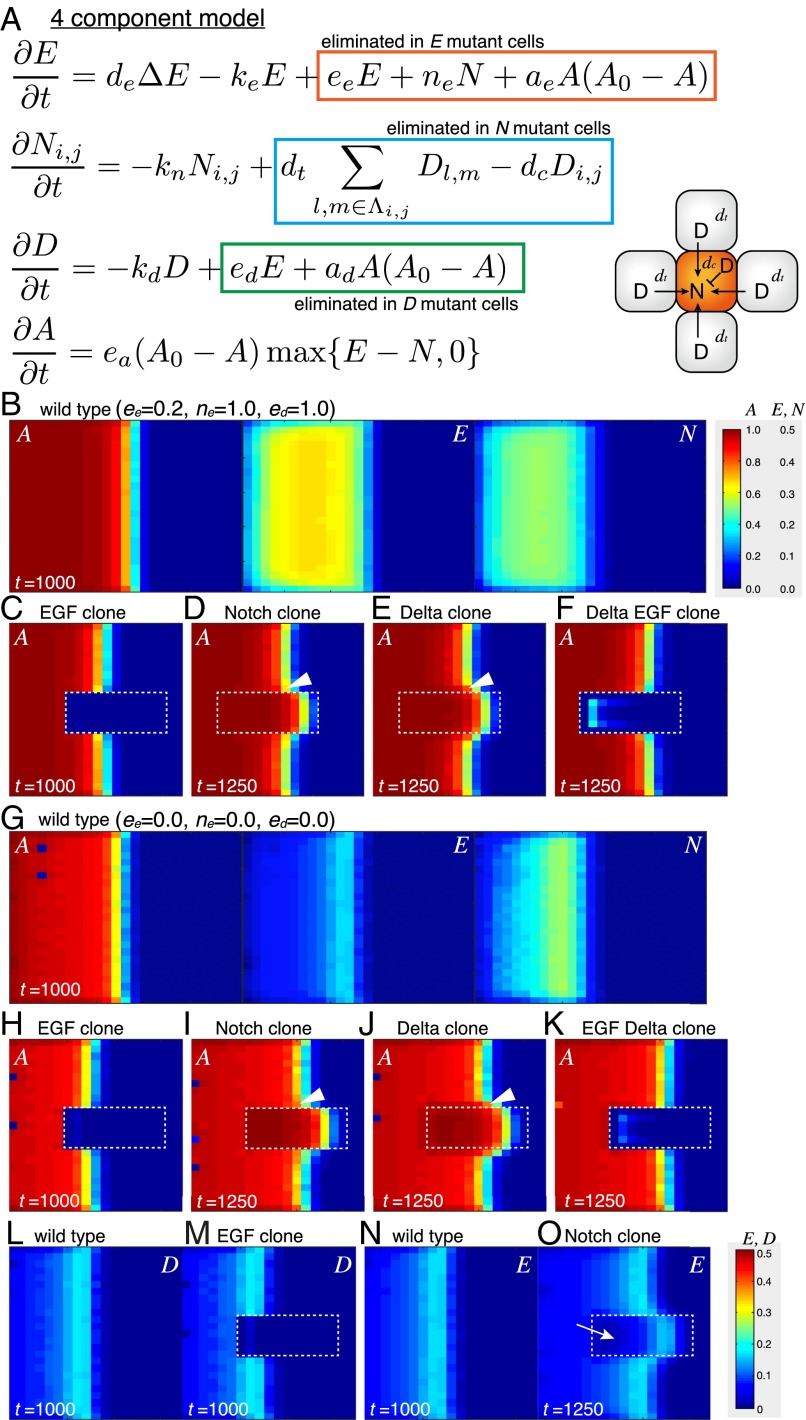
The four-component model. (A) The four-component model. (B–F) Results of in silico experiments visualizing A, N, and E (ee = 0.2 and ne = ed = 1.0). Mutant clones are surrounded by white dotted lines. (B) The WT. (C) EGF mutant clone. (D) Notch mutant clone. (E) Dl mutant clone. (F) Dl EGF double-mutant clone. (D and E) Proneural wave is nonautonomously accelerated (arrowheads). (G–O) Results of in silico experiments in the absence of the feedbacks (ee = ne = ed = 0). Mutant clones are surrounded by white dotted lines. (G–K) The results of the WT and mutant clones are very similar to those in B–F. (L and M) D is down-regulated in EGF mutant clone. (N and O) E is down-regulated in Notch mutant clone (arrow). (F and K) The residual A value inside the Dl EGF double-mutant clone is most likely caused by EGF diffused from the WT cells.
In this model, E is a composite variable for the EGF ligand concentration and EGF signaling. The rate of change in E is influenced by its diffusion (deΔE), degradation (keE), EGF signaling (eeE), and Notch signaling (neN). The diffusion of E was calculated as described in Methods. N and D are variables for Notch signal activity and Dl expression, respectively. N is influenced by its degradation (knN), trans-activation by Dl expression in adjacent cells (trans-Dl; dtD), and cis-inhibition by the autonomous action of Dl (cis-Dl; dcD) (4, 5). Notch receptor expression levels are largely uniform in NEs in vivo (25, 30) and constant in our model. D is regulated by its degradation (kdD) and EGF signaling (edE), because EGF signaling induces Dl transcription (31, 32). A is an abstract value specifying the state of differentiation (A = 0 in undifferentiated NE, A = A0 in differentiated NB, and A0 = 1 in the followings). We assume that A is intimately related to the expression levels of AS-C proteins. Among AS-C family proteins, at least L’sc, Sc, and Ase are expressed near the wave front of the proneural wave and act redundantly to trigger NB differentiation (24, 30, 33). Because AS-C expression is positively and negatively regulated by E and N, respectively, A should be similarly regulated by E and N. After NEs become NBs, they stop producing EGF ligand and Dl and start producing multiple types of neurons (34, 35). In differentiated NBs (A = A0), the state of differentiation must be maintained, because NB differentiation is an irreversible process. This property is incorporated in the model by setting the rate of change of A as ea(A0 − A)max{E − N, 0}. When N is greater than E, the value of E − N is zero to avoid dedifferentiation of differentiating cells. AS-C triggers the expression of Dl (3). The loss of AS-C function in the da mutant clone, in which AS-C cannot heterodimerize with Da, reduces or delays the onset of EGF signaling as visualized by PntP1 expression (n = 8 of 46) (Figs. 1G, red arrow and 2C). Similar results were obtained in clones deficient for AS-C (n = 13 of 29) (Fig. 2D). Thus, A up-regulates E and D. However, EGF ligand and Dl are only produced at the interface between undifferentiated and differentiated cells but not produced in differentiated NBs. Thus, we include the EGF and Dl production terms aeA(A0 − A) and adA(A0 − A), respectively (Fig. 3A).
Four-Component Model Reproduces Proneural Wave Progression.
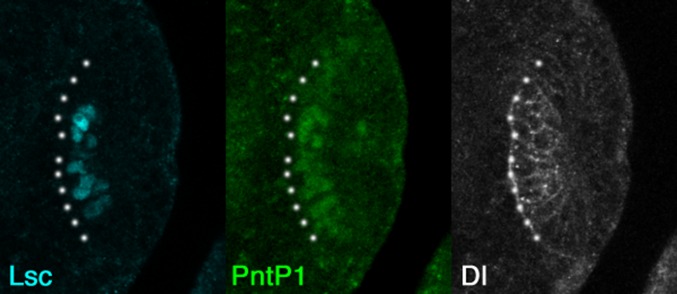
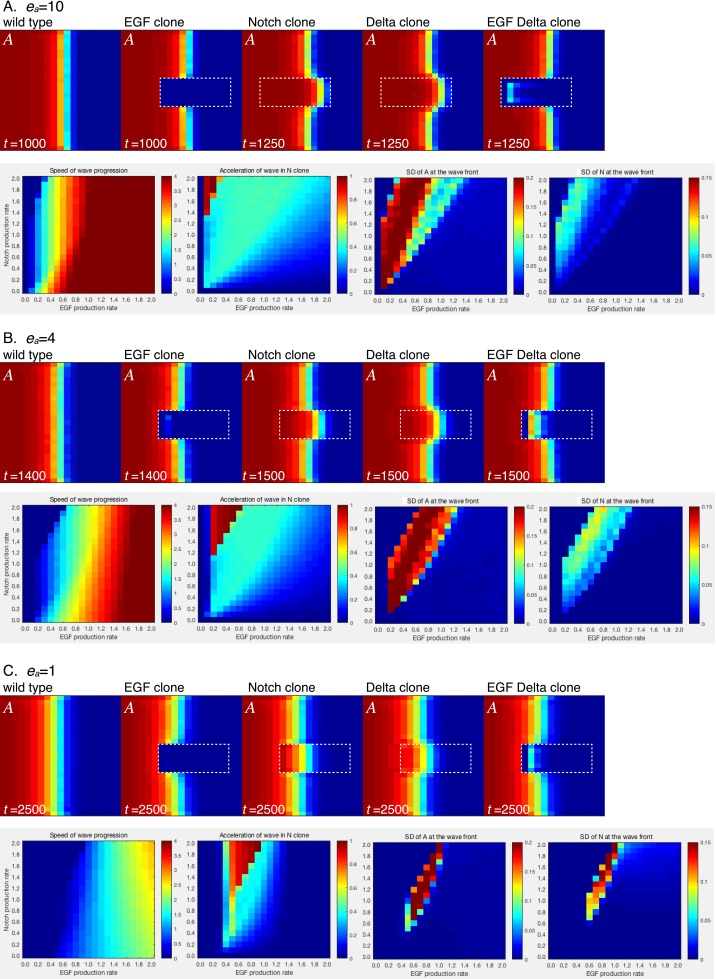
Before the initiation of the proneural wave at the second larval instar stage, L'sc expression and the activation of EGF and Dl expression were observed in optic lobe cells adjacent to the central brain (Fig. S1). Thus, moderate levels of A, E, and D in the anterior-most cells in the NE field are the initial conditions of the proneural wave in our in silico experiments (Methods). As a first step, we assumed that the magnitudes of the reaction rates for these molecules are equivalent in vivo. Thus, all parameters, except ea, ee, dt, and dc, were set to one in the computer simulation of the four-component model; ee was set smaller than the degradation rate of EGF (keE), because EGF does not increase infinitely in vivo. As a typical value, ee was set to 0.2 unless otherwise noted; dt was set to 0.25 to make Notch signaling comparable with EGF signaling, because one cell receives Dl from as many as four neighboring cells (Fig. 3A). The effects of trans-activation and cis-inhibition by Dl were set as equivalent (dc = 0.25); ea seems to determine the speed of differentiation and is not crucial for reproducing the following in silico experiments. For example, similar results were obtained for ea = 1, ea = 4, and ea = 10 (Fig. S2). We set ea = 10, because this condition is more robust to changes in other parameter values.
Fig. S1.
Expression of L'sc, PntP1, and Dl before proneural wave progression. Expression patterns of L'sc (blue), PntP1 (green), and Dl (white) before the initiation of the proneural wave at second instar. White dots indicate the boundary between the optic lobe and the central brain.
Fig. S2.
Behaviors of the four-component model at various ea values: (A) ea = 10, (B) ea = 4, and (C) ea = 1. Results of in silico experiments visualizing A in the WT and the presence of clones mutant for EGF, Notch, Dl, and EGF/Dl (ee = 0.2 and ne = ed = 1.0). Phase diagrams showing speed of wave progression, acceleration of wave in Notch clone, and SDs of A and N by changing NP (dt = dc = 0.25 × NP) and EP (ne = ae = EP and ee = 0.2 × EP).
Stochastic noise is required for Notch-mediated lateral inhibition to establish a salt and pepper pattern. Otherwise, two neighboring cells equally activate Notch signaling in each other without exhibiting any bias between them. Therefore, we added mild fluctuations to the initial conditions and differences of variables in each iteration. Because the equation for A is unstable at A = 0, the simple addition of noise induces spontaneous differentiation apart from the wave front. We, therefore, included noise by multiplying 1 + 0.1 × θ to the initial conditions and differences of E, N, D, and A in each iteration (θ is Gaussian noise). When E, N, D, and A became negative values, they were regarded as zero.
The four-component model reproduced the progression of the proneural wave in a WT condition without exhibiting any salt and pepper pattern, despite the presence of noise (Fig. 3B and Movie S1). Additionally, the four-component model reproduces many characteristics of the proneural wave. We can generate mutant clones of EGF, Notch, and Dl in silico in the central area of the NE field (Fig. 3 C–E). In the EGF mutant clone, the wave progression and NB differentiation disappeared autonomously (Fig. 3C) (27). In contrast, the wave was nonautonomously accelerated in the Notch mutant clone as observed in vivo (Fig. 3D and Movie S2) (27). Because Dl activates Notch only in adjacent cells and autonomously inactivates Notch, it is not trivial whether the mutants for Notch and Dl show the same phenotype. Therefore, it is important that wave progression was similarly accelerated in the Dl mutant clone (Fig. 3E). Note that the nonautonomous accelerations of the wave propagation observed in vivo were also reproduced in silico (Fig. 3 D and E) (27). The above results were reproduced using various parameter sets as discussed later, indicating that these in silico results do not depend on the details of the actual parameter values.
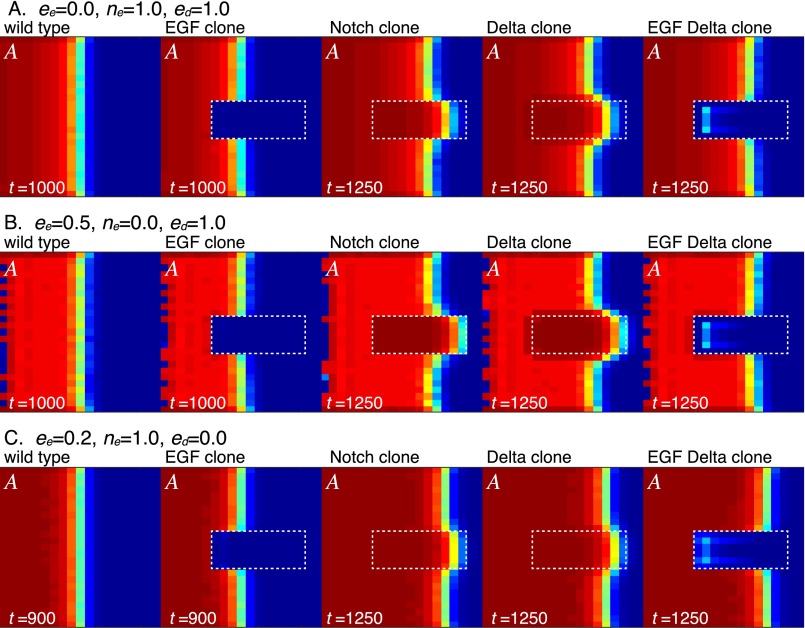
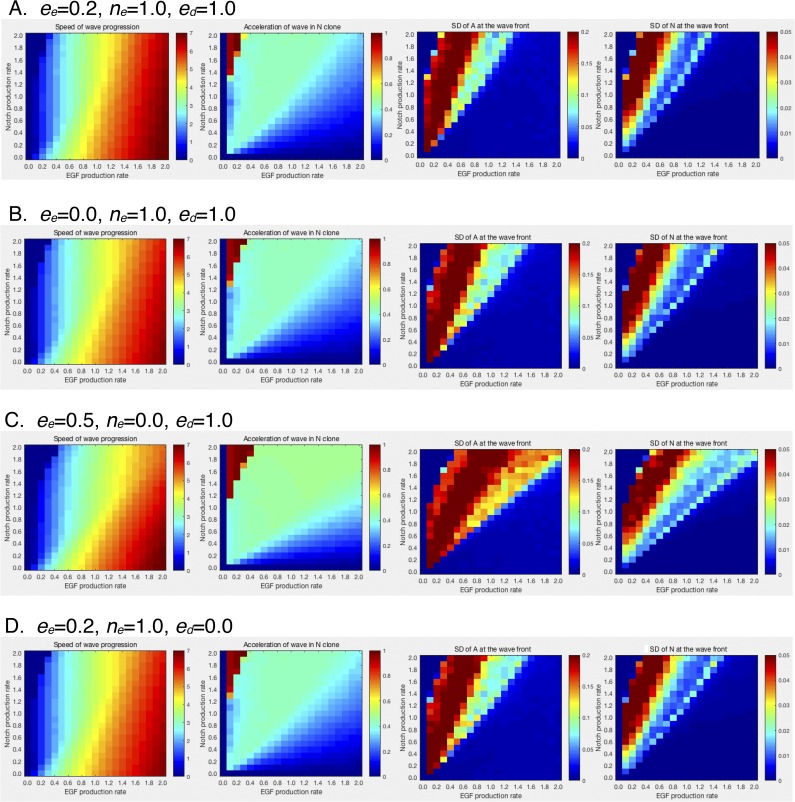
It has been suggested that multiple feedbacks, including the induction of EGF production by EGF signaling (eeE), the induction of EGF production by Notch signaling (neN), and the induction of Dl expression by EGF signaling (edE), play essential roles in vivo (23, 27). Interestingly, the behavior of the proneural wave did not change significantly when these feedbacks were abolished in silico (ee = ne = ed = 0 and ee = 0, ne = 0, and ed = 0) (Fig. 3 G–K and Figs. S3 and S4). Even in the absence of these feedbacks, loss of EGF reduces Dl and loss of Notch reduces EGF expression in silico (Fig. 3 L–O). The presence of these feedbacks has been suggested by genetic experiments (23, 27), and it is not clear whether such feedbacks indeed exist in vivo. We do not have any in vivo evidence that Pnt directly activates Rhomboid (Rho) expression, that Su(H) directly activates Rho expression, and that Pnt directly activates Dl expression in the developing fly brain. Our in silico study suggests that these direct regulations are dispensable to account for the behavior of the proneural wave. In the following in silico experiments, these feedbacks were ignored by setting ee = ne = ed = 0 unless otherwise noted.
Fig. S3.
Behaviors of the four-component model in the absence or presence of the feedbacks. Results of in silico experiments visualizing A in the WT and the presence of clones mutant for EGF, Notch, Dl, and EGF/Dl. (A) No EGF autoregulation (ee = 0, ne = 1.0, and ed = 1.0). (B) No EGF regulation by Notch (ee = 0.5, ne = 0, and ed = 1.0). (C) No Dl regulation by EGF (ee = 0.2, ne = 1.0, and ed = 0).
Fig. S4.
Phase diagrams of the four-component model in the absence or presence of the feedbacks. Phase diagrams showing speed of wave progression, acceleration of wave in Notch clone, and SDs of A and N by changing NP (dt = dc = 0.25 × NP) and EP (ne = ae = EP and ee = 0.2 × EP). (A) Standard condition (ee = 0.2, ne = 1.0, and ed = 1.0). (B) No EGF autoregulation (ee = 0, ne = 1.0, and ed = 1.0). (C) No EGF regulation by Notch (ee = 0.5, ne = 0, and ed = 1.0). (D) No Dl regulation by EGF (ee = 0.2, ne = 1.0, and ed = 0).
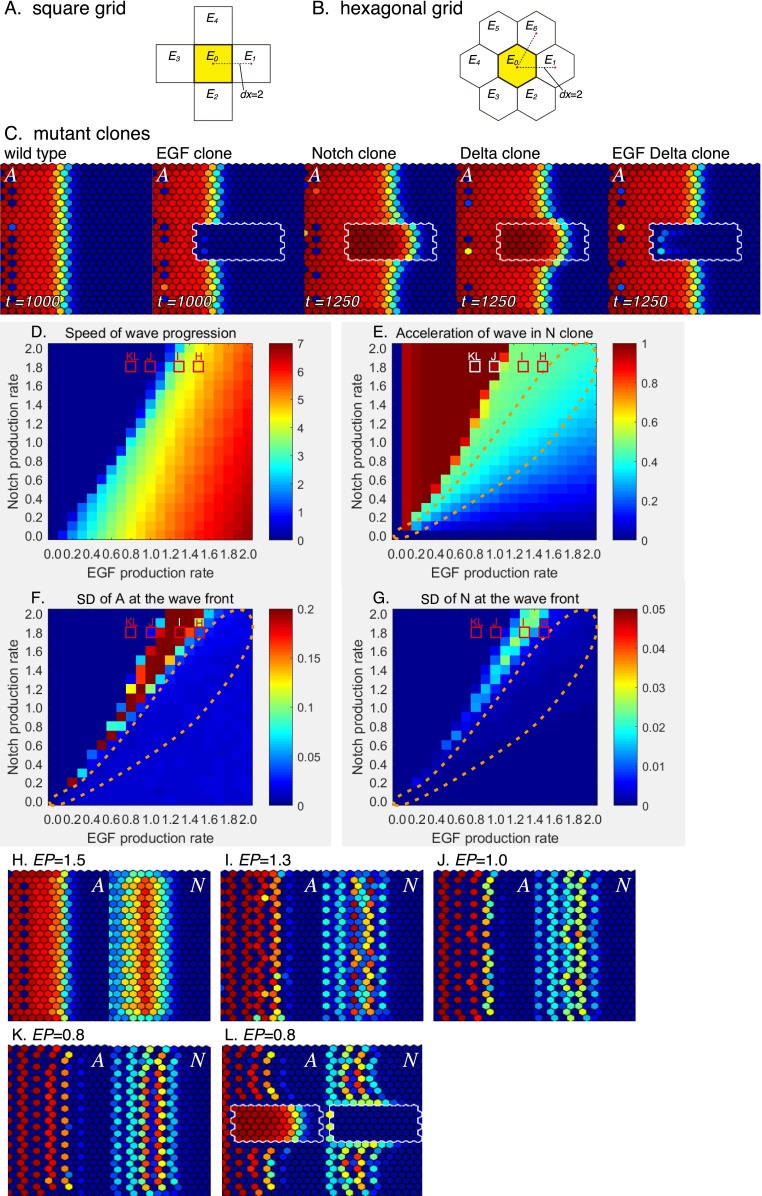
In the above in silico studies, a square grid was always used for representing the cell arrangement. Although the actual cell arrangement is not uniform in vivo (27), we obtained essentially the same results when a hexagonal grid was used (SI Results and Fig. S5). Moreover, the results of these discrete models were confirmed by using the continuous models. Thus, the difference in cell arrangement does not change our conclusions.
Fig. S5.
Behaviors of the four-component model in a hexagonal grid model. (A and B) The arrangement of cells are compared in (A) a square grid model and (B) a hexagonal grid model. In both cases, the distances between neighboring cells are 2 (dx = 2). (C) Results of in silico experiments visualizing A in the WT and the presence of clones mutant for EGF, Notch, Dl, and EGF/Dl (de = 0.67, dt = 0.17, dc = 0.25, and ee = ne = ed = 0). (D–G) Phase diagrams showing (D) speed of wave progression, (E) acceleration of wave in Notch clone, and SDs of (F) A and (G) N by changing NP (dt = 0.17 × NP and dc = 0.25 × NP) and EP (ae = EP). Orange dotted lines indicate the area in which NP and EP are equivalent, showing wave acceleration in N clone without showing salt and pepper patterns in A and N. The red and white rectangles indicate the conditions shown in H–L. (H–L) Salt and pepper and striped patterns of A and N at the wave front by changing the value of EP (NP = 1.8). (H) EP = 1.5, (I) EP = 1.3, (J) EP = 1.0, and (K and L) EP = 0.8. (H–K) The WT and (L) Notch mutant clone.
Salt and Pepper Patterns in Notch Activity Are Cancelled by EGF Activity.
Under WT conditions, Notch activity does not exhibit obvious salt and pepper patterns in vivo as visualized by E(spl)mγ-GFP (Fig. 4A) (36). Similarly, the four-component model, which explicitly includes the lateral inhibition system, reproduced the progression of the proneural wave without exhibiting any salt and pepper pattern, despite the presence of noise (Fig. 4B and Movie S3). There are conditions that have to be fulfilled for coupled equations to yield a salt and pepper pattern (6, 37).
Fig. 4.
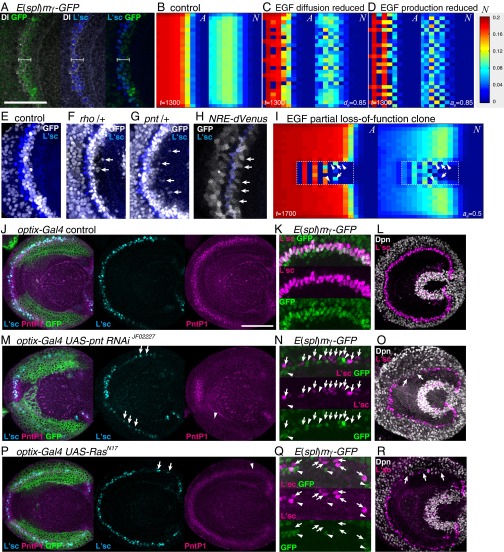
Salt and pepper pattern is canceled by EGF in silico and in vivo. (A) Notch activity as visualized by E(spl)mγ-GFP (green) and Dl expression (white) is found at the wave front expressing L'sc (blue). White brackets indicate the coexpression of GFP and Dl. Anterior is to the left, and dorsal is to the top. (B–D) Reducing (C) EGF diffusion (de = 0.85) or (D) EP (ae = 0.85), A and N show fluctuations compared with the control (B). (B–D and I) Results of in silico experiments in the absence of the feedbacks (ee = ne = ed = 0). (E–G) Maximum intensity projection images of E(spl)mγ-GFP (white) and L'sc (blue) in (E) control, (F) rho heterozygous, and (G) pnt heterozygous backgrounds. Ectopic GFP-positive cells are indicated by arrows. (H) Notch activity as visualized by NRE-dVenus exhibits a salt and pepper pattern (white; arrows). *Signals behind the proneural wave reflect the Notch activity in NBs. (I) A and N show fluctuations in clones in which EGF production is reduced (ae = 0.5). Arrows indicate the cells in which A is up-regulated while N is down-regulated. Arrowheads indicate the cells in which A is down-regulated while N is up-regulated. (Scale bars: 50 μm in A and E–H.) (J–R) EGF signaling was partially reduced under the control of optix-Gal4 in the dorsal and ventral regions of the optic lobe as visualized by GFP (green in J, M, and P). (J–L) Control. (M–O) UAS-pnt RNAiJF02227. (P–R) UAS-RasN17. (J, M, and P) L'sc expression became stochastic when EGF signaling was reduced as visualized by PntP1 (arrows and arrowheads in M and P). (K, N, and Q) Notch activity as visualized by E(spl)mγ-GFP (green) and L'sc expression (magenta) was compared at the dorsal regions of the optic lobe. (N and Q) L'sc and GFP showed stochastic expression when EGF signal was reduced (arrows and arrowheads, respectively). Note that the L'sc and GFP signals were largely complementary to each other. (L, O, and R) NB differentiation as visualized by Dpn expression (white) was not impaired in the absence of L'sc expression (magenta; arrows in O and R). (K, L, N, O, Q, and R) Maximum intensity projection images. (Scale bars: 50 μm in J, L, M, O, P, and R; 25 μm in K, N, and Q.)
In the case of proneural wave progression, diffusible EGF up-regulates Dl expression. Therefore, the salt and pepper pattern may be obscured by EGF activity, because Notch-ON cells produce EGF, which in turn, activates Notch signaling in surrounding Notch-OFF cells. Indeed, a decrease in the diffusion constant of EGF (de = 0.85) or EGF production rate (EP; ae = 0.85) resulted in a salt and pepper-like fluctuation in Notch activity (Fig. 4 C and D and Movies S3 and S4), suggesting that EGF cancels the fluctuation in Notch activity. We tested this idea in vivo by using a mutant of Rho, a metalloprotease that triggers EGF ligand secretion (38), and the pnt mutation to reduce EGF activity. Interestingly, ectopic Notch-ON cells isolated from the wave front were observed in the rho and pnt heterozygous background (Fig. 4 E–G), probably because EGF is diffusible and/or EGF signaling is weakly up-regulated before the wave front. The salt and pepper pattern was not detectable within the wave front, in which GFP was uniformly up-regulated. In the WT, the average number of isolated GFP-positive cells was 0.43 (Fig. 4E) (n = 35). By contrast, 2.36 and 2.39 cells were observed in rho and pnt heterozygotes, respectively (n = 28 and 41, respectively; P < 0.0001 by Welch’s t test) (Fig. 4 F and G), supporting the notion that EGF cancels the fluctuation in Notch activity. When diffusion or production of EGF was reduced in silico, the value of A also exhibited a salt and pepper pattern (Fig. 4 C and D). However, we did not detect such fluctuations in L'sc expression pattern at the wave front in the heterozygous backgrounds for either rho or pnt (Fig. 4 F and G).
Furthermore, we speculated that the salt and pepper pattern in Notch activity may be detectable depending on the temporal resolution of the Notch activity markers, because the fluctuation in Notch activity is likely to be rapidly cancelled by EGF signaling. To detect mild fluctuations in Notch signaling, we used a more sensitive marker, NRE-dVenus, which directly monitors the transcriptional activity of the Su(H)/Notch complex with dVenus, a rapidly degraded form of the fluorescent protein Venus (39). In this case, salt and pepper-like fluctuations of Notch signaling were observed at the wave front of the proneural wave in the WT background (Fig. 4H). However, fluctuations in L'sc expression pattern were not observed, despite the salt and pepper patterns in the Notch activity. The biological significance of the salt and pepper pattern in the Notch activity remains elusive.
Further reduction in EGF signaling activity may be required to observe a salt and pepper pattern in L'sc expression. As shown previously, the complete loss of EGF signaling eliminates L'sc expression (27). However, our in silico experiments suggest that salt and pepper patterns in the values of A and N should be observed in clones in which EP is reduced to 50% of WT cells (Fig. 4I) (ae = 0.5). Therefore, we searched for in vivo conditions in which EGF signaling is partially reduced and L'sc expression becomes fluctuated. Among many different combinations of Gal4 and UAS strains, we found that UAS-pntRNAiJF02227 and UAS-RasN17 under the control of optix-Gal4 caused salt and pepper-like fluctuations in L'sc expression (Fig. 4 J, M, and P) (n = 14 of 14 and 18 of 48, respectively). The mean distance between L'sc-positive cells was 6.92 and 12.22 μm in control and UAS-pntRNAiJF02227, respectively (P < 0.006 by Welch’s t test). pnt RNAi degrades pnt mRNA, and RasN17 inhibits the activity of Ras to down-regulate the EGF signaling. In both cases, EGF signaling was reduced in a nonstochastic manner in the dorsal and ventral regions of the optic lobe as visualized by PntP1 expression. Nevertheless, expression of L'sc and E(spl)mγ-GFP became stochastic (Fig. 4 M, N, P, and Q). Importantly, the distributions of L'sc and GFP signals were largely complementary to each other (arrows and arrowheads in Fig. 4 N and Q, respectively) as observed in silico (Fig. 4I), suggesting that Notch-mediated lateral inhibition implemented in the proneural wave caused the salt and pepper patterns in L'sc and E(spl)mγ-GFP in vivo. Although we observed this phenomenon only in the dorsal and ventral regions of the brain, the molecular mechanisms of the proneural wave are thought to be the same along the dorsoventral axis (24, 27).
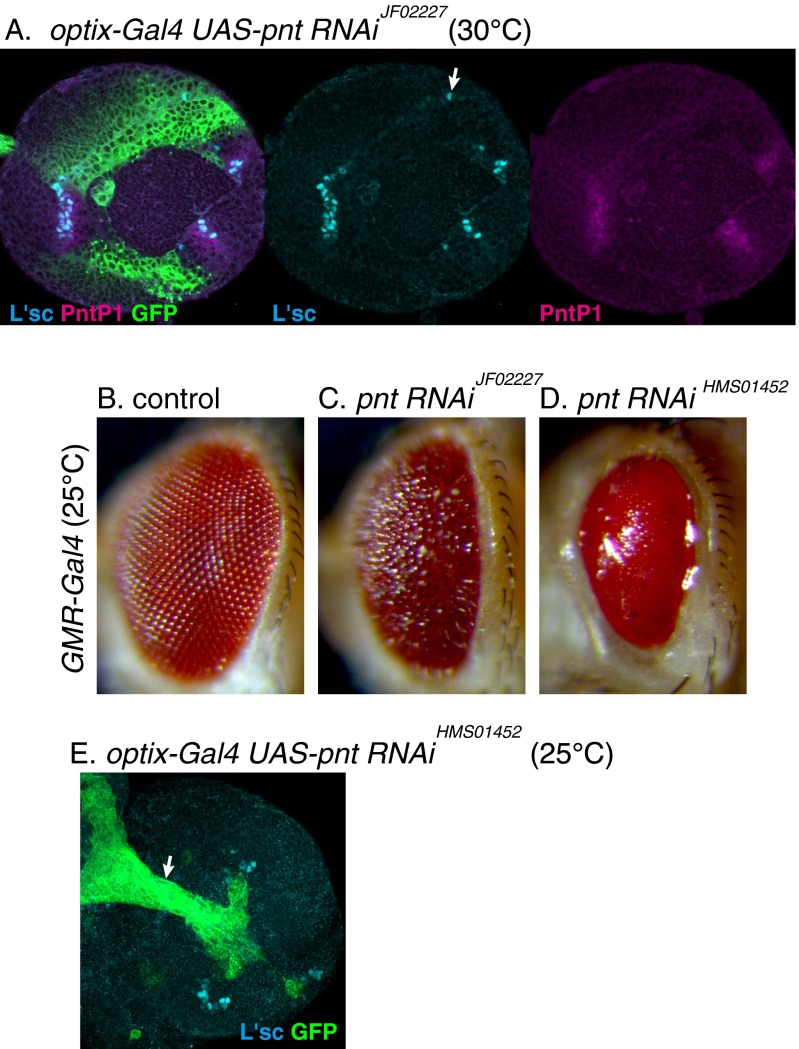
To confirm that EGF signaling was partially reduced by pnt RNAi in the above experiments, optix-Gal4 UAS-pntRNAi flies were raised at a higher temperature (30 °C) to increase the effect of pnt RNAi. L'sc expression was almost completely lost as in the case of pnt null mutant clones (n = 24 of 24) (Fig. S6A) (27). Additionally, its effect was compared with the more potent pnt RNAi strain. Under the control of GMR-Gal4, UAS-pntRNAiHMS01452 caused smaller eyes compared with UAS-pntRNAiJF02227, suggesting that the former is more potent than the latter (Fig. S6 B–D). Indeed, UAS-pntRNAiHMS01452 under the control of optix-Gal4 eliminated the proneural wave (n = 26 of 26) (Fig. S6E). The residual PntP1 signal suggests that UAS-RasN17 only partially reduced EGF signaling (Fig. 4P). These results support the conclusions that the partial reduction in EGF signaling causes the salt and pepper patterns in Notch and AS-C (Fig. 4 N and Q) as predicted in silico (Fig. 4I) and that the proneural wave indeed involves Notch-mediated lateral inhibition.
Fig. S6.
Differential inactivation of EGF signaling by pnt RNAi. (A) EGF signaling was strongly reduced by optix-Gal4 UAS-pnt RNAiJF02227 at 30 °C. GFP (green), L'sc (blue), and PntP1 (magenta). Expression of L'sc and PntP1 was completely lost, except for a small number of L'sc-positive cells in the lateral region of the optic lobe (arrow). (B–D) The effects of pnt RNAi on eye development were compared under the control of GMR-Gal4 at 25 °C. (B) Control. (C) UAS-pnt RNAiJF02227 caused mild reduction in the eye size. (D) UAS-pnt RNAiHMS01452 caused severe reduction in the eye size. (E) EGF signaling was strongly reduced by optix-Gal4 UAS-pnt RNAiHMS01452 at 25 °C. GFP (green) and L'sc (blue). The proneural wave as visualized by L'sc expression was eliminated. Optic stalk is indicated by an arrow.
However, even in the presence of fluctuated L'sc expression, NBs were uniformly formed behind the proneural wave as visualized by Dpn expression (Fig. 4 L, O, and R). The final pattern of NB formation may be rescued by unidentified mechanisms.
Salt and Pepper Pattern Formation Requires a Higher Notch Activity Compared with Wave Speed Control.
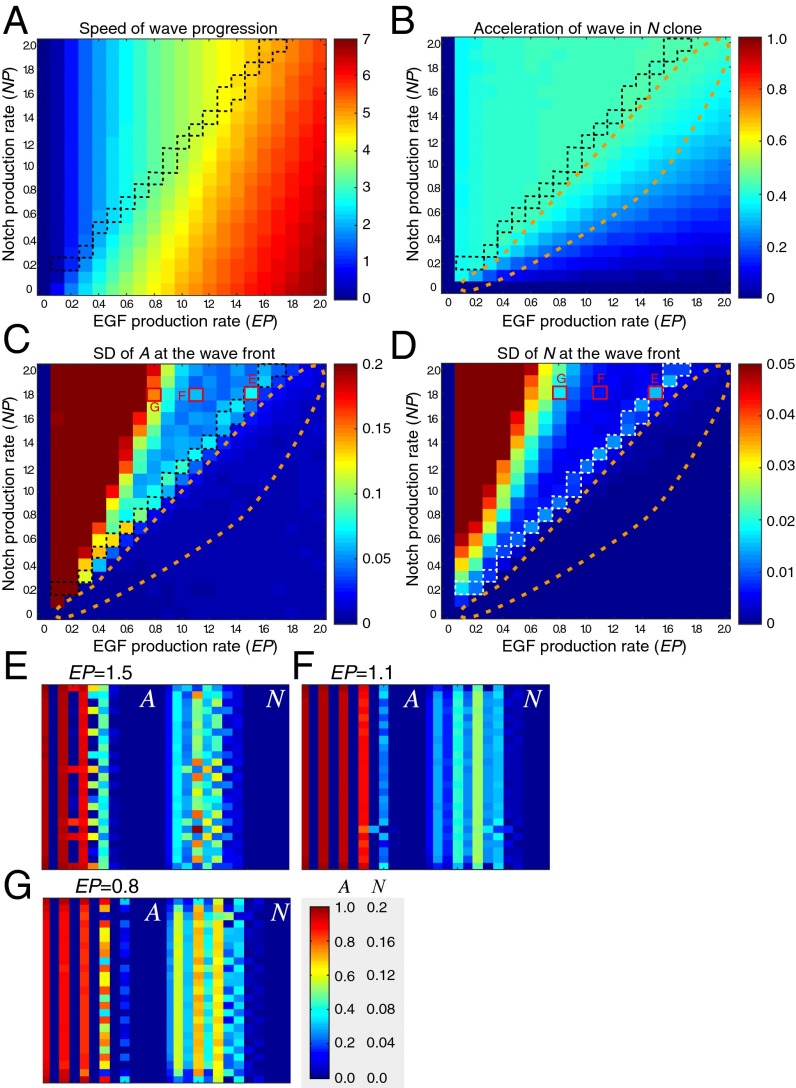
The above results indicate that Notch signaling has two distinct functions: regulation of the wave progression speed and formation of a salt and pepper pattern. In the fly brain, the former is prominent, but the latter is obscure as discussed above. Therefore, it is likely that different levels of Notch signaling activity are required for these two functions. We surveyed the presence of two phenotypes (i.e., wave acceleration in a Notch clone and the salt and pepper pattern in N) under various parameter conditions. Here, we defined the Notch production rate (NP) and EP, both of which vary from 0.0 to 2.0 in intervals of 0.1. For simplicity, all parameters related to NP and EP were proportionally changed according to NP and EP (dt = dc = 0.25 × NP, ne = ae = EP, and ee = 0.2 × EP), respectively. Under these conditions, we examined (i) the speed of wave progression, (ii) the acceleration of the wave in Notch clones, (iii) the salt and pepper index of A (SD of A at the wave front), and (iv) the salt and pepper index of N (SD of N at the wave front) (Fig 5 A–D and Figs. S2 and S4).
Fig. 5.
Phase diagrams of the four-component model. Results of in silico experiments in the absence of the feedbacks (ee = ne = ed = 0). (A) Speed of wave progression, (B) acceleration of wave in Notch clone, and (C and D) SDs of A and N at the wave front, respectively, were examined by changing NP (dt = dc = 0.25 × NP) and EP (ae = EP). Orange dotted lines indicate the area in which NP and EP are equivalent, showing wave acceleration in N clone without showing salt and pepper patterns in A and N. White and black dotted lines indicate the area in which NP is relatively larger or EP is relatively smaller showing salt and pepper patterns in A and N. The red rectangles indicate the conditions shown in E–G. (E–G) Salt and pepper and striped patterns of A and N at the wave front by changing the value of EP (NP = 1.8). (E) EP = 1.5, (F) EP = 1.1, and (G) EP = 0.8.
In general, proneural wave progression was observed when EP was greater than 0.2. EP and NP positively and negatively influenced the speed of wave progression, respectively (Fig. 5A). Acceleration of the wave in Notch clones was observed for a wide range of EP and NP values (Fig. 5B), whereas salt and pepper patterns in A and N were observed only when NP was significantly larger than EP (Fig. 5 C and D). When EP and NP were roughly equivalent, wave acceleration in the Notch clones was observed in the absence of salt and pepper patterns (orange dotted areas in Fig. 5 B–D). However, when NP was larger relative to EP, salt and pepper patterns appeared in A and N (Fig. 5 C and D), suggesting that the threshold NP required for salt and pepper pattern formation was significantly higher than that for wave speed control. These results are consistent with in vivo observations that the salt and pepper pattern was hardly detectable in WT brains (Fig. 4 A, E, and K).
The salt and pepper patterns appeared when the EP was lower than the NP (Fig. 5 C and D). Interestingly, when EP was decreased, the salt and pepper index of N did not monotonically rise but exhibited a biphasic response (Fig. 5D). For example, when NP = 1.8, N displayed salt and pepper patterns when EP = 1.5 and EP = 0.8 but not when EP = 1.0–1.4 (compare E–G in Fig. 5D). Note that the degree of wave acceleration in N clones monotonically increased with increasing EP (Fig. 5B). Similar phenomena were observed in the other parameter sets (Figs. S2 and S4). These results suggest that wave speed control and salt and pepper pattern formation are both regulated by Notch signaling but by distinct mechanisms. These different mechanisms may underlie the different threshold levels of NP required for salt and pepper pattern formation and wave speed control.
Solving the Paradox of the Notch Mutant Phenotype.
The above results are all consistent with in vivo observations. To further confirm the validity of our model, we determined if the model can solve the paradox of the Notch mutant phenotype. EGF signaling is diminished in clones in which Notch signaling is eliminated in vivo (27). However, if EGF signaling is lost in Notch mutant clones, the wave should be eliminated, because EGF is essential for wave progression. However, the wave is not eliminated; rather, its progression is accelerated in Notch and Dl mutant clones (26, 27).
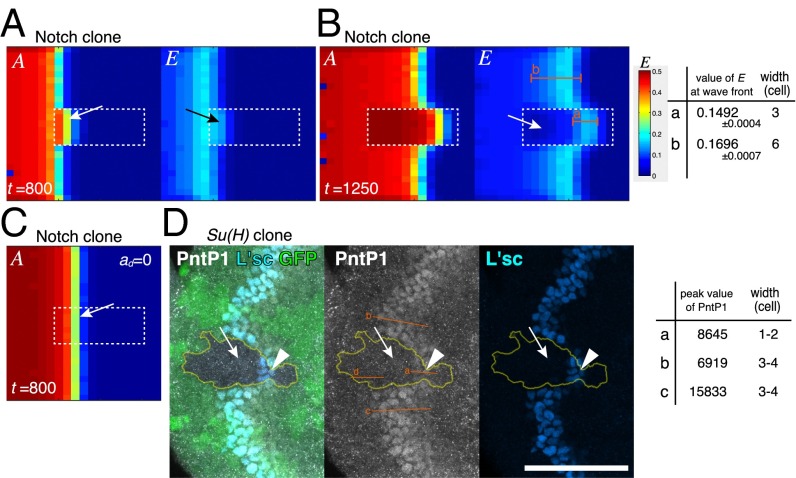
EGF signaling may play a key role in this paradoxical phenotype. The wave acceleration phenotype of the Dl mutant clone is suppressed in a Dl pnt double-mutant clone in vivo (27). Similarly, the wave acceleration in the Dl clone was suppressed in a Dl EGF clone in silico (Fig. 3 F and K), suggesting that EGF plays an essential role in wave acceleration in Notch and Dl mutant clones. Indeed, computer simulation revealed that a significant level of E remained when the wave front encountered a Notch mutant clone (Fig. 6A). However, E was eventually diminished in Notch mutant clones (Fig. 6B). The value of E at the wave front in Notch clones was comparable with that in WT cells (0.1492 in Notch clones and 0.1696 in WT cells; n = 10). However, the width of the EGF active region was significantly reduced (three cells in Notch clones but six cells in WT cells) (Fig. 6B).
Fig. 6.
Wave acceleration mechanism in Notch mutant clone. (A–C) Results of in silico experiments in the absence of the feedbacks (ee = ne = ed = 0). Notch mutant clones are indicated by white dotted lines. (A and B) E is activated when the proneural wave encounters Notch mutant cells (arrows in A) but quickly inactivated (arrow in B). (B) The peak values of E at the wave front and the widths of E activated areas (E > 0.09) are compared along the lines a and b. (C) The wave acceleration in Notch mutant clone is suppressed when ad = 0. (D) PntP1 (white) is transiently up-regulated when proneural wave encounters Su(H) mutant cells (arrowheads; GFP-negative) but eventually down-regulated (arrows). The peak levels of PntP1 and the widths of PntP1-activated areas are compared along the lines a–c. The line d indicates the background level. (Scale bar: 50 μm.)
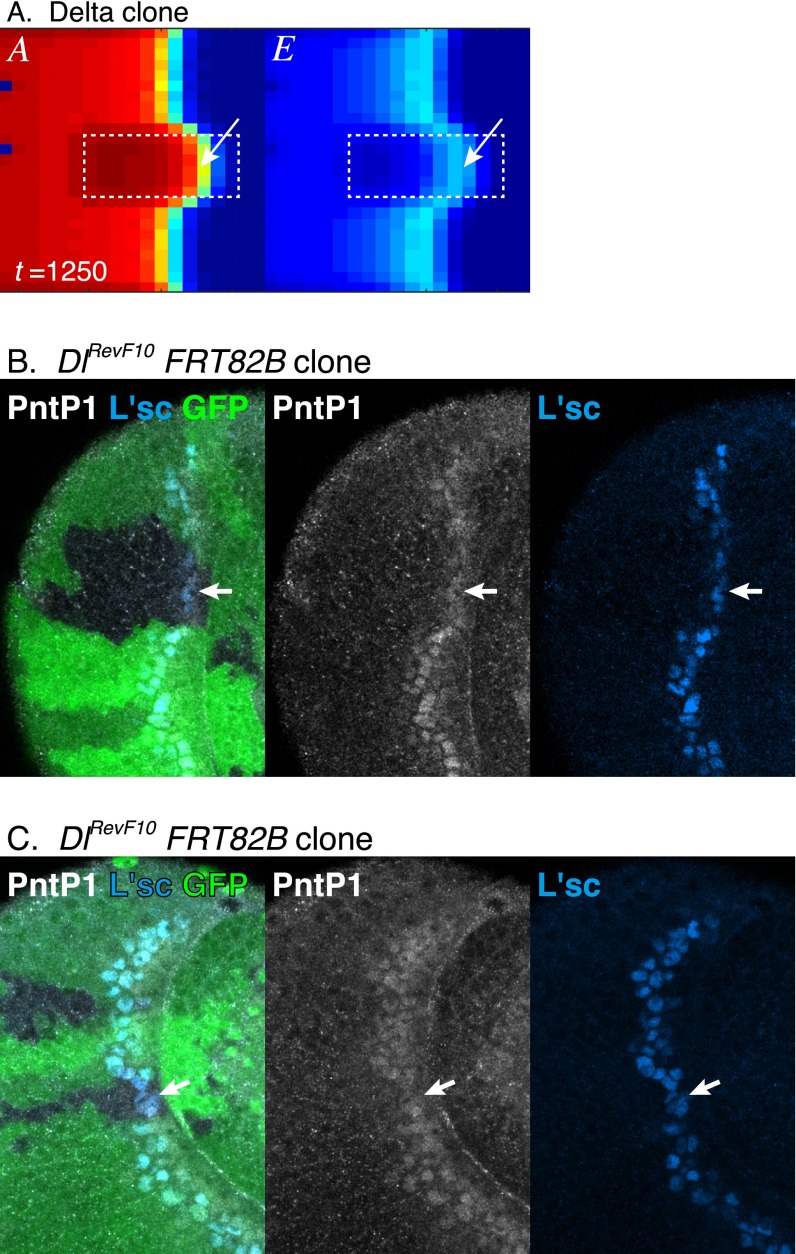
A similar phenomenon was observed in vivo. In Su(H) mutant clones, in which Notch signaling is eliminated, EGF signaling, as revealed by PntP1, remained strong at the wave front and was eventually degraded (Fig. 6D) (n = 18 of 32). Again, the peak value of PntP1 at the wave front in Su(H) clones remained comparable with that of control cells (8,645 in Notch mutant clones but 6,919 or 15,833 in WT cells), whereas the width of the EGF active area was significantly reduced (one to two cells wide in Notch mutant clones but three to four cells wide in WT areas) (Fig. 6D). Similar results were observed in clone mutant for Dl in vivo (Fig. S7). Although N was instantaneously diminished in Notch (and Dl) mutant clones, E remained relatively high for a short period. As a result, the temporal increase in the value of E − N at the wave front caused wave acceleration.
Fig. S7.
Wave acceleration in Dl mutant clone. (A) Wave acceleration in Dl mutant clone in silico (white dotted lines; ee = ne = ed = 0). E is activated at the wave front within Dl mutant cells (arrows) but quickly inactivated. (B and C) In Dl mutant clones in vivo (arrows; GFP-negative), the proneural wave is accelerated as visualized by L’sc (blue). Additionally, EGF signaling as visualized by PntP1 (white) is transiently up-regulated but eventually down-regulated (arrows).
Wave Acceleration and a Neurogenic Phenotype Share the Same Mechanism.
To understand the mechanism of wave acceleration, we searched for conditions under which the wave acceleration was not observed in the presence of a Notch mutant clone. Intriguingly, the wave acceleration phenotype of the Notch clone was significantly suppressed only when ad was set to zero (Fig. 6C). In the absence of this term, the wave was constitutively accelerated (compare Fig. 6 A and C). Consequently, additional acceleration of the wave did not occur, even in the Notch mutant clone. This result suggests that the AS-C input to Dl expression (the term of ad) is significant and responsible for the Notch mutant phenotype. Similarly, the positive regulation of Dl expression by AS-C is particularly important to establish binary cell fates during lateral inhibition, because it is essential for the Notch signaling feedback loop between adjacent cells (Fig. 1A). Thus, the mechanisms responsible for the formation of binary cell fates and the control of wave progression are identical.
In the fly retina, Notch signaling also plays an early proneural function that is required for photoreceptor differentiation prior to the wave progression (21, 22). Although we have never observed similar proneural defects in Notch mutant clones in the course of proneural wave progression, an unidentified function of Notch that is distinct from lateral inhibition could act to restrict the proneural wave progression. Although we cannot exclude this possibility, the above results suggest that the four-component model with Notch-mediated lateral inhibition is essentially consistent with proneural wave progression in silico and in vivo and that the wave acceleration phenotype is equivalent to the classical neurogenic phenotype of Notch mutant clones (2). Although nonlinear regulations of Notch signaling were implemented in the previous models (5, 6, 17–19), the equation for N in the four-component model was sufficient to reproduce all of the experimental conditions described above.
Notch Exhibits a Pulse Wave That Restricts the Speed of Wave Propagation.
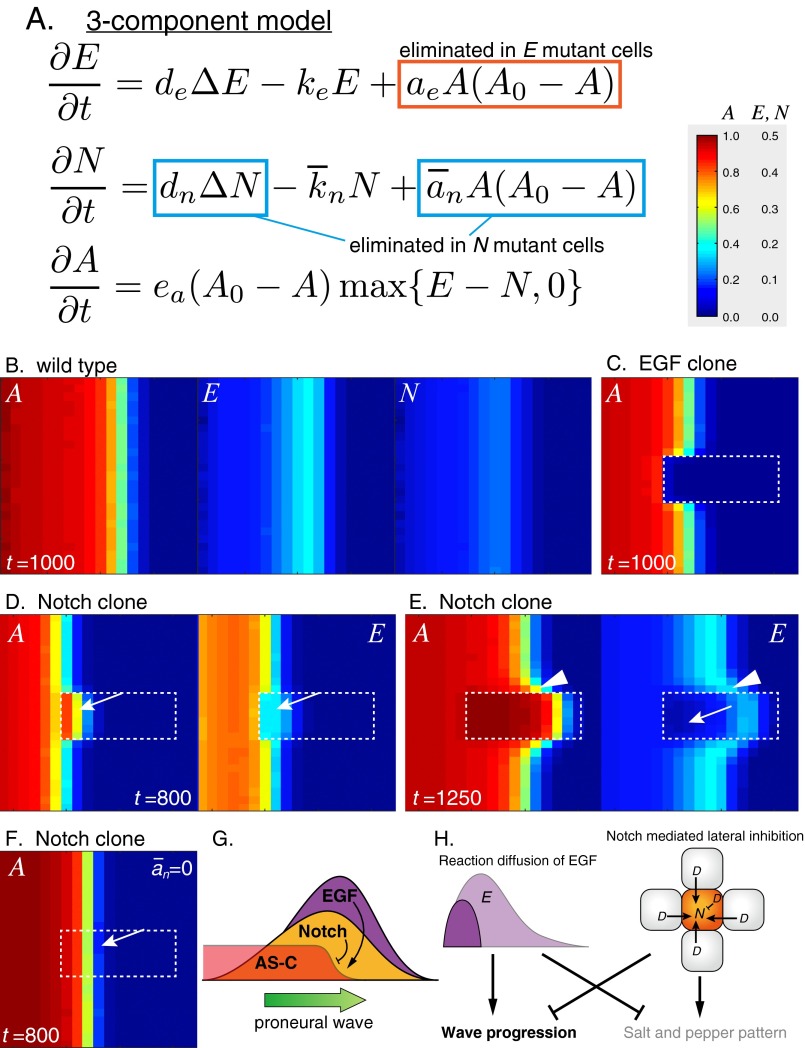
The equations of N and D in the four-component model only describe that they form a part of lateral inhibitory feedback (Fig. 3A). However, it is difficult to envisage how Notch-mediated lateral inhibition, which generally forms a salt and pepper pattern, controls wave propagation. To clarify the system behavior of proneural wave progression, we derived a three-component model from the four-component model by assuming that the Dl expression level is proportional to Notch signaling activity (SI Discussion). The Dl expression level was largely proportional to Notch activity in vivo as indicated by E(spl)mγ-GFP (Fig. 4A). In the resulting three-component model, N is a composite variable for Dl expression and Notch activity. The rate of change in N is influenced by its diffusion (dnΔN), degradation (N), and AS-C [A(A0 − A)] (Fig. S8A). Note that the equation exhibits the same structure as that of E, revealing symmetry between Notch and EGF and suggesting that Notch activity propagates as a pulse wave, similar to EGF signaling. Indeed, the three-component model reproduced the progression of the proneural wave with the pulse waves of E and N, producing their peaks near the wave front (Fig. S8B). Because the three-component model is only mathematically derived from the four-component model, the diffusion term of N does not necessarily indicate that Dl acts as a diffusible factor. Although the diffusion term could correspond to the long-range action of Dl via filopodia (40–42), this cellular extension is not observed in cells at the wave front of the proneural wave.
Fig. S8.
Notch forms a pulse wave. (A) The three-component model. (B–F) Results of in silico experiments visualizing A, N, and E. (B) The WT. (C–F) Mutant clones are surrounded by white dotted lines. (C) EGF mutant clone. (D–F) Notch mutant clones. E is activated when the proneural wave encounters Notch mutant cells (arrows in D) but quickly inactivated (arrow in E). Proneural wave is nonautonomously accelerated (arrowheads in E). (F) The wave acceleration is suppressed when = 0. (G) The pulse waves of EGF and Notch activity positively and negatively controlling the wave progression, respectively. (H) A scheme showing that the reaction diffusion of EGF and Notch-mediated lateral inhibition promote the wave progression and salt and pepper pattern formation, respectively. In contrast, EGF and Notch negatively regulate the salt and pepper pattern formation and wave progression, respectively. When the signals of EGF and Notch are equivalent, the salt and pepper pattern is obscured.
The three-component model reproduced the phenotypes of EGF and Notch mutant clones as well as the four-component model (Fig. S8 C–E). In EGF mutant clones, wave progression and NB differentiation disappeared autonomously (Fig. S8C). Notch mutant clones caused nonautonomous acceleration of the wave progression (Fig. S8E). EGF activity remained high when the wave front came across Notch mutant cells but was eventually diminished, identical to the results obtained using the four-component model (Fig. S8 D and E). Finally, the wave acceleration phenotype of the Notch mutant clones was suppressed when was set to zero (Fig. S8F). Because N is the composite variable for Notch activity and Dl expression, this result is consistent with the above finding that the AS-C input to Dl expression (the term of ad) is responsible for the Notch mutant phenotype in the four-component model (Fig. 6C).
Thus, the essential characteristics of the proneural wave, except the salt and pepper patterns, are conserved in the three-component model, suggesting that the lateral inhibitory feedback of Notch signaling can be approximated by a reaction diffusion equation during proneural wave progression. The incorporation of EGF-mediated reaction diffusion in Notch-mediated lateral inhibition enables a unique behavior of Notch signaling that is approximated by a pulse wave negatively regulating the speed of proneural wave propagation (Fig. S8 G and H).
SI Results
Hexagonal Grid Model.
A hexagonal grid model was used to test the effects of cell arrangement. In the square grid model, the distance between neighboring cells was equal to the cell size (dx = 2) (Fig. S5A). Similarly, the distance between neighboring cells was 2 (dx = 2) in the hexagonal model (Fig. S5B). All of the parameters and calculations were essentially the same as the square model except for the terms that are affected by the cell arrangement, such as the diffusion of E and the transactivation of N. These terms were modified as follows to make the hexagonal model equivalent to the square model.
Diffusion of E.
Square:
and hexagonal:
Here, the value of E in the central cell is E0, and those of the adjacent cells are E1 ∼ E6 (Fig. S5 A and B). The diffusion constants of E are des and deh in the square and hexagonal models, respectively. If we consider that E1 ∼ E6 = a and E0 = b, square:
and hexagonal:
To make these two diffusion terms equivalent, deh has to be 2/3 of des. Thus, the value of de in the hexagonal model was two-thirds of that in the square model (de = 0.67).
Transactivation of N.
D expression in a cell is split into four and six edges of a cell to activate N in an adjacent cell in the square and hexagonal models, respectively. Thus, the value of dt in the hexagonal model was two-thirds of that in the square model in Fig. S5.
The proneural wave progression in the WT and the presence of mutant clones was calculated by using the hexagonal model (Fig. S5C). The diffusion of E and transactivation of N were two-thirds of the square model (de = 0.67 and dt = 0.17). The feedbacks were ignored (ee = ne = ed = 0). Essentially, the same results were obtained in the square and hexagonal models (compare Fig. 3 G–K with Fig. S5C).
We subsequently examined (i) speed of wave progression, (ii) acceleration of the wave in Notch clones, (iii) salt and pepper index of A (SD of A at the wave front), and (iv) salt and pepper index of N (SD of N at the wave front) under various parameter conditions using the hexagonal model (Fig. S5 D–G). All parameters related to Notch and EGF productions were proportionally changed according to NP and EP, respectively (dt = 0.17 × NP, dc = 0.25 × NP, and ae = EP). The feedbacks were ignored (ee = ne = ed = 0).
Acceleration of the wave in Notch clones was observed for a wide range of EP and NP values (Fig. S5E), whereas salt and pepper patterns in A and N were observed when NP was larger than EP (Fig. S5 F and G). Therefore, when EP and NP were roughly equivalent, wave acceleration in Notch clones was observed in the absence of salt and pepper patterns (orange dotted areas in Fig. S5 E–G). These results are consistent with the results of the square model (Fig. 5 A–D).
When NP is significantly larger than EP in the upper left regions of the diagrams in Fig. S5 D–G, the results of hexagonal model seem very different from those of the square model (Fig. 5 A–D). However, these differences are most likely caused by the criteria used to estimate the speed of wave progression, acceleration of wave in N clone, and SDs of A and N at the wave front (Fig. S5 D–G). When NP is significantly larger than EP, A and N show striped patterns, which produce groups of cells in which A = N = 0 (Fig. S5 D, J, K). Note that the wave is progressing in Fig. S5 J–K. However, because of the gaps between differentiating cells, the speed of the wave progression is regarded as zero (Fig. S5 D, J, and K). Similarly, the acceleration of wave in N clone reflects the difference between the maximum values of A in Notch clone and WT cells at the central area (Fig. S5E). Because of the gaps among differentiating cells in the area of WT cells, the wave acceleration tends to be overestimated (Fig. S5 E and L).
In the case of the square model, the SDs of A and N at the wave front were regarded as the salt and pepper indexes of A and N. However, in the hexagonal model, cells with the same x-axis value are displaced along the x axis when the y-axis value is an even number. These displaced cells behave very differently from the nondisplaced cells in which y-axis value is an odd number. As a result, the SDs of A and N along the wave front would be overestimated. To avoid this problem, we used the SDs of A and N at the wave front in cells in which the y-axis value is an odd number. However, because of the gaps between differentiating cells, these values tend to be underestimated. In Fig. S5 J and K, the values of A and N show the salt and pepper patterns. However, the SDs of A and N are regarded as zero in Fig. S5 F and G. Thus, the results of the square and hexagonal models are essentially the same, except for these superficial differences.
SI Discussion
We now derive a three-component model from the four-component model under the following three assumptions.
-
i)
The order of the time variation in is , and the remaining variables are of the order 1 ().
-
ii)
The distance between adjacent cell center is .
-
iii)
Cells are assumed to be squares, which form a mesh like that shown in Fig. 1B.
For variables and in the four-component model, we write
By use of the small time constant from assumption i, the four-component model is written as follows:
| [S1] |
Using assumptions ii and iii, the second equation of Eq. S1 becomes
| [S2] |
Hence, Eq. S2 can be rewritten:
| [S3] |
Formally taking ε tends to zero, we obtain
| [S4] |
| [S5] |
Using the singular perturbation method, when ε tends to 0, if , then the following relation equation is obtained:
| [S6] |
Here, we write as follows:
| [S7] |
By use of Eq. S6 and expression S7, ε tends to zero for Eq. S5, and then, the following equations are obtained:
| [S8] |
From the second and third equations of Eq. S8, we obtain
| [S9] |
From Eq. S6, if ,
| [S10] |
When we substitute Eq. S10 for Eq. S9,
| [S11] |
Then,
| [S12] |
where
| [S13] |
Using Eq. S12, we obtain the following equations:
| [S14] |
From , all coefficients of Eq. S14 are positive; then, the three-component model is derived.
Now, we only assume the proportional Eq. S6 in place of assumptions i–iii. Then, the four-component model is written as follows:
| [S15] |
Using Eq. S6, the following equations are obtained from Eq. S15:
| [S16] |
From the second and third equations of Eq. S16, we obtain
| [S17] |
From Eq. S6, if ,
| [S18] |
When we substitute Eq. S18 for Eq. S17,
| [S19] |
where parameters , and are the same as in Eq. S13, except . Therefore, when we assume the proportional Eq. S6 with the condition , the following discrete three-component model is derived:
| [S20] |
Moreover, we add assumptions ii and iii, and
| [S21] |
Then, the second equation of Eq. S20 is
| [S22] |
where
| [S23] |
Formally taking that ε tends to zero by use of assumptions ii and iii, the following continuous three-component model is derived from S4:
| [S24] |
where
| [S25] |
Discussion
Notch-mediated lateral inhibition plays essential roles in specifying differentiated cells from undifferentiated cells in a wide variety of developmental processes and induces the formation of a salt and pepper pattern via binary cell fate decisions. During proneural wave progression, EGF is produced at the wave front to suppress the formation of a salt and pepper pattern. Indeed, salt and pepper patterns are hardly detectable in the WT fly brain when regular GFP is used to detect Notch activity (Fig. 4E). Similar mathematical models describing the combinatorial action of Notch and a diffusible factor reproduce the patterns observed in retinal development (17–20). In these studies, differentiated neurons exhibit obvious salt and pepper patterns.
In our system, a part of the lateral inhibition system also controlled the sequential progression of differentiation. In contrast to the obscured salt and pepper pattern in the proneural wave, Notch mutant clones obviously exhibited a wave acceleration phenotype (26, 27). Thus, Notch-mediated lateral inhibition controls the proneural wave progression speed without exhibiting a salt and pepper pattern. In this study, we showed that the wave speed control and salt and pepper pattern formation required distinct threshold levels of Notch signaling activity (Fig. 5). When the NP and EP were approximately equal, the salt and pepper pattern was obscured. However, when the EP was reduced relative to the NP, the salt and pepper pattern became obvious. Consistent with this result, decreasing EGF production enhanced the salt and pepper pattern in vivo (Fig. 4 E–G and J–Q), showing that the fly brain indeed uses Notch-mediated lateral inhibition to control proneural wave progression. Although the final patterns are distinct, the proneural wave and retinal wave share the same mechanism to regulate the salt and pepper pattern formation.
As discussed above, however, wave speed control and salt and pepper pattern formations have distinct response to relative Notch activity. Surprisingly, salt and pepper pattern formation exhibited a biphasic response to the changes in the EP relative to the NP (Fig. 5). These results suggest that Notch regulates wave speed and salt and pepper pattern formation by distinct mechanisms. We do not yet understand exactly how Notch controls salt and pepper patterns during proneural wave progression. However, it is intriguing that N exhibits striped as well as salt and pepper patterns (Fig. 5 E–G). When EP was higher (EP = 1.5), N exhibited a rather uniform salt and pepper pattern (Fig. 5E). When EP was reduced to 1.1, the salt and pepper pattern was rather obscured, but a striped pattern became obvious (Fig. 5F). When EP = 0.8, N exhibited both striped and salt and pepper patterns simultaneously (Fig. 5G). The value of A also exhibited both striped and salt and pepper patterns (Fig. 5 E–G). Similar striped pattern was observed in the hexagonal grid model (Fig. S5 I–K).
Intriguingly, a striped pattern was observed in a model of the retinal differentiation wave and in vivo genetic experiments (18). Notch-mediated lateral inhibition seems to form both salt and pepper and striped patterns depending on parameter values in both previous nonlinear models (18) and our semilinear model. Our model further suggests that the formation of a striped pattern requires a higher threshold level of relative Notch activity. In the presence of a striped pattern, the salt and pepper index is reduced, because the value of N along the wave front becomes similar within the striped patterns (Fig. 5 D and F). Consequently, the salt and pepper index exhibits a biphasic response to the changes in relative Notch activity. Unfortunately, we have never observed the striped pattern in the proneural wave in vivo. The formation of striped pattern may be suppressed by unidentified mechanisms in the medulla, or special experimental conditions might be required to reproduce the striped pattern in vivo.
Notch signaling plays diverse roles when combined with other signaling systems (8–10). When these signaling systems have complex feedbacks and show oscillatory or propagating behavior, the exact mechanisms by which the system behavior is regulated cannot be established without formulating mathematical models. In the developing cerebral cortex, the oscillatory behavior of Notch signaling in neural progenitor cells is important for cell fate determination (43). During this process, Notch signaling seems to form lateral inhibitory feedback, a role similar to that observed in the proneural wave. Additionally, the combinatorial action of Notch and EGF signaling controls the maintenance of neural stem cells and neural progenitor cells (44). Similarly, vertebrate segmentation is controlled by the interplay between Notch and FGF (11). Notch signaling controls the synchronization between neighboring cells and positively regulates boundary formation by activating Mesp2. By contrast, Notch-mediated lateral inhibition causes desynchronization of cell differentiation between neighboring cells and negatively regulates NB formation during the proneural wave. Thus, the roles of Notch signaling in vertebrate segmentation seem to be opposite those observed in the proneural wave.
Finally, the behavior of the differentiation wave observed in the retina is similar to that of the proneural wave. Although the wave in the retina clearly accompanies the salt and pepper pattern, all NE cells are differentiated to NBs behind the proneural wave without exhibiting a salt and pepper pattern. By formulating mathematical models of the proneural wave based on biological evidence, we have shown that the combination of Notch-mediated lateral inhibition and EGF-mediated reaction diffusion reproduces the behavior of the proneural wave. Comparative analysis of the mathematical structures of these two systems may provide fruitful insights on the roles of Notch signaling during differentiation wave control. Future studies should include comparative analyses of the interplay between Notch and other signaling systems in a wide variety of biological processes in vivo and in silico.
Methods
Mathematical Modeling.
The differential equations were calculated using the explicit finite difference method with the zero flux boundary condition. In the square grid model, the mesh size was equal to the cell size (dx = 2), and the time step size was 0.01 (dt = 0.01). Note that the minimal length of a side of an NE is ∼2 µm in vivo. Details of the hexagonal grid model are described in SI Results. For 25 × 25 cells, the initial conditions for A, E, and D in the anterior-most cells (x = 1, 2, and 3, respectively) were A = 0.90, 0.31, and 0.02, respectively; E = 0.054, 0.021, and 0.0016, respectively; and D = 0.062, 0.021, and 0.0013, respectively, to stabilize the proneural wave progression. The initial condition of N was zero in all cells. Gaussian noise was added to 10% of the difference of all variables in each iteration by multiplying 1 + 0.1 × θ (θ is Gaussian noise with mean = 0 and SD = 1).
The four-component model contains four equations and four variables (Fig. 3A). E and N represent EGF and Notch signaling, respectively. D and A represent the expression levels of Dl and AS-C, respectively. Notch receptor expression level is constant; de is the diffusion coefficient of EGF, and dt and dc represent the trans-activation and cis-inhibition of Notch signaling by Dl, respectively. Additionally, i,l and j,m are integers indicating the location of a cell along the x and y axes, respectively, and l and m indicate the location of four cells that are adjacent to a cell indicated by i and j. The diffusion of E was calculated as follows: deΔE(i,j) = de{E(i + 1,j) + E(I − 1,j) + E(i,j + 1) + E(i,j − 1) − 4E(i,j)}/dx2; ke, kn, and kd are the degradation rate constants of EGF, Notch, and Dl, respectively, and ee, ne, and ed reflect EGF regulation by EGF, EGF regulation by Notch, and Dl regulation by EGF, respectively (ee = 0.2 and ne = ed = 1). EGF does not directly regulate Notch signaling in this model; ae and ad indicate EGF and Dl regulation by AS-C, respectively. A0 sets the maximum value for A. When A = A0, the cells are fully differentiated as NBs. A0 is always set to one; ea reflects the regulation of differentiation by EGF and Notch and is set to 10 unless otherwise noted. The other parameters are set to one unless otherwise noted. We set ee = ne = ae = 0, dt = dc = 0, and ed = ad = 0 in EGF, Notch, and Dl mutant clones, respectively, in 11 × 6 cells in the central area (Fig. 3A). The values of E in Notch mutant and control areas were compared in Fig. 6B (a: y = 13; b: y = 21). The widths of areas with E above the threshold value (0.09) were counted.
A wide range of parameter sets was examined in Fig. 5 and Figs. S2 and S4 in the presence of Notch mutant clone. Here, NP and EP vary from 0.0 to 2.0 by 0.1. All parameters related to Notch and EGF productions were proportionally changed according to NP and EP, respectively (ne = ae = EP, ee = 0.2 × EP, and dt = dc = 0.25 × NP). For each parameter set, the same in silico experiments were repeated 10 times, and the averages are shown; 4,999 iterations were calculated for each experiment. When T is the time at which the wave front of WT cells (A > 0.5) reaches the central area (x = 13), “speed of wave progression” is defined as 4,999/T − 1. T = 4,999 in cases where the wave front does not reach the central area after 4,999 iterations (speed of wave progression becomes zero). At the time of T, “acceleration of wave in N clone” is defined as the difference between the maximum values of A in Notch clone (y = ∼11–14) and WT cells (y = ∼3–7 and ∼18–22) at the central area (x = 13). At the same time, “salt and pepper index of A” and “salt and pepper index of N” were defined as SDs of A and N at the wave front of WT cells (x = 13; y = ∼3–7 and ∼18–22).
The three-component model was derived from the four-component model and contains three equations and three variables (Fig. S8A and SI Discussion). N is the composite variable for Notch signaling and Dl expression; dn represents the diffusion coefficients of Notch signaling. The diffusion of E and N was calculated as described for E in the four-component model. According to SI Discussion, dn, , and are set to 0.571, 0.571, and 0.429, respectively. We set ae = 0 and dn = = 0 in EGF and Notch mutant clones, respectively, in 11 × 6 cells in the central area (Fig. S8A).
Fly Strains.
Flies were raised at 25 °C unless otherwise noted. The following mutant and transgenic flies were used: UAS-Nact, Df(1)260–1 FRT19A, Su(H)Δ47 FRT40A, da10 FRT40A, rhoPΔ5, DlRevF10 FRT82B, pntΔ88 FRT82B, E(spl)mγ-GFP (36), NRE-dVenus (39), hs-flp, act-Gal4 UAS-GFP, tub-Gal80 FRT82B, FRT2A-FRT82B, ubi-GFP FRT19A, ubi-GFP FRT40A, and ubi-GFP FRT82B. Mutant clones were generated by crossing hs-flp; act-Gal4 UAS-GFP; tub-Gal80 FRT82B with UAS-Nact; FRT2A-FRT82B or UAS-Nact; pntΔ88 FRT82B, Df(1)260–1 FRT19A with ubi-GFP FRT19A; hs-flp, hs-flp; ubi-GFP FRT40A with da10 FRT40A or Su(H)Δ47 FRT40A, and hs-flp; ubi-GFP FRT82B with DlRevF10 FRT82B. EGF signaling was reduced by crossing UAS-pntRNAiJF02227, UAS-pntRNAiHMS01452, or UAS-RasN17 with optix-Gal4 (35).
Histochemistry.
The following antibodies were used: mouse anti-Dl (1:100; DSHB), rat anti-Dpn (1:50; Abcam), guinea pig anti-L'sc (1:1,200) (35), and rabbit anti-PntP1 (1:200; James Skeath) antibodies. The following secondary antibodies were used: Cy3-conjugated donkey anti-mouse, Alexa546-conjugated goat anti-rabbit, and Alexa647-conjugated donkey anti-guinea pig antibodies.
Image Analysis.
Confocal images were obtained by Zeiss LSM510 or LSM880 and processed with ZEN software, Adobe Photoshop, and ImageJ. The Dl and GFP expression levels along the arrows in Fig. 2 A and B were quantified by using ZEN software. To compare the salt and pepper patterns of L'sc in Fig. 4 J and K, the mean distances between L'sc-positive cells were quantified. Single optical sections showing the greatest number of L'sc-expressing cells were manually selected at the lateral regions of the optic lobe using ZEN. Cells strongly expressing L'sc above a threshold value (100 of 256) were regarded as L'sc-positive cells. The cell shape and the center of mass of L'sc-positive cells were determined according to the distribution patterns of membrane-bound CD8GFP and L'sc. For each of the L'sc-positive cells, the distance to the closest L'sc-positive cell were quantified by using ImageJ. In Fig. 6D, PntP1 expression levels were quantified by using ImageJ along multiple lines nearby and parallel to the orange lines indicated and subtracting a threshold value (13,500 of 65,536) according to the background data along the line d.
Supplementary Material
Acknowledgments
We thank Rie Takayama and members of the laboratory of M.S. for supporting fly work; S. Ei for helpful discussion; R. Kageyama, S. Hayashi, T. Hayashi T. Tabata, D. Umetsu, and K. Uriu for critical comments; and S. Bray, J. Skeath, T. Tabata, Bloomington Drosophila Stock Center, Drosophila Genetic Resource Center, Kyoto, and Developmental Studies Hybridoma Bank for flies and antibodies. This work was supported by Precursory Research for Embryonic Science and Technology from Japan Science and Technology Agency (JST), a Grant-in-Aid for Scientific Research on Innovative Areas and a Grant-in-Aid for Scientific Research (B) from Ministry of Education, Culture, Sports, Science, and Technology, the Sekisui Chemical Grant Program, the Asahi Glass Foundation (M.S.), Core Research for Evolutional Science and Technology from JST, and Cooperative Research of “Network Joint Research Center for Materials and Devices” (M.S., T.M., and M.N.).
Footnotes
The authors declare no conflict of interest.
This article is a PNAS Direct Submission.
This article contains supporting information online at www.pnas.org/lookup/suppl/doi:10.1073/pnas.1602739113/-/DCSupplemental.
References
- 1.Artavanis-Tsakonas S, Rand MD, Lake RJ. Notch signaling: Cell fate control and signal integration in development. Science. 1999;284(5415):770–776. doi: 10.1126/science.284.5415.770. [DOI] [PubMed] [Google Scholar]
- 2.Simpson P. Lateral inhibition and the development of the sensory bristles of the adult peripheral nervous system of Drosophila. Development. 1990;109(3):509–519. doi: 10.1242/dev.109.3.509. [DOI] [PubMed] [Google Scholar]
- 3.Kunisch M, Haenlin M, Campos-Ortega JA. Lateral inhibition mediated by the Drosophila neurogenic gene delta is enhanced by proneural proteins. Proc Natl Acad Sci USA. 1994;91(21):10139–10143. doi: 10.1073/pnas.91.21.10139. [DOI] [PMC free article] [PubMed] [Google Scholar]
- 4.del Álamo D, Rouault H, Schweisguth F. Mechanism and significance of cis-inhibition in Notch signalling. Curr Biol. 2011;21(1):R40–R47. doi: 10.1016/j.cub.2010.10.034. [DOI] [PubMed] [Google Scholar]
- 5.Sprinzak D, et al. Cis-interactions between Notch and Delta generate mutually exclusive signalling states. Nature. 2010;465(7294):86–90. doi: 10.1038/nature08959. [DOI] [PMC free article] [PubMed] [Google Scholar]
- 6.Collier JR, Monk NA, Maini PK, Lewis JH. Pattern formation by lateral inhibition with feedback: A mathematical model of delta-notch intercellular signalling. J Theor Biol. 1996;183(4):429–446. doi: 10.1006/jtbi.1996.0233. [DOI] [PubMed] [Google Scholar]
- 7.Shaya O, Sprinzak D. From Notch signaling to fine-grained patterning: Modeling meets experiments. Curr Opin Genet Dev. 2011;21(6):732–739. doi: 10.1016/j.gde.2011.07.007. [DOI] [PubMed] [Google Scholar]
- 8.Doroquez DB, Rebay I. Signal integration during development: Mechanisms of EGFR and Notch pathway function and cross-talk. Crit Rev Biochem Mol Biol. 2006;41(6):339–385. doi: 10.1080/10409230600914344. [DOI] [PubMed] [Google Scholar]
- 9.Dutt A, Canevascini S, Froehli-Hoier E, Hajnal A. EGF signal propagation during C. elegans vulval development mediated by ROM-1 rhomboid. PLoS Biol. 2004;2(11):e334. doi: 10.1371/journal.pbio.0020334. [DOI] [PMC free article] [PubMed] [Google Scholar]
- 10.Sundaram MV. The love-hate relationship between Ras and Notch. Genes Dev. 2005;19(16):1825–1839. doi: 10.1101/gad.1330605. [DOI] [PubMed] [Google Scholar]
- 11.Kageyama R, Niwa Y, Isomura A, González A, Harima Y. Oscillatory gene expression and somitogenesis. Wiley Interdiscip Rev Dev Biol. 2012;1(5):629–641. doi: 10.1002/wdev.46. [DOI] [PubMed] [Google Scholar]
- 12.Kulesa PM, Schnell S, Rudloff S, Baker RE, Maini PK. From segment to somite: Segmentation to epithelialization analyzed within quantitative frameworks. Dev Dyn. 2007;236(6):1392–1402. doi: 10.1002/dvdy.21199. [DOI] [PMC free article] [PubMed] [Google Scholar]
- 13.Heberlein U, Wolff T, Rubin GM. The TGF beta homolog dpp and the segment polarity gene hedgehog are required for propagation of a morphogenetic wave in the Drosophila retina. Cell. 1993;75(5):913–926. doi: 10.1016/0092-8674(93)90535-x. [DOI] [PubMed] [Google Scholar]
- 14.Ma C, Zhou Y, Beachy PA, Moses K. The segment polarity gene hedgehog is required for progression of the morphogenetic furrow in the developing Drosophila eye. Cell. 1993;75(5):927–938. doi: 10.1016/0092-8674(93)90536-y. [DOI] [PubMed] [Google Scholar]
- 15.Neumann CJ, Nuesslein-Volhard C. Patterning of the zebrafish retina by a wave of sonic hedgehog activity. Science. 2000;289(5487):2137–2139. doi: 10.1126/science.289.5487.2137. [DOI] [PubMed] [Google Scholar]
- 16.Yang HJ, Silva AO, Koyano-Nakagawa N, McLoon SC. Progenitor cell maturation in the developing vertebrate retina. Dev Dyn. 2009;238(11):2823–2836. doi: 10.1002/dvdy.22116. [DOI] [PubMed] [Google Scholar]
- 17.Formosa-Jordan P, Ibañes M, Ares S, Frade JM. Regulation of neuronal differentiation at the neurogenic wavefront. Development. 2012;139(13):2321–2329. doi: 10.1242/dev.076406. [DOI] [PubMed] [Google Scholar]
- 18.Lubensky DK, Pennington MW, Shraiman BI, Baker NE. A dynamical model of ommatidial crystal formation. Proc Natl Acad Sci USA. 2011;108(27):11145–11150. doi: 10.1073/pnas.1015302108. [DOI] [PMC free article] [PubMed] [Google Scholar]
- 19.Pennington MW, Lubensky DK. Switch and template pattern formation in a discrete reaction-diffusion system inspired by the Drosophila eye. Eur Phys J E Soft Matter. 2010;33(2):129–148. doi: 10.1140/epje/i2010-10647-6. [DOI] [PMC free article] [PubMed] [Google Scholar]
- 20.Gavish A, et al. Periodic patterning of the Drosophila eye is stabilized by the diffusible activator Scabrous. Nat Commun. 2016;7:10461. doi: 10.1038/ncomms10461. [DOI] [PMC free article] [PubMed] [Google Scholar]
- 21.Baonza A, Freeman M. Notch signalling and the initiation of neural development in the Drosophila eye. Development. 2001;128(20):3889–3898. doi: 10.1242/dev.128.20.3889. [DOI] [PubMed] [Google Scholar]
- 22.Baker NE, Yu SY. Proneural function of neurogenic genes in the developing Drosophila eye. Curr Biol. 1997;7(2):122–132. doi: 10.1016/s0960-9822(06)00056-x. [DOI] [PubMed] [Google Scholar]
- 23.Sato M, Suzuki T, Nakai Y. Waves of differentiation in the fly visual system. Dev Biol. 2013;380(1):1–11. doi: 10.1016/j.ydbio.2013.04.007. [DOI] [PubMed] [Google Scholar]
- 24.Yasugi T, Umetsu D, Murakami S, Sato M, Tabata T. Drosophila optic lobe neuroblasts triggered by a wave of proneural gene expression that is negatively regulated by JAK/STAT. Development. 2008;135(8):1471–1480. doi: 10.1242/dev.019117. [DOI] [PubMed] [Google Scholar]
- 25.Egger B, Gold KS, Brand AH. Notch regulates the switch from symmetric to asymmetric neural stem cell division in the Drosophila optic lobe. Development. 2010;137(18):2981–2987. doi: 10.1242/dev.051250. [DOI] [PMC free article] [PubMed] [Google Scholar]
- 26.Reddy BV, Rauskolb C, Irvine KD. Influence of fat-hippo and notch signaling on the proliferation and differentiation of Drosophila optic neuroepithelia. Development. 2010;137(14):2397–2408. doi: 10.1242/dev.050013. [DOI] [PMC free article] [PubMed] [Google Scholar]
- 27.Yasugi T, Sugie A, Umetsu D, Tabata T. Coordinated sequential action of EGFR and Notch signaling pathways regulates proneural wave progression in the Drosophila optic lobe. Development. 2010;137(19):3193–3203. doi: 10.1242/dev.048058. [DOI] [PubMed] [Google Scholar]
- 28.Kawamori H, Tai M, Sato M, Yasugi T, Tabata T. Fat/Hippo pathway regulates the progress of neural differentiation signaling in the Drosophila optic lobe. Dev Growth Differ. 2011;53(5):653–667. doi: 10.1111/j.1440-169X.2011.01279.x. [DOI] [PubMed] [Google Scholar]
- 29.Wolff T, Ready DF. Pattern formation in the Drosophila retina. In: Bate M, Martinez-Arias A, editors. The Development of Drosophila melanogaster. Cold Spring Harbor Lab Press; Plainview, NY: 1993. pp. 1363–1491. [Google Scholar]
- 30.Orihara-Ono M, Toriya M, Nakao K, Okano H. Downregulation of Notch mediates the seamless transition of individual Drosophila neuroepithelial progenitors into optic medullar neuroblasts during prolonged G1. Dev Biol. 2011;351(1):163–175. doi: 10.1016/j.ydbio.2010.12.044. [DOI] [PubMed] [Google Scholar]
- 31.Weng M, Haenfler JM, Lee CY. Changes in Notch signaling coordinates maintenance and differentiation of the Drosophila larval optic lobe neuroepithelia. Dev Neurobiol. 2012;72(11):1376–1390. doi: 10.1002/dneu.20995. [DOI] [PMC free article] [PubMed] [Google Scholar]
- 32.Tsuda L, Nagaraj R, Zipursky SL, Banerjee U. An EGFR/Ebi/Sno pathway promotes delta expression by inactivating Su(H)/SMRTER repression during inductive notch signaling. Cell. 2002;110(5):625–637. doi: 10.1016/s0092-8674(02)00875-9. [DOI] [PubMed] [Google Scholar]
- 33.Egger B, Boone JQ, Stevens NR, Brand AH, Doe CQ. Regulation of spindle orientation and neural stem cell fate in the Drosophila optic lobe. Neural Dev. 2007;2:1. doi: 10.1186/1749-8104-2-1. [DOI] [PMC free article] [PubMed] [Google Scholar]
- 34.Li X, et al. Temporal patterning of Drosophila medulla neuroblasts controls neural fates. Nature. 2013;498(7455):456–462. doi: 10.1038/nature12319. [DOI] [PMC free article] [PubMed] [Google Scholar]
- 35.Suzuki T, Kaido M, Takayama R, Sato M. A temporal mechanism that produces neuronal diversity in the Drosophila visual center. Dev Biol. 2013;380(1):12–24. doi: 10.1016/j.ydbio.2013.05.002. [DOI] [PubMed] [Google Scholar]
- 36.Almeida MS, Bray SJ. Regulation of post-embryonic neuroblasts by Drosophila Grainyhead. Mech Dev. 2005;122(12):1282–1293. doi: 10.1016/j.mod.2005.08.004. [DOI] [PubMed] [Google Scholar]
- 37.Barad O, Rosin D, Hornstein E, Barkai N. Error minimization in lateral inhibition circuits. Sci Signal. 2010;3(129):ra51. doi: 10.1126/scisignal.2000857. [DOI] [PubMed] [Google Scholar]
- 38.Urban S, Lee JR, Freeman M. Drosophila rhomboid-1 defines a family of putative intramembrane serine proteases. Cell. 2001;107(2):173–182. doi: 10.1016/s0092-8674(01)00525-6. [DOI] [PubMed] [Google Scholar]
- 39.Housden BE, Millen K, Bray SJ. drosophila reporter vectors compatible with Φc31 integrase transgenesis techniques and their use to generate new notch reporter fly lines. G3 (Bethesda) 2012;2(1):79–82. doi: 10.1534/g3.111.001321. [DOI] [PMC free article] [PubMed] [Google Scholar]
- 40.Cohen M, Georgiou M, Stevenson NL, Miodownik M, Baum B. Dynamic filopodia transmit intermittent Delta-Notch signaling to drive pattern refinement during lateral inhibition. Dev Cell. 2010;19(1):78–89. doi: 10.1016/j.devcel.2010.06.006. [DOI] [PubMed] [Google Scholar]
- 41.De Joussineau C, et al. Delta-promoted filopodia mediate long-range lateral inhibition in Drosophila. Nature. 2003;426(6966):555–559. doi: 10.1038/nature02157. [DOI] [PubMed] [Google Scholar]
- 42.Hamada H, et al. Involvement of Delta/Notch signaling in zebrafish adult pigment stripe patterning. Development. 2014;141(2):318–324. doi: 10.1242/dev.099804. [DOI] [PMC free article] [PubMed] [Google Scholar]
- 43.Imayoshi I, et al. Oscillatory control of factors determining multipotency and fate in mouse neural progenitors. Science. 2013;342(6163):1203–1208. doi: 10.1126/science.1242366. [DOI] [PubMed] [Google Scholar]
- 44.Aguirre A, Rubio ME, Gallo V. Notch and EGFR pathway interaction regulates neural stem cell number and self-renewal. Nature. 2010;467(7313):323–327. doi: 10.1038/nature09347. [DOI] [PMC free article] [PubMed] [Google Scholar]
Associated Data
This section collects any data citations, data availability statements, or supplementary materials included in this article.


