

Bent et al. show that endothelial production of IL-6 promotes chemoresistance, and doxorubicin induces acute IL-6 release through reactive oxygen species-mediated p38 activation. Endothelial cells repress senescence-associated inflammation through the downregulation of PI3K/AKT/mTOR signaling, and reactivation of this pathway restores senescence-associated inflammation.
Keywords: tumor microenvironment, chemoresistance, paracrine, senescence, endothelial cell, SASP
Abstract
Cancer therapy targets malignant cells that are surrounded by a diverse complement of nonmalignant stromal cells. Therapy-induced damage of normal cells can alter the tumor microenvironment, causing cellular senescence and activating cancer-promoting inflammation. However, how these damage responses are regulated (both induced and resolved) to preserve tissue homeostasis and prevent chronic inflammation is poorly understood. Here, we detail an acute chemotherapy-induced secretory response that is self-limiting in vitro and in vivo despite the induction of cellular senescence. We used tissue-specific knockout mice to demonstrate that endothelial production of the proinflammatory cytokine IL-6 promotes chemoresistance and show that the chemotherapeutic doxorubicin induces acute IL-6 release through reactive oxygen species-mediated p38 activation in vitro. Doxorubicin causes endothelial senescence but, surprisingly, without a typical senescence secretory response. We found that endothelial cells repress senescence-associated inflammation through the down-regulation of PI3K/AKT/mTOR signaling and that reactivation of this pathway restores senescence-associated inflammation. Thus, we describe a mechanism by which damage-associated paracrine secretory responses are restrained to preserve tissue homeostasis and prevent chronic inflammation.
Cancer arises in the context of diverse nonmalignant and malignant cell types that make up the tumor microenvironment. Despite recent advances, the treatment of patients with cancer remains a major challenge, with the majority of patients who have nonlocal disease ultimately relapsing on current therapies (Longley and Johnston 2005). It is increasingly clear that nonmalignant stromal cells not only play a role in cancer progression but also contribute to therapeutic resistance (Meads et al. 2009; Hanahan and Weinberg 2011; Klemm and Joyce 2015). Cytokines and growth factors produced by cells in the tumor microenvironment can promote chemoresistance (Gilbert and Hemann 2010; Sun et al. 2012), and gene expression signatures predictive of survival indicate a strong stromal influence on therapeutic response in human cancer (Lenz et al. 2008; Calon et al. 2015), suggesting that the microenvironment represents a promising therapeutic target.
Systemic chemotherapy induces damage in both cancer and normal cells. During inflammation associated with sterile injury, various cell types produce soluble factors that promote tissue repair (Karin and Clevers 2016). Chemotherapy-induced activation of these stress responses may promote prosurvival niches that can be co-opted by tumor cells, leading to relapse (Kim and Tannock 2005; Meads et al. 2009; Gilbert and Hemann 2010; Sun et al. 2012; Obenauf et al. 2015). However, it remains poorly understood how nonmalignant cells in the tumor microenvironment respond to therapy-induced damage, whether these responses impact therapeutic response, and what cell types are involved in the promotion of chemoresistance.
Chemotherapy-induced DNA damage can cause cellular senescence, an irreversible cell cycle arrest, in both malignant and nonmalignant cells (Perez-Mancera et al. 2014; Klemm and Joyce 2015). Senescent cells up-regulate a number of proinflammatory cytokines and growth factors that remodel the surrounding environment, a process termed the senescence-associated secretory phenotype (SASP) (Acosta et al. 2008; Coppe et al. 2008; Kuilman et al. 2008; Wajapeyee et al. 2008). The SASP is thought to promote tissue homeostasis by activating tissue repair programs and recruiting immune cells to clear damaged cells (Salama et al. 2014). However, the SASP can also promote age-related pathology and has been implicated in tumor formation and the induction of chemoresistance (Sun et al. 2012; Campisi 2013). Thus, there is active interest in understanding the mechanisms that control SASP factor production.
While the biology of the SASP is beginning to be elucidated, it remains largely unclear what homeostatic mechanisms exist to restrain this potentially deleterious secretory response to limit chronic inflammation. Patients treated with DNA-damaging chemotherapy do not typically exhibit systemic inflammatory responses, which might be expected to result from the widespread induction of a SASP, suggesting that homeostatic mechanisms exist to restrain senescence-associated inflammation. Whether a SASP is consistently found in senescent cells in vivo remains unclear, and recent work indicates that senescence secretory responses may not be universal in vivo. Mice accumulate senescent cells in many tissues as they age but show increases in SASP component expression in only some of these tissues (Baker et al. 2016). Additionally, the deletion of senescent cells from aged mice does not always change SASP-related gene expression (Baker et al. 2016). This suggests that, in addition to the previously described regulation of SASP-associated inflammation by immune-mediated clearance of senescence cells, the SASP itself can be repressed in some contexts. However, our understanding of how the SASP is restrained and how it relates to other physiological secretory responses (Gilbert and Hemann 2010) remains limited.
Here, we describe the molecular control of an acute therapy-induced secretory response that promotes chemoresistance. We provide direct genetic evidence that treatment-induced production of interleukin 6 (IL-6) specifically in endothelial cells (ECs) promotes resistance to the chemotherapeutic doxorubicin. We further found that doxorubicin induces cellular senescence in ECs but, surprisingly, that this is not associated with a canonical SASP. Instead, damaged ECs activate an acute secretory response that is mechanistically distinct from the SASP and depends on reactive oxygen species (ROS)-induced p38 signaling. This acute secretory response occurs in the context of PI3K/AKT/mTOR pathway down-regulation, and we demonstrated that a SASP can be restored in senescent ECs by activating this pathway, implicating PI3K/AKT/mTOR pathway activity as a molecular rheostat that determines senescence-associated inflammation. We thus describe a novel acute senescence secretory response that promotes resistance to therapy. We provide insight into the control of this response, identifying a mechanism by which damage-induced secretory responses can be limited to preserve tissue homeostasis.
Results
Endothelial IL-6 production promotes chemoresistance
EC paracrine signaling has been implicated in the creation of tissue niches that promote stem cell homeostasis (Ding et al. 2012), tissue regeneration (Ding et al. 2010), and cancer cell growth and aggressiveness (Butler et al. 2010; Cao et al. 2014; Fan et al. 2014; Tavora et al. 2014); however, which secreted factors promote cancer chemoresistance in vivo is not well understood. We bred endothelial-specific IL-6 knockout mice that express tamoxifen-inducible Cre under the control of the endothelial-specific VE-Cadherin (CDH5) promoter (Wang et al. 2010) and also carry floxed alleles of IL-6 (Quintana et al. 2013), allowing its excision by Cre [Cdh5(PAC)-CreERT2; IL6f/f] (Fig. 1A). Cre activity was assessed by fluorescence imaging of mice also bearing the mTmG (Muzumdar et al. 2007) transgene, in which Cre-mediated recombination leads to the expression of GFP. Cre induction by 5-d administration of tamoxifen gives Cre activity in the vast majority of vessels (Fig. 1B) and reduces overall IL-6 secretion (Supplemental Fig. S1A). Endothelial-specific IL-6 knockout mice were transplanted with Eµ-myc; p19Arf−/− lymphoma cells, a well-established mouse model of Myc-driven B-cell lymphoma (Adams et al. 1985; Eischen et al. 1999), to monitor the effect of endothelial IL-6 production on the response to doxorubicin treatment (Fig. 1A). Examination of tumor burden in the thymus, a key site of chemoresistance in this model (Gilbert and Hemann 2010), revealed decreased tumor burden in CDH5-CreERT2; IL6f/f mice (Fig. 1C). IL-6 directly promotes chemoresistance in Eµ-myc; p19Arf−/− lymphoma cells in vitro (Supplemental Fig. S1B), and IL-6 does not have a major impact on the growth of these cells in vivo in the absence of treatment (Gilbert and Hemann 2010). These experiments thus provide direct genetic evidence that ECs promote a chemoresistant niche for B-cell lymphoma through the production of paracrine IL-6. Interestingly, dense vascularization and high expression of endothelial-specific gene signatures are predictive of poor survival in human B-cell lymphoma (Lenz et al. 2008). Additionally, high levels of IL-6 predict poor prognosis in human B-cell lymphoma (Seymour et al. 1995). Our data suggest that ECs play a causal role in the promotion of chemoresistance through the secretion of paracrine IL-6.
Figure 1.

Endothelial production of IL-6 promotes chemoresistance. (A) Schematic of experiment assessing the importance of endothelial IL-6 production in B-cell lymphoma chemoresistance. Mice were treated upon palpable tumor formation 12 d after transplantation. (B) Immunofluorescence showing endothelial-specific Cre activity. Cdh5-CreERT2; mTmG; IL6f/f mice were treated with a 5-d course of tamoxifen and stained for GFP and CD31 to identify endothelial specificity and activity of Cre. Bar, 200 µM. (C) B-cell lymphoma burden in the thymus, an important site of chemoresistance in this model, in endothelial IL-6 knockout mice (IL6ECKO) and littermate controls was assessed by measuring tissue weight. n = 16 for control mice; n = 13 for IL6ECKO mice. Data are shown as individual mice with mean ± SEM. (*) P < 0.05.
Doxorubicin induces an acute EC secretory response
The production of paracrine chemoresistance factors such as IL-6 can be altered by chemotherapy-induced damage. How paracrine signals change over the course of treatment and the molecular control of paracrine damage responses are not well understood. Doxorubicin treatment induces β-galactosidase (β-gal) staining, a marker of cellular senescence, at sites of chemoresistance in this model (Supplemental Fig. S1C), and IL-6 is a canonical SASP cytokine, leading us to ask what happens to IL-6 levels in vivo in the days following treatment. To do so, IL-6 secretion was measured before and at various times following treatment. IL-6 levels are acutely induced by treatment (Fig. 2A; Supplemental Fig. S1D–F) but, surprisingly, return to baseline levels in the days following chemotherapy (Fig. 2A), not typical of senescent cells undergoing a SASP (Coppe et al. 2010). Similarly, human umbilical vein ECs (HUVECs) treated with doxorubicin in vitro acutely induce IL-6 production before reducing IL-6 secretion to baseline levels by 5 d after treatment (Fig. 2B). This discrepancy with the SASP led us to investigate whether ECs undergo senescence after treatment in vitro. Doxorubicin-treated ECs arrest and do not incorporate BrdU over a 24-h incubation period (Fig. 2C), stain positively for senescence-associated β-gal (SA-β-gal) (Fig. 2D,E), and up-regulate senescence markers p16 and p21 (Fig. 2F), suggesting that doxorubicin induces the hallmarks of cellular senescence in these cells, although without typical SASP IL-6 production. To confirm that doxorubicin treatment can induce a SASP in our hands, we treated hepatocellular carcinoma (HCC) cells with doxorubicin and observed canonical sustained and higher-level SASP IL-6 production as these cells senesce (Fig. 2G; Supplemental Fig. S1G,H). Thus, doxorubicin induces a secretory response that we term an acute stress-associated phenotype (ASAP) in ECs cultured in vitro as well as at sites of chemoresistance in vivo. The ASAP can promote resistance to chemotherapy treatment yet is not a canonical senescence secretory response.
Figure 2.
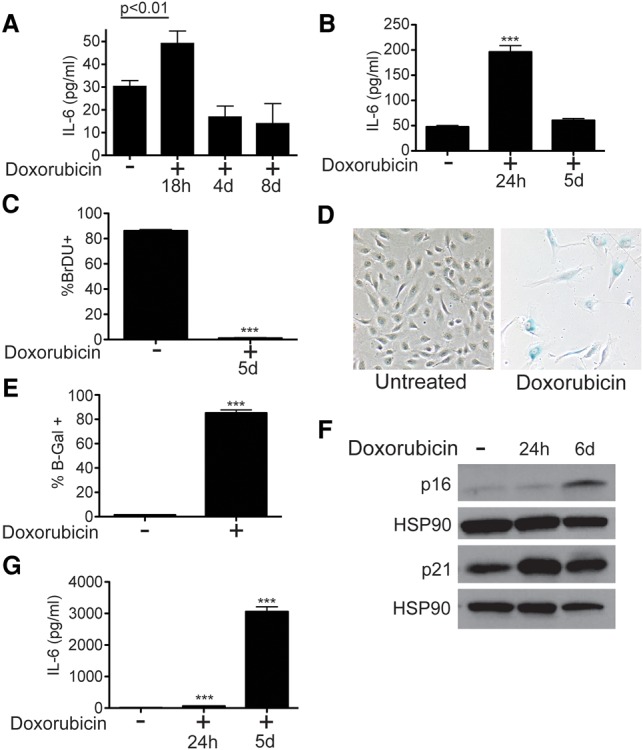
ECs produce acute but not sustained IL-6 during therapy-induced senescence. (A) Quantification of IL-6 levels secreted in the thymus of untreated mice (n = 10) or mice at various times after treatment with 10 mg/kg doxorubicin (n ≥ 3). Values were normalized by tissue weight. (B) Quantification of IL-6 in medium from HUVECs. ECs were treated with 225 nM doxorubicin and IL-6 secretion at 1 and 5 d after treatment measured by ELISA. Measurements are of IL-6 secreted over a 24-h period preceding the collection time. n = 9. (C) BrdU incorporation into doxorubicin-treated or untreated ECs was measured by flow cytometry. Cells were pulsed with BrdU for 24 h before measurement. n = 3. (D) Light microscopy of ECs treated with doxorubicin to induce senescence and fixed and stained for SA-β-gal 5 d after treatment. (E) Quantification of cells treated as in D. Data were quantified from one of multiple representative experiments. (F) Western blots for senescence markers p16 and p21 in EC lysates created at various times after treatment with doxorubicin. (G) IL-6 levels in conditioned medium from FOCUS cells, a HCC cell line. Cells were treated with 25 nM doxorubicin, and IL-6 secretion was measured as in B. n = 4. For all panels, unless otherwise stated, data are shown as mean ± SEM. (***) P < 0.0001.
To further investigate the EC secretory response, the levels of 64 cytokines and growth factors secreted by senescent ECs and HCC cells were measured at 24 h and 5 d after treatment. ECs undergo a significantly dampened senescence secretory response, with a number of cytokines and growth factors not changing in levels or being restrained during senescence (Fig. 3A) compared with the more typical SASP observed in HCC cells (Fig. 3B). The canonical SASP is controlled by the activity of the NF-kB transcription factor as well as DNA damage kinases such as ataxia telangiectasia mutated (ATM) (Rodier et al. 2009; Chien et al. 2011; Ohanna et al. 2011). Infection of endothelial and HCC cells with a dominant-negative, nonphosphorylatable IkBα, which blocks NF-kB activity (Supplemental Fig. S2A), showed that EC IL-6 production was NF-kB-independent (Fig. 3C), while HCC SASP production requires NF-kB activity (Fig. 3D), as expected. Thus, in addition to being temporally distinct from the SASP, the ASAP is controlled in a mechanistically distinct fashion. Additionally, the ASAP is not dependent on DNA damage response kinase activity or mTOR signaling (Supplemental Fig. S2B–D), further distinguishing it from the SASP.
Figure 3.
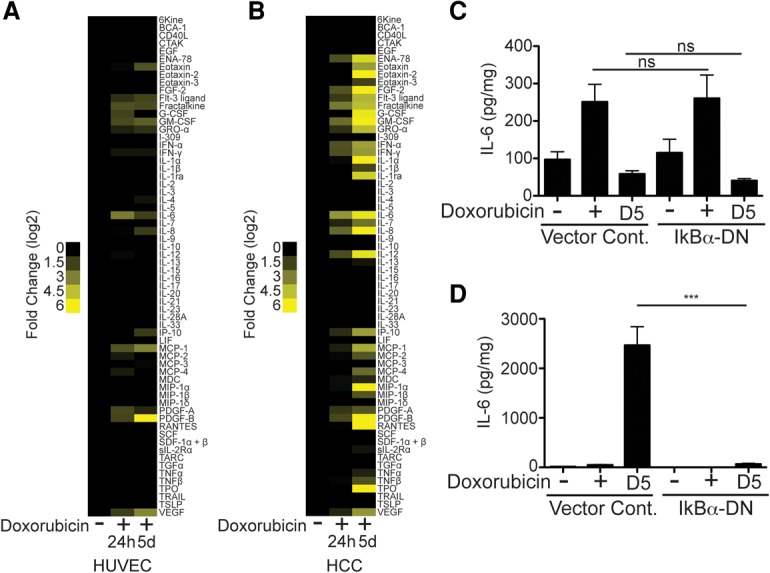
The ASAP and SASP are temporally and mechanistically distinct. (A) A heat map displaying the relative protein concentration of 65 growth factors, cytokines, and chemokines secreted by HUVECs untreated or treated with doxorubicin. The data are displayed as a log2 of the fold change comparing doxorubicin-treated cells over untreated cells. n = 3. (B) A heat map displaying the relative protein concentrations of 65 growth factors, cytokines, and chemokines secreted by HCC cells untreated or treated with doxorubicin. The data are displayed as a log2 of the fold change comparing doxorubicin-treated cells over untreated cells. n = 3. For A and B, media were collected over a 24-h period preceding the time point listed and normalized to cell number. (C) IL-6 levels released by ECs infected with dominant-negative IkBα or vector control and either untreated or treated with 225 nM doxorubicin. n ≥ 6. (D) IL-6 levels in the conditioned medium from HCC cells infected with a dominant-negative allele of IkBα or vector control and either untreated or treated with 25 nM doxorubicin. n = 4. (***) P < 0.001; (ns) P > 0.1.
ASAP IL-6 production is mediated by ROS-induced p38 signaling
Since EC production of IL-6 promotes chemoresistance, we sought to understand how it is controlled mechanistically. The acute release of IL-6 could theoretically result from the dumping of preformed cytokine stores. To investigate whether transcription and translation are required for EC IL-6 production, ECs were treated with doxorubicin in the presence of the RNA polymerase II inhibitor actinomycin D (Fig. 4A) or the translation elongation inhibitor cycloheximide (Fig. 4B), both of which inhibit endothelial IL-6 production. Additionally, intracellular IL-6 levels in ECs are extremely low (data not shown), suggesting that EC IL-6 secretion requires continuous protein production and is an active stress response enacted by damaged ECs.
Figure 4.

The ASAP is dependent on ROS and p38. (A) Quantification of IL-6 release from ECs treated with doxorubicin in the presence of RNA polymerase II inhibitor actinomycin D. n = 8. (B) IL-6 levels in media from doxorubicin- and/or cycloheximide-treated ECs. n = 7. (C) Flow cytometry plot of ECs stained with the ROS-sensitive dye DCF-DA after treatment with 225 nM doxorubicin. (D) EC IL-6 production. ECs were pretreated for 2 h with N-acetylcysteine (NAC) or glutathione (GSH) before the addition of doxorubicin. n ≥ 7 (E) IL-6 release from ECs treated with doxorubicin or the ROS inducers menadione or cumene hydroperoxide. n ≥ 5. (F) IL-6 secretion by ECs treated with doxorubicin in the presence or absence of the p38 inhibitor SB203580. n = 7. (G) IL-6 release by ECs treated with ROS inducers with or without the p38 inhibitor SB203580. n = 3. (H) Western blots of ECs treated with combinations of NAC and doxorubicin. Whole-cell lysates were collected 12 and 24 h after treatment. The intensity of phospho-p38 was quantified in ImageJ. Data are representative of two independent experiments. (I) IL-6 transcript levels from ECs treated with NAC and/or doxorubicin. RNA was extracted at 12 and 24 h after treatment. Transcript levels were measured by quantitative PCR and normalized to levels of GAPDH. For all IL-6 secretion measurements, IL-6 production over a 24-h period was determined by ELISA unless otherwise stated. Data are shown as mean ± SEM. (***) P < 0.001; (**) P < 0.01.
Doxorubicin promotes DNA double-strand breaks through the inhibition of type II topoisomerases and is also known to induce ROS through either the induction of mitochondrial dysfunction or direct redox cycling (Zhang et al. 2012). ROS have previously been implicated in the control of acute inflammatory responses in multiple tissue types (Mittal et al. 2014). To assess ROS levels after doxorubicin treatment, ECs were stained with the ROS-sensitive dye H2-DCFDA, and fluorescence was measured by flow cytometry. This demonstrated significant increases in ROS after treatment (Fig. 4C). Treatment of ECs with doxorubicin in combination with the antioxidants N-acetylcysteine (NAC) or glutathione (GSH) inhibits IL-6 release (Fig. 4D), suggesting that ROS production is essential for doxorubicin-induced IL-6 release. To further verify that ROS induction is sufficient to activate IL-6 secretion, we treated ECs with the oxidizing agents menadione or cumene hydroperoxide, which alone promotes IL-6 release at levels similar to doxorubicin (Fig. 4E).
The stress-responsive mitogen-activated protein kinase (MAPK) p38 is a major downstream effector of ROS and also regulates acute inflammation through the control of cytokine translation and RNA stability (Cuenda and Rousseau 2007; Ray et al. 2012). How doxorubicin activates p38 signaling remains incompletely understood. Doxorubicin-induced EC IL-6 release is dependent on p38 activity, as shown by EC treatment with doxorubicin and a specific p38 inhibitor (Fig. 4F). p38 inhibition also blocks menadione- and cumene hydroperoxide-induced IL-6 release (Fig. 4G), suggesting that ROS-induced p38 activation is required for EC IL-6 production. Additionally, doxorubicin acutely induces p38 phosphorylation in ECs, and the ROS inhibitor NAC blunts this doxorubicin-mediated activation of p38 (Fig. 4H), implicating ROS production in the doxorubicin-induced activation of p38 signaling. p38 regulates cytokine production through the downstream kinase MAPKAP2 (MK2), which phosphorylates RNA-binding proteins such as TTP that control cytokine transcript stability and translation (Tiedje et al. 2012). We found that ROS inhibition does not reduce IL-6 transcript levels (Fig. 4I), suggesting that ROS-induced p38 activation primarily regulates IL-6 translation or subsequent secretion. This defines a novel chemotherapy-induced secretory response in the tumor microenvironment mediated by ROS production and subsequent activation of p38-dependent IL-6 production in damaged cells.
Lack of senescence-associated inflammation is determined by PI3K/AKT/mTOR pathway activity
Senescent cells and, more recently, the SASP have been linked to the pathology of aging and the promotion of cancer cell growth as well as chemoresistance (Coppe et al. 2010; Baker et al. 2011; Canino et al. 2012; Sun et al. 2012). The absence of the SASP in vivo and in ECs in vitro during doxorubicin-induced senescence led us to further investigate the mechanisms controlling ASAP resolution. To further understand the signaling that underlies this state, we created cell lysates from ECs at various times after doxorubicin treatment and profiled intracellular signaling pathway activity using a slide-based antibody array. The PI3K/AKT/mTOR pathway was repressed as ECs became senescent (Fig. 5A,B). Interestingly, mTOR has been hypothesized to regulate SASP factor production as well as the senescence arrest, although its role in regulating the senescence arrest remains unclear (Narita et al. 2011; Herranz et al. 2015; Laberge et al. 2015; Tomimatsu and Narita 2015). We further investigated whether the SASP might be inhibited in ECs due to insufficient mTOR pathway activity during senescence. Activation of PI3K/AKT/mTOR signaling by expression of the adenoviral E4ORF1 protein (Supplemental Fig. S3A,B), which has been used to model activation of the AKT pathway in ECs extensively (Seandel et al. 2008), leads to sustained IL-6 secretion during senescence (Fig. 5C) and increased secretion of a number of proinflammatory SASP components, including IL-8, GM-CSF, Gro, and IFN-g (Fig. 5D).
Figure 5.

PI3K/AKT/mTOR pathway activity decreases after treatment and controls SASP cytokine production. (A) A heat map displaying results of PathScan antibody array analysis of EC lysates treated with doxorubicin for 8, 24, or 120 h. Data are displayed as log2 fold change over untreated cells, with the protein and specific phosphorylation site recognized by antibodies listed. (B) Western blots for p-S6 in lysates from doxorubicin-treated ECs at various times after treatment. (C) IL-6 secretion from ECs infected with MSCVpuro vector control or the adenoviral E4ORF1 protein, which activates PI3K/AKT/mTOR pathway activity. IL-6 secretion 24 h and 5 d after doxorubicin treatment was measured by ELISA. (D) Heat map displaying the levels of six different cytokines and growth factors in EC conditioned medium from vector control-infected (MSCVp) or E4ORF1-infected ECs. (E) Light microscopy of SA-β-gal-stained ECs infected with vector control (MSCVp) or E4ORF1 5 d after treatment with doxorubicin to induce senescence. Cell size and β-gal positivity were assessed.
Senescent ECs also do not exhibit the enlarged morphology classic to senescent cells (Fig. 5E). Activation of PI3K/AKT/mTOR signaling restores this morphologic change (Fig. 5E), implicating this pathway in multiple aspects of cellular senescence. We did not observe substantial E4ORF1-mediated differences in either the proportion of arrested cells (Supplemental Fig. S4A) or EC SA-β-Gal staining after doxorubicin treatment (Supplemental Fig. S4B). These data demonstrate that the activation state of the PI3K/AKT/mTOR pathway influences both the morphologic changes associated with the senescent state and the ability of senescent cells to produce proinflammatory cytokine production and have implications for our understanding of cellular senescence and the SASP.
Activation of PI3K/AKT/mTOR signaling increases IL-6 production in an NF-kB-independent but mTORC1-dependent fashion
PI3K/AKT signaling can activate multiple downstream regulators implicated in the SASP, including mTOR and NF-kB. To distinguish which of these are essential for IL-6 production, ECs were infected with the E4ORF1 vector and cocultured with the NF-kB inhibitor caffeic acid phenethyl ester (CAPE) or the mTORC1 inhibitor rapamycin (Fig. 6A). Rapamycin treatment (Supplemental Fig. S3C) blocks sustained IL-6 production—which is unaffected by CAPE or coinfection of ECs with E4ORF1 and a dominant-negative-NF-kB inhibitor (Fig. 6B)—without affecting the senescence arrest (Supplemental Fig. S4C). mTOR has recently been suggested to regulate the SASP through the promotion of IL1a translation, NF-kB activation, and a subsequent feed-forward loop that reinforces the SASP (Laberge et al. 2015) or by regulating MK2 translation and, subsequently, SASP transcript stability (Herranz et al. 2015). Our data indicate that, in ECs, PI3K/AKT/mTOR pathway activation can induce a SASP in an NF-kB-independent manner, differentiating somewhat the mechanism by which mTOR activity can promote SASP factor production in ECs from that recently observed in fibroblasts (Laberge et al. 2015). Activation of PI3K/AKT/mTOR pathway activity by infection of ECs with a constitutively active myristoylated form of AKT (myr-AKT) (Supplemental Fig. S3A) or mutant H-RAS (G12V) also leads to sustained IL-6 secretion after doxorubicin treatment that is dependent on mTORC1 activity (Fig. 6C). mTOR controls EC cytokine secretion at least in part through the induction of elevated IL-6 transcript levels (Supplemental Fig. S4D), allowing much higher IL-6 production than that observed in the ASAP. Additionally, mTOR activation regulates the secretion of other SASP factors in an mTORC1-dependent fashion (Fig. 6D). We thus identified the activity of the PI3K/AKT/mTOR signaling pathway as a switch that determines SASP factor production and can be regulated to control the duration of senescence-associated inflammation (Fig. 6E).
Figure 6.

PI3K/AKT/mTOR activation switches ASAP to SASP-like cytokine production, which is inhibited by rapamycin. (A) IL-6 secreted by ECs infected with the PI3K/AKT/mTOR pathway-activating E4ORF1 construct or vector control (MSCV). ECs were treated with doxorubicin in combination with the NF-kB inhibitor CAPE or the mTORC1 inhibitor rapamycin. IL-6 secretion was measured for the 24 h preceding the time point listed and was normalized to cell number. (B) IL-6 secretion from ECs infected with both E4ORF1 and a dominant-negative allele of IkBα or vector control following doxorubicin treatment. (C) IL-6 produced by ECs infected with HRasV12, myr-AKT, or vector control and left untreated or treated with doxorubicin in the presence or absence of rapamycin. (D) Heat map displaying the levels of six different cytokines and growth factors in conditioned medium from E4ORF1-infected ECs treated with or without the mTORC1 inhibitor rapamycin. (E) Doxorubicin-induced ROS lead to increased p38 phosphorylation and increased ASAP cytokine production. In the setting of sustained PI3K/AKT/mTOR signaling, ECs undergo a SASP with sustained cytokine production; however, when signaling through this pathway is restrained, ECs resolve the ASAP and enter a less secretory senescent state.
Discussion
Efforts to improve the treatment of cancer have traditionally focused on cancer-intrinsic susceptibilities. However, therapies that target the tumor microenvironment represent a promising new approach to improve the efficacy of currently used chemotherapy (Meads et al. 2009; Hanahan and Weinberg 2011; Klemm and Joyce 2015). Tumors are complex tissues made up of malignant and nonmalignant cell types, with cytokine and growth factor production, local nutrient availability, and many additional factors playing a role in tumor growth. A better understanding of the tumor microenvironment will be essential to intelligently target it. The microenvironment changes both during tumor progression and over the course of therapy (Kim and Tannock 2005; Klemm and Joyce 2015), but the changes that occur during therapy are poorly understood. Here, we show that the chemotherapeutic doxorubicin induces acute production of the cytokine IL-6 from ECs in the tumor microenvironment and that this release promotes chemoresistance in B-cell lymphoma.
Surprisingly, we found that, while doxorubicin treatment induces cellular senescence in ECs, it does not lead to a canonical SASP with sustained cytokine production. The connection between cellular senescence and tumor progression is complex, with senescence of damaged or oncogene-activated cells leading to cell cycle arrest and preventing malignant transformation but also potentially creating a SASP-fueled protumorigenic and chemoresistant microenvironment (Coppe et al. 2010). Senescent cells are found in premalignant and malignant tumors, and cellular senescence can be induced in both malignant and nonmalignant cells by chemotherapy and irradiation (Perez-Mancera et al. 2014). How senescence secretory responses vary across genetic backgrounds and cell types remains unclear, and the molecular control of the SASP is only beginning to be fully elucidated (Perez-Mancera et al. 2014; Salama et al. 2014; Toso et al. 2014).
Multiple studies have suggested that immune cells identify and effectively eliminate senescent cells undergoing a SASP, contributing to the resolution of potentially deleterious inflammation (Krizhanovsky et al. 2008; Kang et al. 2011). However, it is unclear whether additional mechanisms exist to limit the secretory responses of persisting senescent cells, preventing them from eliciting systemic inflammation. The self-limiting senescence-associated secretory response that we show occurs as a result of PI3K/AKT/mTOR pathway suppression thus represents a mechanism by which prosurvival paracrine signaling can be activated acutely without the chronic inflammation and tissue dysfunction associated with a full-blown SASP (Nathan and Ding 2010). Thus, we elucidated an additional regulatory mechanism by which tissue homeostasis can be maintained in the face of extensive cellular stress. Intriguingly, rapamycin, which inhibits mTOR as well as the SASP, extends life span in diverse organisms from yeast to mammals (Harrison et al. 2009). The data shown here suggest that rapamycin may extend life span at least in part through its ability to regulate the SASP, limiting deleterious inflammation and improving tissue function.
ECs regulate immune cell trafficking into tissues and are important gatekeepers of tissue inflammation (Pober and Sessa 2007). Thus, endothelial activation during therapy-induced senescence may be under particularly tight control. However, while the suppression of an endothelial SASP may help preserve tissue homeostasis in some contexts, it remains possible that the absence of the SASP in ECs is deleterious in others, impairing the clearance of damaged cells. Patients treated with radiation and chemotherapy have an increased risk of vascular pathology and tissue dysfunction years after treatment (Oeffinger et al. 2006), and senescent ECs are found in atherosclerotic lesions (Minamino et al. 2002). The regulation of chemotherapy-induced senescence in the endothelium is thus relevant beyond its direct impact on tumor biology, but further work will be necessary to elucidate the broader biological impact of this mechanism of SASP suppression as well as the stimuli and cell types for which SASP factor production does or does not occur during senescence in vivo.
We showed that secretory responses resulting from therapy-induced damage of the endothelium can be co-opted by cancer cells to promote chemoresistance in vivo and that, depending on the activity of the PI3K/AKT/mTOR pathway, DNA damage can induce two distinct secretory responses that differ in their timing and molecular mechanisms. This work informs our understanding of microenvironment-mediated chemoprotection and demonstrates that the modulation of AKT/mTOR signaling can play an important role in the physiologic regulation of senescence, helping to determine the chronicity of damage-induced cytokine secretion and limiting deleterious inflammation.
Materials and methods
Cell culture and chemicals
HUVECs were purchased from Lonza and cultured in Endothelial Cell Growth Medium 2 (Lonza). HCC (FOCUS) cells were grown in 45%DMEM, 45% IMDM, and 10% FBS supplemented with 2 mM L-glutamine and 5 µM β-mercaptoethanol. Cells were treated with doxorubicin at the specified concentrations. NAC (Sigma) and GSH (Sigma) were resuspended in HUVEC medium at a final concentration of 10 mM, and pH was adjusted to 7.0 with NaOH. Menadione (5–10 µM) and 50–100 µM cumene hydroperoxide were purchased at Sigma and used as described. SB203580 (LC Laboratories) was used at 10 µM. Rapamycin (8 nM) (LC Laboratories), 2 µM CAPE (Tocris), 2.5 µM DNA-PK inhibitor II (Calbiochem), and 5 µM NVP-BEZ235 were purchased as indicated and used as described. Actinomycin D (4 µM) and 5 µg/mL cycloheximide were purchased from Sigma and used as described.
Mice
C57Bl/6J (wild type) mice were purchased from Jackson Laboratories. Cdh5(PAC)-CreERT2 (Wang et al. 2010) and mTmG (Muzumdar et al. 2007) mice backcrossed onto C57Bl/6J mice were provided by Patrick Murphy and Richard Hynes. IL-6 floxed mice were obtained from the European Mutant Mouse Archive, rederived from embryos, and backcrossed an additional two generations onto C57Bl/6J mice before use. For lymphoma experiments, 2 × 10⁶ Eu-Myc; p19Arf−/− lymphoma cells were injected by tail vein. Disease progression was followed by palpation of lymphoma burden in the axillary and brachial lymph nodes, and, at earliest palpable disease, ∼12 d post-injection, mice were treated with a single dose of 10 mg/kg doxorubicin intraperitoneally. Mice were sacrificed when moribund. For all experiments with transgenic mice, littermate controls were used. All mice are housed in the Koch Institute Animal Facility at Massachusetts Institute of Technology.
ELISA and Luminex cytokine measurements
All secreted factor concentrations determined by ELISA and cytokine arrays were normalized to the number of live cells at the end of the assay or the weight of the dissected tissue. Mouse and human IL-6 Ready-SET-GO ELISA kits (eBioscience) were used according to the manufacturer's instructions. IL-6 standard was either resuspended in ELISA diluate (per the manufacturer's instructions) or cell culture medium with compounds used in the corresponding conditioned medium. Concentrations were determined with a four-parameter logistic regression using a standard curve on ReaderFit.com or http://www.elisaanalysis.com. Multiplexed Luminex assays for growth factor, chemokine, and cytokine levels were preformed as described by the manufacturer (Eve Technologies). Unless otherwise stated, ELISA experiments were n ≥ 4.
Immunofluorescence
Mouse tissues were embedded and frozen in OCT compound (Tissue-Tek). Frozen tissue sections were fixed in 3% PFA and 1× PBS for 20 min prior to blocking in 2% BSA and 0.1% Triton X-100. Primary antibody stains were performed overnight at 4°C, and secondary stains were performed for 1 h, both in 0.2% BSA and 0.01% Triton X-100 in a humid chamber to prevent drying. DAPI (Invitrogen) was used at 1 µg/mL. Antibodies used were rabbit anti-GFP (1:500; Invitrogen), anti-CD31 MEC13.3 (1:100; BD), goat anti-rat Alexa fluor 647 (Invitrogen), and goat anti-rabbit Alexa 488 (Invitrogen). Images were acquired on a Nikon A1R confocal microscope.
Flow cytometry
For flow cytometry, HUVECs or FOCUS cells were trypsinized for ≥5 min, trypsin was quenched with medium, and the cells were run on a FACScan, FACSCalibur, LSRII HTS, or LSR-Fortessa HTS (BD) flow cytometer with or without the membrane exclusion dye propidium iodide for a set amount of time at a constant flow rate to determine cell number. FlowJo was used for post-acquisition analysis. DCFDA ROS detection kit (Abcam) was used according to the manufacturer's instructions.
Protein analysis
For Western blots, cell lysates were collected in RIPA buffer with protease and phosphatase inhibitor cocktails (Roche). Debris was removed by centrifugation, and protein concentration in the supernatant was determined by BCA (Thermo). Lysates were reconstituted to equal concentrations, mixed with SDS sample buffer (Boston BioProducts), and boiled for 5 min prior to running. Samples were run on a polyacrylamide gel nongradient (Bio-Rad) or NOVEX 4%–20% Tris-glycine (Invitrogen), transferred to PVDF (Millipore), and blotted with the following antibodies: p16 (1:500; Santa Cruz Biotechnology, #759), p21 (1:500; Santa Cruz Biotechnology, #397), HSP90 (1:10,000; BD, #610418), Actin, p38 (1:1000; Cell Signaling Technology, #9212), p-p38 (1:1000; Cell Signaling Technology, #9211), p-S6 (D57.2.2E; 1:1000; Cell Signaling Technology, #4858), S6 (5G10; 1:1000; Cell Signaling Technology, #2217), p70S6K (1:1000; Cell Signaling Technology, #2708), p-p70S6K (1:1000; Cell Signaling Technology, #9234), IkBα (1:1000; Cell Signaling Technology, #9242), p-AKT (31E5E; 1:500; Cell Signaling Technology, #2965), and AKT (1:1000; Cell Signaling Technology, #4691). PathScan intracellular signaling array kit (Cell Signaling Technology) was used to profile endothelial signaling according to the manufacturer's instructions. Gels and antibody array slides were imaged with an ImageQuant LAS 4000 (GE) or exposed to film.
RT–PCR
RNA was extracted using the QIAshredder and RNeasy kits (Qiagen). cDNA was reverse-transcribed from RNA using random hexamers. Transcript levels were determined by quantitative PCR using an Applied Biosystems thermal cycler with SYBR Green master mix. Samples were normalized to GAPDH, and relative transcript levels were quantified by the ΔCt method.
Secreted protein collection and drug treatments
Conditioned media for HUVEC and FOCUS cell experiments were made by collecting the media on cells for 24 h prior to each time point from 50,000 or 150,000 cells seeded into 24-well or six-well plates, respectively. ECs were untreated or treated with 200 or 225 nM doxorubicin. FOCUS cells were untreated or treated with 25–200 nM doxorubicin for 24-h time points or 25–100 nM for 5-d time points. For the 5-d time point for FOCUS cells, the medium was changed, and the drug was removed 24 h after addition; for the 5-d time point for HUVECs, the drug was left on cells for 4 d. The resultant conditioned medium was used for cytokine measurements as described above. For lymphoma-IL-6 coculture experiments, cells were treated with doxorubicin at the LD ∼90 in the presence or absence of 10 ng/mL hIL-6 (Peprotech), and cell number was assessed by flow cytometry on a BD FACSCalibur 48 h after treatment.
Mouse thymus/endothelial IL-6 secretion
Tissues from untreated mice or mice treated with doxorubicin for the stated amount of time were removed and manually dissociated in FOCUS cell medium. Soluble factors in the thymus were collected by incubation in medium for 6 or 8 h at 37°C to create conditioned medium. The conditioned medium was cleared of tissue and cells by centrifugation, and IL-6 concentration was measured by ELISA as described above. To isolate murine ECs for IL-6 measurements, thymic tissue was manually dissociated before incubation with 1.3 Wunsch units/mL Liberase and 0.15 mg/mL DNase I for 1 h at 37°C. Dissociated cells were stained with FITC-CD31/CD34 and purified by FACS using a MoFlo cell sorter. Cells were plated and allowed to adhere for 24 h before treatment with doxorubicin. Secretion was measured over 24–48 h, and the resultant conditioned medium was cleared of cells by centrifugation before IL-6 measurements by ELISA as described above.
cDNA constructs
E4ORF1 was cloned from human adenovirus type C strain 5 genomic DNA into a retroviral MSCV-puro or MSCV-GFP vector. Each cDNA retroviral vector was transfected into Phoenix cells to produce amphotropic retrovirus, and target cells were infected and selected by sorting on GFP or treatment with puromycin. pBABE-IkBα-DN was a gift from Tyler Jacks. pBABE puro H-RAS V12 (Addgene, plasmid #9051) and pBABE puro myrAKT were a gift from William Hahn.
β-Gal activity staining
Cells were fixed with 0.5% glutaraldehyde in PBS for 15 min, washed with PBS supplemented with 1 mM MgCl2, and stained for 6 h in PBS (pH 5.5) (for mouse samples) or PBS (pH 6.0) (for human samples) containing 1 mM MgCl2, 1 mg/mL X-Gal, 5 mM potassium ferricyanide II, and p5 mM otassium ferrocyanide III. Images were collected on an Eclipse TE2000-U (Nikon) equipped with Spot software or Axioplan2 (Zeiss) microscope equipped with Openlab software from Improvision.
BrdU staining
Cells untreated or treated for the specified amount of time were stained using the APC-BrdU flow kit (BD Bioscience) according to manufacturer's instructions, and cells were analyzed by flow cytometry as described.
Statistical analysis
Statistical analysis was performed using GraphPad Prism4 software. Two-tailed Student's t-tests were used as indicated. Error bars represent mean ± SEM or as noted.
Supplementary Material
Acknowledgments
We thank Boyang Zhao, Rachel Wolfson, Pan-Yu Chen, and Patrick Murphy for their advice and help with experiments and reagents. We also thank the entire Hemann laboratory for helpful discussions. This work was supported by the Massachusetts Institute of Technology Ludwig Center for Cancer Research. This work was also supported in part by Koch Institute Support (core) grant P30-CA14051 from the National Cancer Institute. E.H.B. is supported by National Institutes of Health grant T32GM007753.
Footnotes
Supplemental material is available for this article.
Article published online ahead of print. Article and publication date are online at http://www.genesdev.org/cgi/doi/10.1101/gad.284851.116.
References
- Acosta JC, O'Loghlen A, Banito A, Guijarro MV, Augert A, Raguz S, Fumagalli M, Da Costa M, Brown C, Popov N, et al. 2008. Chemokine signaling via the CXCR2 receptor reinforces senescence. Cell 133: 1006–1018. [DOI] [PubMed] [Google Scholar]
- Adams JM, Harris AW, Pinkert CA, Corcoran LM, Alexander WS, Cory S, Palmiter RD, Brinster RL. 1985. The c-myc oncogene driven by immunoglobulin enhancers induces lymphoid malignancy in transgenic mice. Nature 318: 533–538. [DOI] [PubMed] [Google Scholar]
- Baker DJ, Wijshake T, Tchkonia T, LeBrasseur NK, Childs BG, van de Sluis B, Kirkland JL, van Deursen JM. 2011. Clearance of p16Ink4a-positive senescent cells delays ageing-associated disorders. Nature 479: 232–236. [DOI] [PMC free article] [PubMed] [Google Scholar]
- Baker DJ, Childs BG, Durik M, Wijers ME, Sieben CJ, Zhong J, Saltness RA, Jeganathan KB, Verzosa GC, Pezeshki A, et al. 2016. Naturally occurring p16(Ink4a)-positive cells shorten healthy lifespan. Nature 530: 184–189. [DOI] [PMC free article] [PubMed] [Google Scholar]
- Butler JM, Kobayashi H, Rafii S. 2010. Instructive role of the vascular niche in promoting tumour growth and tissue repair by angiocrine factors. Nat Rev Cancer 10: 138–146. [DOI] [PMC free article] [PubMed] [Google Scholar]
- Calon A, Lonardo E, Berenguer-Llergo A, Espinet E, Hernando-Momblona X, Iglesias M, Sevillano M, Palomo-Ponce S, Tauriello DV, Byrom D, et al. 2015. Stromal gene expression defines poor-prognosis subtypes in colorectal cancer. Nat Genet 47: 320–329. [DOI] [PubMed] [Google Scholar]
- Campisi J. 2013. Aging, cellular senescence, and cancer. Annu Rev Physiol 75: 685–705. [DOI] [PMC free article] [PubMed] [Google Scholar]
- Canino C, Mori F, Cambria A, Diamantini A, Germoni S, Alessandrini G, Borsellino G, Galati R, Battistini L, Blandino R, et al. 2012. SASP mediates chemoresistance and tumor-initiating-activity of mesothelioma cells. Oncogene 31: 3148–3163. [DOI] [PubMed] [Google Scholar]
- Cao Z, Ding BS, Guo P, Lee SB, Butler JM, Casey SC, Simons M, Tam W, Felsher DW, Shido K, et al. 2014. Angiocrine factors deployed by tumor vascular niche induce B cell lymphoma invasiveness and chemoresistance. Cancer cell 25: 350–365. [DOI] [PMC free article] [PubMed] [Google Scholar]
- Chien Y, Scuoppo C, Wang X, Fang X, Balgley B, Bolden JE, Premsrirut P, Luo W, Chicas A, Lee CS, et al. 2011. Control of the senescence-associated secretory phenotype by NF-κB promotes senescence and enhances chemosensitivity. Genes Dev 25: 2125–2136. [DOI] [PMC free article] [PubMed] [Google Scholar]
- Coppe JP, Patil CK, Rodier F, Sun Y, Munoz DP, Goldstein J, Nelson PS, Desprez PY, Campisi J. 2008. Senescence-associated secretory phenotypes reveal cell-nonautonomous functions of oncogenic RAS and the p53 tumor suppressor. PLoS Biol 6: 2853–2868. [DOI] [PMC free article] [PubMed] [Google Scholar]
- Coppe JP, Desprez PY, Krtolica A, Campisi J. 2010. The senescence-associated secretory phenotype: the dark side of tumor suppression. Annu Rev Pathol 5: 99–118. [DOI] [PMC free article] [PubMed] [Google Scholar]
- Cuenda A, Rousseau S. 2007. p38 MAP-kinases pathway regulation, function and role in human diseases. Biochim Biophys Acta 1773: 1358–1375. [DOI] [PubMed] [Google Scholar]
- Ding BS, Nolan DJ, Butler JM, James D, Babazadeh AO, Rosenwaks Z, Mittal V, Kobayashi H, Shido K, Lyden D, et al. 2010. Inductive angiocrine signals from sinusoidal endothelium are required for liver regeneration. Nature 468: 310–315. [DOI] [PMC free article] [PubMed] [Google Scholar]
- Ding L, Saunders TL, Enikolopov G, Morrison SJ. 2012. Endothelial and perivascular cells maintain haematopoietic stem cells. Nature 481: 457–462. [DOI] [PMC free article] [PubMed] [Google Scholar]
- Eischen CM, Weber JD, Roussel MF, Sherr CJ, Cleveland JL. 1999. Disruption of the ARF–Mdm2–p53 tumor suppressor pathway in Myc-induced lymphomagenesis. Genes Dev 13: 2658–2669. [DOI] [PMC free article] [PubMed] [Google Scholar]
- Fan Y, Potdar AA, Gong Y, Eswarappa SM, Donnola S, Lathia JD, Hambardzumyan D, Rich JN, Fox PL. 2014. Profilin-1 phosphorylation directs angiocrine expression and glioblastoma progression through HIF-1α accumulation. Nat Cell Biol 16: 445–456. [DOI] [PMC free article] [PubMed] [Google Scholar]
- Gilbert LA, Hemann MT. 2010. DNA damage-mediated induction of a chemoresistant niche. Cell 143: 355–366. [DOI] [PMC free article] [PubMed] [Google Scholar]
- Hanahan D, Weinberg RA. 2011. Hallmarks of cancer: the next generation. Cell 144: 646–674. [DOI] [PubMed] [Google Scholar]
- Harrison DE, Strong R, Sharp ZD, Nelson JF, Astle CM, Flurkey K, Nadon NL, Wilkinson JE, Frenkel K, Carter CS, et al. 2009. Rapamycin fed late in life extends lifespan in genetically heterogeneous mice. Nature 460: 392–395. [DOI] [PMC free article] [PubMed] [Google Scholar]
- Herranz N, Gallage S, Mellone M, Wuestefeld T, Klotz S, Hanley CJ, Raguz S, Acosta JC, Innes AJ, Banito A, et al. 2015. mTOR regulates MAPKAPK2 translation to control the senescence-associated secretory phenotype. Nat Cell Biol 17: 1205–1217. [DOI] [PMC free article] [PubMed] [Google Scholar]
- Kang TW, Yevsa T, Woller N, Hoenicke L, Wuestefeld T, Dauch D, Hohmeyer A, Gereke M, Rudalska R, Potapova A, et al. 2011. Senescence surveillance of pre-malignant hepatocytes limits liver cancer development. Nature 479: 547–551. [DOI] [PubMed] [Google Scholar]
- Karin M, Clevers H. 2016. Reparative inflammation takes charge of tissue regeneration. Nature 529: 307–315. [DOI] [PMC free article] [PubMed] [Google Scholar]
- Kim JJ, Tannock IF. 2005. Repopulation of cancer cells during therapy: an important cause of treatment failure. Nat Rev Cancer 5: 516–525. [DOI] [PubMed] [Google Scholar]
- Klemm F, Joyce JA. 2015. Microenvironmental regulation of therapeutic response in cancer. Trends Cell Biol 25: 198–213. [DOI] [PMC free article] [PubMed] [Google Scholar]
- Krizhanovsky V, Yon M, Dickins RA, Hearn S, Simon J, Miething C, Yee H, Zender L, Lowe SW. 2008. Senescence of activated stellate cells limits liver fibrosis. Cell 134: 657–667. [DOI] [PMC free article] [PubMed] [Google Scholar]
- Kuilman T, Michaloglou C, Vredeveld LC, Douma S, van Doorn R, Desmet CJ, Aarden LA, Mooi WJ, Peeper DS. 2008. Oncogene-induced senescence relayed by an interleukin-dependent inflammatory network. Cell 133: 1019–1031. [DOI] [PubMed] [Google Scholar]
- Laberge RM, Sun Y, Orjalo AV, Patil CK, Freund A, Zhou L, Curran SC, Davalos AR, Wilson-Edell KA, Liu S, et al. 2015. MTOR regulates the pro-tumorigenic senescence-associated secretory phenotype by promoting IL1A translation. Nat Cell Biol 17: 1049–1061. [DOI] [PMC free article] [PubMed] [Google Scholar]
- Lenz G, Wright G, Dave SS, Xiao W, Powell J, Zhao H, Xu W, Tan B, Goldschmidt N, Iqbal J, et al. 2008. Stromal gene signatures in large-B-cell lymphomas. N Engl J Med 359: 2313–2323. [DOI] [PMC free article] [PubMed] [Google Scholar]
- Longley DB, Johnston PG. 2005. Molecular mechanisms of drug resistance. J Pathol 205: 275–292. [DOI] [PubMed] [Google Scholar]
- Meads MB, Gatenby RA, Dalton WS. 2009. Environment-mediated drug resistance: a major contributor to minimal residual disease. Nat Rev Cancer 9: 665–674. [DOI] [PubMed] [Google Scholar]
- Minamino T, Miyauchi H, Yoshida T, Ishida Y, Yoshida H, Komuro I. 2002. Endothelial cell senescence in human atherosclerosis: role of telomere in endothelial dysfunction. Circulation 105: 1541–1544. [DOI] [PubMed] [Google Scholar]
- Mittal M, Siddiqui MR, Tran K, Reddy SP, Malik AB. 2014. Reactive oxygen species in inflammation and tissue injury. Antioxid Redox Signal 20: 1126–1167. [DOI] [PMC free article] [PubMed] [Google Scholar]
- Muzumdar MD, Tasic B, Miyamichi K, Li L, Luo L. 2007. A global double-fluorescent Cre reporter mouse. Genesis 45: 593–605. [DOI] [PubMed] [Google Scholar]
- Narita M, Young AR, Arakawa S, Samarajiwa SA, Nakashima T, Yoshida S, Hong S, Berry LS, Reichelt S, Ferreira M, et al. 2011. Spatial coupling of mTOR and autophagy augments secretory phenotypes. Science 332: 966–970. [DOI] [PMC free article] [PubMed] [Google Scholar]
- Nathan C, Ding A. 2010. Nonresolving inflammation. Cell 140: 871–882. [DOI] [PubMed] [Google Scholar]
- Obenauf AC, Zou Y, Ji AL, Vanharanta S, Shu W, Shi H, Kong X, Bosenberg MC, Wiesner T, Rosen N, et al. 2015. Therapy-induced tumour secretomes promote resistance and tumour progression. Nature 520: 368–372. [DOI] [PMC free article] [PubMed] [Google Scholar]
- Oeffinger KC, Mertens AC, Sklar CA, Kawashima T, Hudson MM, Meadows AT, Friedman DL, Marina N, Hobbie W, Kadan-Lottick NS, et al. 2006. Chronic health conditions in adult survivors of childhood cancer. N Engl J Med 355: 1572–1582. [DOI] [PubMed] [Google Scholar]
- Ohanna M, Giuliano S, Bonet C, Imbert V, Hofman V, Zangari J, Bille K, Robert C, Bressac-De Paillerets B, Hofman P, et al. 2011. Senescent cells develop a PARP-1 and nuclear factor- B-associated secretome (PNAS). Genes Dev 25: 1245–1261. [DOI] [PMC free article] [PubMed] [Google Scholar]
- Perez-Mancera PA, Young AR, Narita M. 2014. Inside and out: the activities of senescence in cancer. Nat Rev Cancer 14: 547–558. [DOI] [PubMed] [Google Scholar]
- Pober JS, Sessa WC. 2007. Evolving functions of endothelial cells in inflammation. Nat Rev Immunol 7: 803–815. [DOI] [PubMed] [Google Scholar]
- Quintana A, Erta M, Ferrer B, Comes G, Giralt M, Hidalgo J. 2013. Astrocyte-specific deficiency of interleukin-6 and its receptor reveal specific roles in survival, body weight and behavior. Brain Behav Immun 27: 162–173. [DOI] [PubMed] [Google Scholar]
- Ray PD, Huang BW, Tsuji Y. 2012. Reactive oxygen species (ROS) homeostasis and redox regulation in cellular signaling. Cell Signal 24: 981–990. [DOI] [PMC free article] [PubMed] [Google Scholar]
- Rodier F, Coppe JP, Patil CK, Hoeijmakers WA, Munoz DP, Raza SR, Freund A, Campeau E, Davalos AR, Campisi J. 2009. Persistent DNA damage signalling triggers senescence-associated inflammatory cytokine secretion. Nat Cell Biol 11: 973–979. [DOI] [PMC free article] [PubMed] [Google Scholar]
- Salama R, Sadaie M, Hoare M, Narita M. 2014. Cellular senescence and its effector programs. Genes Dev 28: 99–114. [DOI] [PMC free article] [PubMed] [Google Scholar]
- Seandel M, Butler JM, Kobayashi H, Hooper AT, White IA, Zhang F, Vertes EL, Kobayashi M, Zhang Y, Shmelkov SV, et al. 2008. Generation of a functional and durable vascular niche by the adenoviral E4ORF1 gene. Proc Natl Acad Sci 105: 19288–19293. [DOI] [PMC free article] [PubMed] [Google Scholar]
- Seymour JF, Talpaz M, Cabanillas F, Wetzler M, Kurzrock R. 1995. Serum interleukin-6 levels correlate with prognosis in diffuse large-cell lymphoma. J Clin Oncol 13: 575–582. [DOI] [PubMed] [Google Scholar]
- Sun Y, Campisi J, Higano C, Beer TM, Porter P, Coleman I, True L, Nelson PS. 2012. Treatment-induced damage to the tumor microenvironment promotes prostate cancer therapy resistance through WNT16B. Nat Med 18: 1359–1368. [DOI] [PMC free article] [PubMed] [Google Scholar]
- Tavora B, Reynolds LE, Batista S, Demircioglu F, Fernandez I, Lechertier T, Lees DM, Wong PP, Alexopoulou A, Elia G, et al. 2014. Endothelial-cell FAK targeting sensitizes tumours to DNA-damaging therapy. Nature 514: 112–116. [DOI] [PMC free article] [PubMed] [Google Scholar]
- Tiedje C, Ronkina N, Tehrani M, Dhamija S, Laass K, Holtmann H, Kotlyarov A, Gaestel M. 2012. The p38/MK2-driven exchange between tristetraprolin and HuR regulates AU-rich element-dependent translation. PLoS Genet 8: e1002977. [DOI] [PMC free article] [PubMed] [Google Scholar]
- Tomimatsu K, Narita M. 2015. Translating the effects of mTOR on secretory senescence. Nat Cell Biol 17: 1230–1232. [DOI] [PubMed] [Google Scholar]
- Toso A, Revandkar A, Di Mitri D, Guccini I, Proietti M, Sarti M, Pinton S, Zhang J, Kalathur M, Civenni G, et al. 2014. Enhancing chemotherapy efficacy in Pten-deficient prostate tumors by activating the senescence-associated antitumor immunity. Cell Rep 9: 75–89. [DOI] [PubMed] [Google Scholar]
- Wajapeyee N, Serra RW, Zhu X, Mahalingam M, Green MR. 2008. Oncogenic BRAF induces senescence and apoptosis through pathways mediated by the secreted protein IGFBP7. Cell 132: 363–374. [DOI] [PMC free article] [PubMed] [Google Scholar]
- Wang Y, Nakayama M, Pitulescu ME, Schmidt TS, Bochenek ML, Sakakibara A, Adams S, Davy A, Deutsch U, Luthi U, et al. 2010. Ephrin-B2 controls VEGF-induced angiogenesis and lymphangiogenesis. Nature 465: 483–486. [DOI] [PubMed] [Google Scholar]
- Zhang S, Liu X, Bawa-Khalfe T, Lu LS, Lyu YL, Liu LF, Yeh ET. 2012. Identification of the molecular basis of doxorubicin-induced cardiotoxicity. Nat Med 18: 1639–1642. [DOI] [PubMed] [Google Scholar]
Associated Data
This section collects any data citations, data availability statements, or supplementary materials included in this article.