

Abstract
We have investigated transcriptional and epigenetic differences in peripheral blood mononuclear cells (PBMCs) of monozygotic female twins discordant in the diagnosis of amyotrophic lateral sclerosis (ALS). Exploring DNA methylation differences by reduced representation bisulfite sequencing (RRBS), we determined that, over time, the ALS twin developed higher abundances of the CD14 macrophages and lower abundances of T cells compared to the non-ALS twin. Higher macrophage signature in the ALS twin was also shown by RNA sequencing (RNA-seq). Moreover, the twins differed in the methylome at loci near several genes, including EGFR and TNFRSF11A, and in the pathways related to the tretinoin and H3K27me3 markers. We also tested cytokine production by PBMCs. The ALS twin’s PBMCs spontaneously produced IL-6 and TNF-α, whereas PBMCs of the healthy twin produced these cytokines only when stimulated by superoxide dismutase (SOD)-1. These results and flow cytometric detection of CD45 and CD127 suggest the presence of memory T cells in both twins, but effector T cells only in the ALS twin. The ALS twin’s PBMC supernatants, but not the healthy twin’s, were toxic to rat cortical neurons, and this toxicity was strongly inhibited by an IL-6 receptor antibody (tocilizumab) and less well by TNF-α and IL-1β antibodies. The putative neurotoxicity of IL-6 and TNF-α is in agreement with a high expression of these cytokines on infiltrating macrophages in the ALS spinal cord. We hypothesize that higher macrophage abundance and increased neurotoxic cytokines have a fundamental role in the phenotype and treatment of certain individuals with ALS.—Lam, L., Chin, L., Halder, R. C., Sagong, B., Famenini, S., Sayre, J., Montoya, D., Rubbi L., Pellegrini, M., Fiala, M. Epigenetic changes in T-cell and monocyte signatures and production of neurotoxic cytokines in ALS patients.
Keywords: inflammation, ALS, SOD-1
Neuronal death in the amyotrophic lateral sclerosis (ALS) spinal cord is related to intrinsic neuronal mechanisms related to pathogenic proteins that are aggregated, modified, and mislocalized into the cytoplasm, and immune mechanisms stimulated by these proteins. The pathogenic proteins include superoxide dismutase (SOD)-1, transactive response (TAR) DNA-binding protein (TDP)-43, and RNA-binding protein fused in sarcoma/translocated in liposarcoma (FUS) (1,2), as well as RNA-peptide aggregates (3). TDP-43 becomes ubiquitinated in sporadic ALS (sALS) and frontotemporal dementia (4). RNA-binding proteins have prion-like domains important in assembly of stress granules, as well as in pathologic protein aggregation and intercellular propagation (5). TDP-43 proteinopathy is associated with antisense RNA foci in the motor neurons of patients with C9ORF72-ALS (6).
Since the 1990s, the pathophysiology of ALS has been thought to involve the participation of immune mechanisms (7–10), including autoimmunity (11). The roles of nonneuronal cells, including microglia (12), astrocytes (13, 14), and oligodendrocytes (15), have been described in animal models. However, in the spinal cord in human sALS, macrophages appear to assume the canonical role of microglia in animal models. The postmortem ALS spinal cord is densely infiltrated by large macrophages visibly exiting from the vessels and morphologically distinct from ramified microglia (8), thus suggesting their blood origin. The immigration of blood-borne macrophages into the CNS is well known in other human neuroinflammatory disorders, such as HIV-1 encephalitis (16) and Alzheimer disease (17).
SOD-1 has a central role in sALS immunopathology through the induction of inflammatory cytokines by the aggregated form of its wild type (18). SOD-1 aggregation is a prominent feature of ALS, occurring both in vitro and in the spinal cord of transgenic mice (19). Denatured SOD-1 has been found in granular inclusions colocalizing with lysosomes in spinal motoneurons of patients with sALS (20). Disease progression in a mouse model is related to the abundance of mutant SOD-1 (3). Oxidized SOD-1 has a similar gain of toxic functions as mutant SOD-1 (21, 22). Both mutant and wild-type SOD-1 inhibit axonal transport (23).
Various epigenetic mechanisms, including DNA methylation [such as hypermethylation of CpG islands in C9orf72 expansion (24)], histone remodeling, abnormal miRNA biogenesis, and other silencing mechanisms have been described in sALS (25). In the CNS, changes in the expression of C9orf72, MATR, and VEGFA are present in affected regions (26). Transcriptional alterations in peripheral blood mononuclear cells (PBMCs) involve the genes B2M, ACTG1, DYNLT1, SKIV2L2, C12orf35, TARDBP, and ILKAP (27). TBK1 was identified as an ALS gene linking autophagy of ubiquitinated proteins with inflammation (28).
Despite the diversity of molecular mechanisms in sALS, a common finding in the disease is an infiltration of the gray matter in affected spinal cord segments by macrophages, CD4 and CD8 T cells, and mast cells (18), demonstrating that both innate and adaptive immune mechanisms are operative in the pathologic course of ALS. Immunopathologic mechanisms include phagocytosis of apoptotic and nonapoptotic neurons by inflammatory macrophages (29), toxicity induced by granzyme-positive CD8 T cells (30), disruption of the blood–brain barrier by Th17 cells (31), and IL-6 trans-signaling (demonstrated to be toxic in a dose-related fashion in the mouse brain) (32). Neuroprotective function declines through inhibition of microglia and T cells by TGF-β (33), decrease in regulatory T cells (34), and lack of trophic factors (35). Blocking accumulation of misfolded SOD-1 in mitochondria by elevating the cytokine macrophage migration inhibitory factor (MIF) enhances neuronal survival (36). In addition, proteomic analysis of cerebrospinal fluid (CSF) samples of patients with sALS, in comparison to control CSF samples, revealed enrichment of proteins related to inflammation (in particular complement components) and decreased levels of proteins related to synaptogenesis and extracellular matrix organization (37).
A study of 5 monozygotic twin pairs discordant in ALS phenotype did not reveal nucleotide differences (38). Another study of monozygotic ALS-discordant twins with the C9orf72 repeat expansion did not find epigenetic modification of the genome (39). In the current study, we investigated by reduced representation bisulfite sequencing (RRBS) the methylome of a monozygotic twin pair that was discordant in the diagnosis of ALS and inferred differences in blood cell type abundances and pathways. Moreover, we hypothesized that a downstream cause of neuronal demise in the affected twin involves the production by macrophages of neurotoxic cytokines stimulated by effector T cells.
MATERIALS AND METHODS
Patients and controls
The immunologic and epigenetic investigation of patients and rat neurons was approved by the University of California, Los Angeles Institutional and Ethics Review Board. The twin pair in the study were monozygotic females 50 yr of age. The ALS twin had onset of ALS in the right arm in the spring of 2011 and subsequently progressed to bulbar involvement, whereas the non-ALS twin was not affected by 2015. Two other patients with sALS are included in the study of neuronal toxicity: a 72-yr-old man and a 56-yr-old woman, both with bulbar onset and upper extremity weakness.
RNA sequencing
RNA-sequencing (RNA-seq) was performed on PBMCs by using standard RNA-seq library construction protocols (Illumina, San Diego, CA, USA). RNA-seq libraries were sequenced on the Illumina HiSeq 2000. Reads were aligned to the hg19 reference genome by using TopHat Johns Hopkins University, Baltimore, MD, USA; https://ccb.jhu.edu/software/tophat/index.shtml) (40). Gene counts were quantified with HTSeq and normalized with DESeq (41, 42).
Expression cell-type signatures
To characterize expression differences between the twins, their gene counts were analyzed using multiple cell-type signatures derived from a human tissue atlas (43). Frozen robust multiarray analysis (fRMA) was used for normalization of the microarray intensity values of the atlas (44). To identify signature genes for each cell type, we calculated the ratio of the median intensity value of a cell type to the median intensity value. The top 50 ranking genes by this metric defined the cell-type–specific expression signature. For each RNA-seq sample, a signature δ expression (SDExp) value between the twins was determined by calculating the arithmetic mean difference of the log10 gene count (X) of the sample to the mean log10 gene count (X) across all genes within a signature.
 |
RRBS
Genomic DNA for making RRBS libraries was extracted from PBMCs according to the standard protocol (45). Genomic DNA was digested with a methylation-insensitive endonuclease, MspI. Fragments of 40–220 bp were isolated, because they are enriched for CpG-rich regions, such as CpG islands, promoter regions, and enhancer elements. The MspI-digested DNA was end repaired, A tailed, and ligated with Illumina adaptors. The double-stranded DNA was denatured, followed by bisulfite conversion and PCR amplification. These libraries were sequenced with Ilumina HiSeq 2000 sequencers (San Diego, CA, USA). The reads were aligned to the reference genome (human hg19) using the modified bisulfite aligner BS Seeker2 (46), and only the uniquely mapped reads were kept. We calculated the methylation level for each cytosine on the genome. Because bisulfite treatment converted unmethylated cytosines (Cs) to thymines (Ts), the methylation level at each cytosine were estimated by #C/(#C+#T), where #C is the number of methylated reads and #T is the number of unmethylated reads. In this study, only cytosines that were covered by at least 4 reads in all samples were included in the subsequent analysis.
Epigenetic cell-type signatures
Cell-type methylation signatures were derived from the data generated by the Blueprint epigenome project (http://www.blueprint-epigenome.eu/) (47). For each cell type, we identified CpG sites that were uniquely hypomethylated compared to the other cell types. The criteria were that these CpG sites had methylation levels <0.3 in the specific cell types of interest, and the methylation was at least 0.5 higher in all other cell types. The Mann-Whitney U test with Bonferroni correction was used to compare the median signature values between the samples. Based on our selection criteria, we established B-cell, NK-cell, T-cell, neutrophil, and CD14+/monocyte (CD14) signatures that consist of 551, 463, 217, 324, and 184 CpG sites respectively (Supplemental Fig. 1A).
Differentially methylated RRBS fragments
Visualization of differentially methylated fragments was performed with the Integrative Genomics Viewer (IGV) (48) (Broad Institute, Cambridge, MA, USA; http://www.broadinstitute.org/igv/). RRBS fragment methylation levels were determined by calculating the mean CpG methylation levels within each fragment. Differentially methylated fragments between the twin samples were restricted to regions that contained at least a single CpG site, with a Fisher’s exact test P < 0.05, and within 100 kb of a gene transcription start site. The fragments were ranked by the difference in fragment methylation between the twin samples.
Genomic Regions Enrichment of Annotations
We tested for enrichment of annotations of genes associated with the top and bottom 1000 differentially methylated fragments using Genomic Regions Enrichment of Annotations Tool (GREAT), and report terms with a false-discovery rate (FDR) < 0.05 from the MSigDB perturbation and MSigDB immunologic signatures (Broad Institute; http://software.broadinstitute.org/gsea/msigdb/index.jsp/) (49). Fragments were ranked by the difference in methylation level between samples. Fragment-to-gene associations were determined based on the single nearest gene within 100 kb, with the whole hg19 genome set as the background.
Genetic screening
DNA samples from the twins were screened using targeted sequencing of genes previously implicated in a series of neurodegenerative disorders, including the ALS genes TARDBP, FUS, SQSTM1, VCP, OPTN, SOD1, CHCHD10, ALS2, MATR3, VAPB, PFN1, TAF15, HNRNPA1, HNRNPA2B1, and DCTN1. Exonic regions for these genes were captured with a custom designed library and sequenced on an Illumina HiSeq 2500. Sequence reads were mapped to the GRCh37/hg19 reference genome, and variants were interactively joint-called with GATK Haplotype Caller according to GATK Best Practices recommendations (https://www.broadinstitute.org/gatk/) (50). The joint variant calling file was annotated with refGene, dbSNP138, functional effect prediction tools, as well as 1000 Genomes, Exome Variant Server, and Exome Aggregation Consortium (ExAC) MAFs, according to Annovar (http://annovar.openbioinformatics.org/). In addition, all samples were screened for the hexanucleotide repeat of C9orf72, using both fluorescent and repeat-primed PCR (51).
Multiplex cytokine assays
The assays included multiplexed immunometric assay panels (Luminex platform; R&D Systems, Minneapolis, MN, USA) for the human cytokines IL1-β, IL-6, IL-8, IL-10, GM-CSF, and TNF-α and TGF-β1, -β2, and -β3 (R&D Systems). The Luminex xMAP system tests multiple analytes simultaneously, using spectrally addressed bead sets, each of which is conjugated with a different capture monoclonal antibody specific for a given target molecule. The antibody-conjugated beads are allowed to react with the sample and a secondary detection antibody, to form a capture sandwich immunoassay. After the assay is completed, the assay solution is drawn into the Bio-Plex 200 Luminex array reader (Bio-Rad, Hercules, CA, USA) to quantify the amount of each of the analytes.
Memory cells analysis
PBMCs were isolated from the healthy donors or patients with ALS by using a Ficoll-Hypaque (GE Healthcare, Pittsburgh, PA, USA) gradient method. PBMCs were surface-stained using anti-CD3 and anti-human CD127 PE, anti-human CD45RA PerCp-Cy5.5, or antihuman CD45RO APC and were analyzed with FlowJo software (TreeStar, Ashland, OR, USA) with lymphocyte gating, based on forward and side scatter.
Antibodies
Anti-human CD127 PE, anti-human CD45RA PerCp-Cy5.5, and anti-human CD45RO APC (Tonbo Biosciences, San Diego, CA, USA); anti-human Foxp3PerCp.Cy5.5 (eBioscience, San Diego, CA, USA); neutralizing IgG1 monoclonal antibody to TNF-α (InvivoGen, San Diego, CA, USA); neutralizing monoclonal human IL-1α antibody (R&D Systems); anti-IL6 receptor α antibody (tocilizumab; Actemra; Genentech, South San Francisco, CA, USA); anti-Neu-N and anti-MAP-2 (EMS-Millipore, Billerica, MA, USA); and goat anti-rabbit Alexa 488 and goat anti- mouse Alexa 555 (Thermo Fisher Scientific Life Sciences, Carlsbad, CA, USA).
Rat primary cortical neurons
All animal use protocols were approved by the University of California, Los Angeles, Chancellor’s Animal Research Committee, and were in compliance with the NIH guidelines. Rat pups (postnatal d 0–1) were euthanized by decapitation, and cortices were dissected on ice in dissection medium [minimum essential medium (MEM)] supplemented with streptomycin (100 μg /ml), penicillin (100 U/ml) and 0.01 M HEPES (pH 7.5). The cortical tissues were digested for 15 min with 1 mg/ml papain, and cells were mechanically dissociated in MEM supplemented with 10% fetal bovine serum (FBS), 0.5% glucose, 2 mM Glutamax (Thermo Fisher Scientific Life Sciences). Cells were then centrifuged for 5 min at 145.2 g, resuspended in feeding medium (MEM supplemented with 5% FBS, 0.1 mg/ml transferrin, 2% B27, 0.5% glucose, 24 mg/L insulin, and 2 mM Glutamax) and plated on poly-d-lysine-coated coverslips (0.05 mg/ml) at a density of 4.5 × 10⁴/cm2. Neurons were incubated at 37°C and 5% CO2 and, 72–96 h after plating, feeding medium was supplemented with 2 μM cytosine and β-d-arabinofuranoside to avoid astrocyte proliferation.
Testing of toxicity to rat neurons
Neurons were cultured on coverslips in 24-well plates. Eight-day in vitro neurons were treated with the PBMC supernatants at the ratio of 3 μl of the supernatant in 300 μl of the medium for 6 h. Anti-IL-1α, anti-TNF-α,, and anti-IL-6R were used in the inhibition studies at a concentration of 2 μg/ml.
Immunofluorescence
Neurons were washed with PBS, fixed with 4% paraformaldehyde, and, after permeabilization with 0.1% Triton X-100 (3 min) and blocking (30 min) with PBS containing 1% FBS and 1% BSA, were immunostained in blocking solution with antibodies against MAP-2 (green dendrites) and NeuN (red perinuclear cytoplasm). Three images were taken from the top, middle, and bottom of each coverslip using the Olympus research microscope with ×40/0.75 objective and a Hamamatsu camera (Hamamatsu City, Japan). The pictures were scanned with Image-Pro software (MediaCybernetics, Rockville, MD, USA).
Statistics
The differences in means and their 95% confidence limits (mean ± 2 sem) of fluorescence intensities were analyzed in 2 experiments with 2 different supernatants by repeated-measures ANOVA pairwise comparison, with adjustment for multiple comparisons. Computations were performed with SPSS for Windows, ver. 20.0 (IBM, Armonk, NY, USA).
RESULTS
Genetic screening
To demonstrate lack of genetic differences between the twins discordant for ALS, the coding regions of 15 genes previously implicated in ALS were screened in both individuals. Both individuals shared common (ExAC MAF > 30%) coding variants within the ALS (2 synonymous and 1 nonsynonymous), FUS (2 synonymous), OPTN (1 nonsynonymous), SQSTM1 (2 synonymous), and CHCHD10 (2 synonymous) genes. They also shared one rare (ExAC MAF = 0.8%), nonsynonymous DCTN1 variant (NM[lowen]001135041: c.A184G, p.I62V) predicted to be benign. These individuals carried repeats within the normal range for the C9orf72 hexanucleotide repeat.
Analysis of cell types in monozygotic twins
We used the RRBS technique to profile the methylomes of the monozygotic twins. Blood specimens were obtained from the ALS twin in November 2013 and August 2014 and from the healthy twin in November 2013 and December 2014. The RRBS approach allowed us to measure ∼2 million CpG sites in the genome, representing ∼7% of the total. Because of the sequence preference of the MSPI enzyme used to digest the genome, we preferentially selected sites that are within CpG islands, promoters, and enhancers. We only kept sites with at least 10× the coverage across all samples, leaving us with a total of 2,168,334 sites.
Two effects can cause DNA methylation differences between the twins: 1) changes in cell type composition in their PBMCs, and 2) changes in the methylation of specific cell types in activated vs. resting states. We first analyzed the changes that were related to differences in cell-type composition between the twins, by using the methylome data collected for different hematopoietic cell types by the Blueprint Consortium (Supplemental Fig. 1A). In brief, for each cell type, we identified the sites that fell within RRBS fragments that were uniquely demethylated in one cell type with respect to all the others. These signatures were then used as a proxy for the abundance of those cell types within the PBMCs as follows: lower average signature methylation implies that the cell type is more abundant, whereas higher levels indicate lower abundance.
We measured the differences in the cell-type signature in the twin PBMC samples collected in 2013 and 2014. We observed that the cell-type signatures were not significantly different between the twins in the 2013 samples, but the difference became significant in 2014 (Fig. 1). Specifically, we found that T- and NK-cell signatures were significantly higher in the ALS twin, indicating that these cell types were less abundant in the affected twin. In contrast, we found that the CD14 monocyte signature was significantly lower in the ALS twin (P < 0.001), suggesting that the affected twin had significantly higher levels of monocytes. We did not detect significant changes in the neutrophil and B-cell signatures, suggesting that these cell types did not vary between the twins (Fig. 1).
Figure 1.

Methylation distribution at cell-type–specific CpG sites in the PBMC samples from ALS-discordant twins. Methylation-level box plots for the PBMC samples obtained in 2013 (box 1: November 6, 2013; box 2: November 6, 2013) and 2014 (box 3: August 21, 2014; box 4: December 8, 2014) at T-cell–specific (A), CD14-specific (B), NK+-specific (C), neutrophil-specific (D), and B-cell–specific (E) CpG sites. Blue: healthy twin; red: ALS-affected twin. The inner band of the box plot marks the median methylation value of the of the sample, with the lower and upper bounds of the box marking the first and third quartiles. The Bonferroni-adjusted P values were calculated to test for differences in the methylation level distribution between samples; the Mann-Whitney U test was used to analyze the differences between the twins in the 2013 and 2014 samples and in the batches from the unaffected and affected twins.
Differentially methylated RRBS fragments include immune-related regions
Considering that DNA methylation changes may be caused by activation of immune cells, we also directly compared the methylomes of the twins, to identify the regions with the most significant differential methylation. Using this approach, we identified 20 top and bottom fragments of the pooled samples ranked by the difference in fragment methylation (Fig. 2A). The genes proximal to the differentially methylated fragments included immunity-related genes, such as EGFR, TGFb1, and TNFRSF11A. Specifically, we found that the fragment on chr18, at position 60,051,935–60,052,123, and 59,481 bp downstream of the TNFRSF11A transcription start site, had an increase in fully methylated reads in the ALS twin (Fig. 2B). On the contrary, the fragment on chr7 (55,073,097–55,073,297), which is 13,597 bp upstream of the EGFR transcription start site, had an increase in unmethylated reads in the ALS twin compared to the unaffected twin at both the 2013 and 2014 samples (Supplemental Fig. 3A). The fragment on chromosome 19 (41,831,930–41,832,049) had an increase in methylated reads in the ALS-affected twin compared with the unaffected twin at both the 2013 and 2014 samples (Supplemental Fig. 3B). An unpooled analysis intersecting the top 50 differentially methylated fragments high in ALS from 2013 and 2014 identified fragments associated with GNG13, VPS53, EMC10, PAX8, TRPC3, and EGFR as consistently differentially methylated in both the 2013 and 2014 samples (Supplemental Fig. 4A). Similarly, the intersection of the bottom 50 differentially methylated fragments low in ALS from 2013 and 2014 identified fragments associated with CCKBR, TNFRSF11A, TGFB1, POFUT1, and GMEB2 to be consistently differentially methylated in both 2013 and 2014 samples (Supplemental Fig. 4B).
Figure 2.

Differentially methylated RRBS fragments and associated genes in the PBMC samples from ALS-discordant twins. A) Delta methylation of the top 20 and bottom 20 fragments within 100 kb of a reference gene (RefGene) transcription start site. The top 20 and bottom 20 fragments were determined by pooling the 2013 and 2014 PBMC RRBS sample reads by individual. Individual CpG sites were filtered for a minimum coverage of 10 times common across the 4 samples (2,168,334 sites). The CpG methylation counts were pooled within replicates, and fragment-level methylation was determined by taking the mean CpG methylation within the fragment. The fragments were filtered for fragments with 1 or more CpGs that are significantly different in methylation level between the twins with a Fisher’s exact test, P < 0.05. The fragments were ranked by the difference in fragment methylation (Δ methylation) of the affected twin to the unaffected twin and contained a minimum of a single CpG, which tested for differential methylation between the twins with a 2-sided Fisher’s exact test, P < 0.05. Differentially methylated CpG sites were subsequently mapped to the mappable RRBS fragments. B) Visualization of the aligned RRBS reads to the fragment chr18:60,051,935–60,052,123 that spans exon 10 of the TNFRSF11A gene. The dotted lines in the non-ALS (2013) plot represent individual reads that aligned to the chr18 fragment within the TNFRSF11A gene body. The circles on each line represent individual CpG sites along the read. Filled circle: methylated CpG; open circle: unmethylated CpG. Within the fragment, the non-ALS (2013), non-ALS (2014), ALS (2013), and ALS (2014) samples had 63.5, 69.36, 92.73, and 88.34% of the aligned CpGs methylated, respectively.
Specific pathways associated with epigenetic changes differentiate the twins
To determine whether the genes that are proximal to the differentially methylated regions are associated with specific pathways or functional terms, we used the GREAT tool as previously described. The differentially methylated fragments in the 2013 ALS twin’s samples were associated with the genes that are up-regulated in acute promyelocytic leukemia (APL) cells in response to tretinoin (retinoic acid or vitamin A) and with the genes associated with H3K27me3 markers (Table 1). The differentially methylated fragments in the 2014 samples also include both tretinoin terms and H3K27me3. However, the differentially methylated fragments from the 2014 samples also include gene sets from MSigDB immunologic signatures that are associated with differences between blood cell types (e.g., genes down-regulated in comparison to monocytes treated with anti-TREM-1 vs. monocytes treated with a vehicle) (Table 2), reinforcing the hypothesis that a portion of the differences in methylation is because of the changes in cell-type abundances discussed above.
TABLE 1.
DNA Methylation differences between the twins related to the H3K27me3 marker
| Ontology | Enriched terms of differentially methylated fragments (2013) | Binomial FDR q | Observed gene hits (n) | Total genes (n) |
|---|---|---|---|---|
| Low methylation in ALS | ||||
| MSigDB perturbation | Genes up-regulated in NB4 cells (APL) in response to tretinoin (PubChem 444795); based on ChIP-seq data | 5.11E-30 | 111 | 781 |
| MSigDB perturbation | Genes with high-CpG-density promotors (HCPs) bearing a histone H3 trimethylation marker at K27 (H3K27me3) in MEF cells (embryonic fibroblast) | 5.30E-23 | 87 | 573 |
| High methylation in ALS | ||||
| MSigDB perturbation | Genes up-regulated in NB4 cells (APL) in response to tretinoin (PubChem 444795); based on ChIP-seq data | 2.61E-33 | 101 | 781 |
| MSigDB perturbation | Genes with HCPs bearing the trimethylation marker, at H3K27 (H3K27me3) in MCV6 cells (embryonic fibroblasts trapped in a differentiated state) | 1.51E-27 | 70 | 418 |
Top and bottom 1000 differentially methylated fragments ranked by the difference in fragment methylation between the ALS twin and the unaffected twin 2013 samples were subjected to GREAT enrichment testing in the MSigDB perturbation and MSigDB immunologic signatures. The 5 most enriched terms for each ontology are reported, with a minimum FDR < 0.05.
TABLE 2.
MSigDB immunologic signatures associated with differences between blood cell types
| Ontology | Enriched terms of differentially methylated fragments (2014) | Binomial FDR q | Observed gene hits (n) | Total genes (n) |
|---|---|---|---|---|
| Low methylation in ALS | ||||
| MSigDB perturbation | Genes up-regulated in NBA cells (APL) in response to tretinoin (PubChem 444795); based on ChIP-seq data | 3.39E-08 | 124 | 781 |
| MSigDB perturbation | Genes up-regulated in the human mammary epithelial cells upon expression of TP53 (GeneID 7157) off adenoviral vector | 3.30E-08 | 156 | 1065 |
| MSigDB immunologic signatures | Genes down-regulated in comparison of monocytes treated with 1 ng/ml LPS (TLR4 agonist) vs. monocytes treated with vehicle. | 2.25E-03 | 38 | 192 |
| MSigDB immunologic signatures | Genes down-regulated in comparison of healthy CD4 (GeneID 920) T cells vs. healthy myeloid cells | 1.44E-03 | 38 | 197 |
| MSigDB immunologic signatures | Genes down-regulated in comparison of monocytes treated with anti-TREM1 (GeneID 54210) vs. monocytes treated with vehicle | 1.28E-03 | 38 | 193 |
| MSigDB immunologic signatures | Genes down-regulated in comparison to healthy B cells vs. healthy myeloid cells | 1.88E-02 | 35 | 198 |
| MSigDB immunologic signatures | Genes up-regulated in comparison of dendritic cells vs. central memory CD4 (GeneID 920) T cells | 2.64E-02 | 34 | 197 |
| High methylation in ALS | ||||
| MSigDB perturbation | Genes up-regulated in NB4 cells (APL) in response to tretinoin (PubChem 444795); based on ChIP-seq data | 1.59E-08 | 111 | 781 |
| MSigDB perturbation | Genes with high-CpG-density promoters (HCPs) bearing the trimethylation marker at H3K27 (H3K27me3) in MCV6 cells (embryonic fibroblasts trapped in a differentiated state) | 2.58E-08 | 71 | 418 |
| MSigDB perturbation | Genes within amplicon 16p13 identified in a study of 191 breast tumor samples. | 5.91E-03 | 22 | 110 |
| MSigDB perturbation | Genes up-regulated in comparison of naive CD4 (GeneID 920) T cells vs. d 0 monocytes | 4.01E-02 | 30 | 187 |
Top and bottom 1000 differentially methylated fragments ranked by the difference in fragment mediation between the ALS twin and the unaffected twin 2014 samples were subjected to GREAT for enrichment testing in the MSigDB perturbation and MSigDB immunologic signatures. The 5 most enriched terms for each ontology are reported, with a minimum FDR < 0.05.
Differential mRNA expression supports cell-type abundance changes in PBMCs
Along with the extraction of DNA for RRBS analysis, we also extracted RNA from the PBMCs of both the twins. Using the rationale presented above, the differences in gene expression between the twins may be caused either by the changes in cell-type abundances or by the changes in the activation state of the immune cells. We investigated these possibilities by gathering gene expression signatures that were specific to individual cell types as previously described. For each sample, we computed the average log expression of the genes within the signatures: a higher score implied a higher abundance of that cell type and a lower score signified a lower abundance. We compiled signatures several of immune cells in both resting and activated states.
To interpret the differences in gene expression between the twins, we examined the difference in the average signature expression value between the affected and unaffected twins across multiple cell-type signatures (Fig. 3A). We found that among the 13 expression signatures, only the dendritic cell signature reveals a significant difference between the twins.
Figure 3.
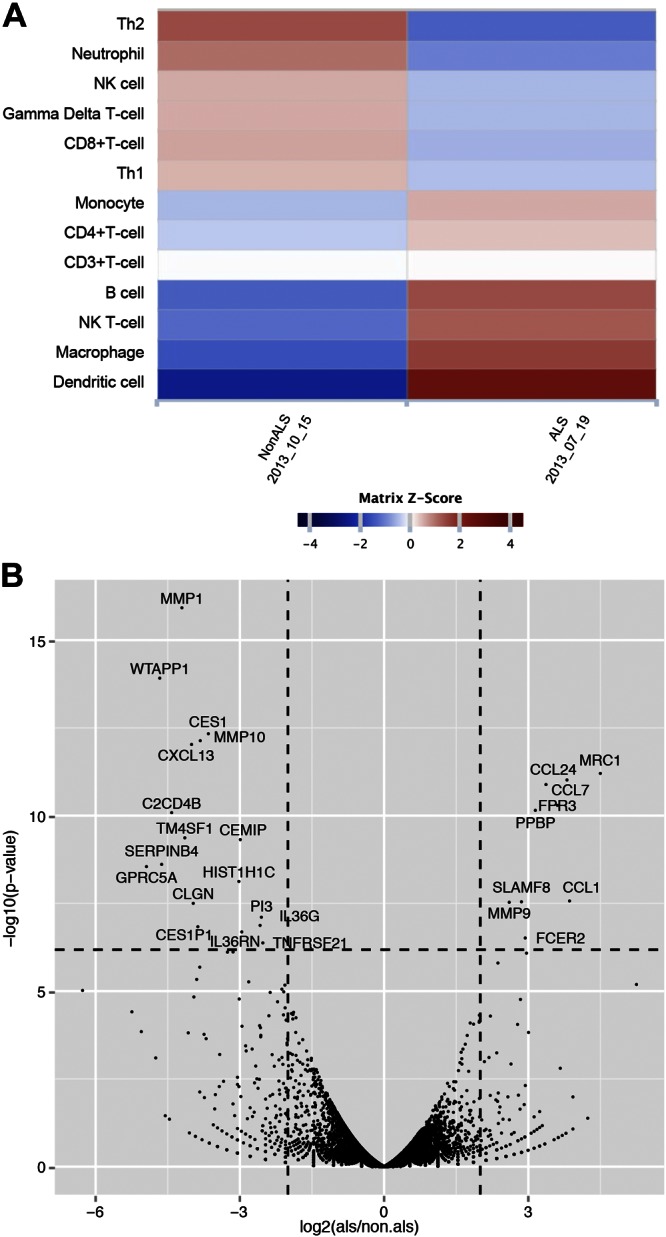
Differences in expression signatures between the twins. A) Heat map of the z scores for the signature Δ expression levels. Left column: signature Δ z score for the non-ALS PBMC sampled on October 15, 2013; right column: signature Δ z score for the ALS PBMCs sampled on July 19, 2013. Red: higher signature expression level vs. the mean Δ. Blue: lower signature expression level vs. the mean Δ. Among the 13 expression signatures, the dendritic cell signature z score reveals a significant difference from the matrix mean. B) A volcano plot of the 15,152 normalized gene count. Differences between the twins in gene expression are shown as log2 on the horizontal axis. The significance of differentially expressed genes is shown on the vertical axis, with a minimum Bonferroni corrected −log10, P = 6.18.
We also examined the most differentially expressed genes between the twins (Fig. 3B). We observed that the genes with both significant fold changes and P values for those changes are strongly enriched for chemokines and metalloproteases (Table 3).
TABLE 3.
Comparison between most differentially expressed genes in the twins
| Category | Terms associated with differentially expressed genes | Count | List total | FDR |
|---|---|---|---|---|
| UP_SEQ_FEATURE | Disulfide bond | 16 | 21 | 2.73E-06 |
| SP_PIR_KEYWORDS | Chemotaxis | 6 | 21 | 9.80E-06 |
| INTERPRO | Small chemokine, IL-8-like | 5 | 21 | 1.42E-04 |
| GOTERM_MF_FAT | Chemokine activity | 5 | 16 | 1.70E-04 |
PBMCs of the ALS twin produce high concentrations of IL-6, TNF-α, and IL-1
The alterations in monocyte and T-cell abundances between the twins suggest that altered immune cell interactions in the ALS twin could explain the increased cytotoxicity by macrophages in the ALS spinal cord. To investigate this hypothesis, PBMCs of the twins were incubated overnight, and cytokines were measured in the supernatant. The PBMCs of the ALS twin, but not those of the non-ALS twin, spontaneously produced the inflammatory cytokines IL-1, IL-6, and TNF-α in the supernatant in nanogram per milliliter concentrations (Fig. 4B). In addition, IL-6, in nanogram per milliliter concentrations, was produced by macrophages of the ALS twin (Fig. 4C). Stimulation by SOD-1 increased cytokine production by non-ALS twin’s PBMCs to 50% level in the ALS twin, and stimulation by SOD-1 in the presence of the mismatched ALS twin’s serum strongly potentiated the cytokine production. Stimulation by SOD-1 and tocilizumab increased IL-6 production by PBMCs of both twins. Only picogram per milliliter concentrations of IL-10 and -17 were produced in PBMCs after overnight incubation.
Figure 4.

Cytokine concentrations in the twins. Cytokines in the 2014 twin samples. A) Serum cytokines: only picogram per milliliter concentrations of cytokine with equal concentrations of IL-6 in both twins. B) PBMC supernatant cytokines: up to 10 ng/ml concentrations of IL-6 in PBMC supernatants of the ALS twin in the absence or presence of SOD-1 or tocilizumab with matched or with mismatched serum; substantial IL-6 concentrations in the PBMC supernatants of the non-ALS twin were present only with SOD-1 stimulation; other cytokines, GM-CSF, IL10, IL-1β and TNF-α showed similar differences. C) Macrophage supernatant cytokines: up to 2 ng/ml of IL-6 in the supernatants of the ALS twin’s macrophages, with or without SOD-1 or tocilizumab stimulation with matched or with mismatched serum; no IL-6 produced by non-ALS macrophages; and TNF-α, IL-10, and IL-1β were produced in negligible amounts.
Memory and effector T cells in the ALS twin
The strong spontaneous production of inflammatory cytokines by the ALS twin’s, but not the healthy twin’s, PBMCs suggested the presence of effector T cells only in the ALS twin. Flow cytometric testing showed a higher ratio of CD45RO/RA and a lower proportion of the CD127 memory T cells in the ALS twin (Table 4).
TABLE 4.
Memory vs. effector T cells in the twins
| Patient | Ratio of CD45RO:CD45RA | CD127 (%) |
|---|---|---|
| ALS twin | 36.5/20 = 1.8 | 32.4 |
| Healthy twin | 63.4/46.6 = 1.3 | 63.5 |
Neurotoxic cytokines in the ALS PBMC supernatants
Given the high concentrations of inflammatory cytokines produced by the ALS twin’s PBMCs and macrophages, we investigated induction of neuronal toxicity by PBMC supernatants. In an in vitro assay of rat cortical neurons, the supernatants of the ALS twin’s PBMCs, but not of the non-ALS twin’s, caused attrition of neurites revealed by diminished staining with MAP-2 antibody and increasing neuronal destruction. The results of 2 experiments in 2 different rat neuronal cultures with 2 different ALS and non-ALS PBMC supernatants showed destruction of neurons exposed to the ALS twin’s supernatants, but not the nonaffected twin’s supernatants (Fig. 5A).The difference in MAP-2 mean fluorescence intensities between the neurons exposed to the twin supernatants was analyzed by pairwise comparison by using repeated-measures ANOVA with adjustment for multiple comparisons with significant results (P < 0.001) (Fig. 5B). In another experiment, the effects of antibodies to cytokines on neurotoxicity by the ALS twin’s supernatant were compared. Tocilizumab, the blocking antibody to the IL-6 α receptor, produced the strongest protection, and IL-1β and TNF-α antibodies afforded lower protection [all pairwise comparisons by ANOVA repeated-measures after adjustment for multiple comparisons were significant (P < 0.001)]. Finally, neuronal toxicities of PBMC supernatants from 2 other ALS patients were tested and compared to the twins’ supernatants. One patient had toxic supernatant with activity comparable to the ALS twin’s. The other patient with ALS did not have neurotoxic supernatant, as the activity of his activity was equal to that of the non-ALS twin’s in the same experiment.
Figure 5.

Toxicities of ALS PBMC supernatants to rat neurons. A) Fluorescence microscopy of rat neurons exposed to PBMC supernatants. Rat cortical neurons 8 d in vitro were exposed to the indicated supernatant (sup) for 6 h (5 μl in 300 μl/well). Neurons were then fixed and immunostained with anti-MAP2 (green dendrites) and anti-NeuN (red neuronal bodies). B) Integrated optical density (IOD) of the MAP-2 green fluorescence (determined by Image-Pro): left to right: a comparison of IOD in neurons exposed to the supernatant from each twin; comparison of IOD in neurons treated with the ALS twin’s supernatant and antibodies to cytokines; comparison of IOD in neurons exposed to the supernatants from 2 other ALS patients and the twins. All comparisons are significant; P < 0.001.
DISCUSSION
Twins with the same genetic background, including common coding variants implicated in ALS, but different ALS phenotypes, differ in the abundance of blood cell types and regulation of inflammatory signaling resulting in increased production of neurotoxic cytokines from the ALS twin’s PBMCs and macrophages. The neurotoxicity of ALS twin’s supernatants was inhibited by IL-6 receptor and TNF-α antibodies.
We used a novel approach to estimate cell-type abundances using DNA methylation data. This method determines the methylation of specific cytosines that are found to be demethylated in only one hematopoietic cell type and hypermethylated in all others. Using this approach, we found that the ALS twin had comparable T-cell and monocyte composition when compared with the unaffected twin in 2013. The T-cell composition decreased as the monocyte composition increased over the course of the disease by 2014 (Fig. 1). These changes may account for altered interactions between T cells, macrophages, and dendritic cells that could lead to production of the inflammatory cytokines IL-1β, IL-6, and TNF-α (Fig. 4). The testing of transcriptional signature by RNA-seq largely supports the conclusion from the DNA methylation data that the affected twin loses T cells and gains monocytes during the course of the disease when compared to the unaffected twin (Fig. 3).
We also observed that the DNA methylation differences between the twins involved genes related to cell signaling, including hypermethylation of TNFRSF11A in the ALS twin and hypomethylation of EGFR in the ALS twin (Fig. 2). TNFRSF11A encodes a member of the TNF-receptor superfamily named tumor necrosis factor receptor superfamily member 11A, which interacts with various adaptor TRAF family proteins and induces activation of NF-κB and MAPK/JNK inflammatory pathways (52, 53). EGFR encodes a glycoprotein cell-surface receptor for members of the epidermal growth factor (EGF) family. The downstream signaling proteins from this receptor initiate several signal transduction cascades, principally the RAS-RAF-MEK-ERK, Akt, PLC-γ, and STATs pathways. EGFR inhibitors influence adaptive immune responses by altering immune gene expression (54), and EGFR participates in the down-regulation of immune responses by Foxp3+ regulatory T cells (55). EGFR has an inhibitory function on neurite outgrowth, which could be important in the ALS twin (56).
We found that the pathways associated with genes that are proximal to DNA methylation differences between the twins were related to the gene set’s response to tretinoin (vitamin A) and H3K27me3 markers (Table 1). This finding suggests that the activities of both vitamin A and the histone methyltransferase polycomb group repressor complex (PGRC)-2 could be increased in the ALS twin. PGRC2 is associated with the methylation of H3K27me3 and repression of transcription, typically during developmental processes or cellular differentiation (57). It has been shown that vitamin A induces MMP9 in macrophages and increases macrophage phagocytosis (58). Indeed, MMP9 was up-regulated in the ALS twin (Fig. 3B) who also displayed increased transcription of the genes related to immune cell migration and activation, including the metalloproteinase MMP9, the chemokines CCL1 and -7 that attract monocytes, the receptor FPR3 for monocytes, and the mannose receptor MRC1 (CD206) on proresolving macrophages.
In animal models, the SOD-1-stimulated microglia-derived neurotoxic factors have been largely unidentified but are thought to involve excessive glutamate release (59). In the current study, we have found production of neurotoxic levels of inflammatory cytokines, in particular IL-6 and TNF-α, by the ALS twin’s PBMCs and macrophages. The levels of IL-6 produced by macrophages were 5 times lower than those produced by PBMCs, suggesting that the interactions between effector T cells and macrophages are necessary for high IL-6 production. Tocilizumab increased IL-6 production, because it inhibits internalization of IL-6 (60). That finding notwithstanding, tocilizumab blockade of IL-6 signaling is anticipated to have therapeutic benefits in a current clinical trial of the drug.
The cells of the healthy twin required stimulation by SOD-1 for production of these cytokines, suggesting the presence of memory but not effector T cells. The PBMCs of the ALS twin had a higher CD45RO/RA ratio (Table 3), suggesting increased central and effector memory T-cell subset (61) and decreased CD127 proportion, indicative of an increased proportion of effector T cells (62) in the ALS twin. Macrophages of sALS patients (differentiated in vitro in autologous serum) showed increased inflammatory activation with progression of the disease (data not shown) compatible with stimulation by effector T cells.
The PBMC supernatants from the ALS twin containing IL-1, IL-6, and TNF-α caused demise of rat motor neurons, which was strongly inhibited by the antibody to the IL-6 receptor and less so by the antibodies to IL-1β and TNF-α. IL-6 signaling in a mouse model is known to cause neuropathology in a concentration-dependent fashion (32). In addition, IL-6 and TGF-β participate in the expression of IL-17A on CD8 T cells and mast cells in the affected spinal cord (18). Finally, we demonstrated the presence of infiltrating macrophages enclosing fragmented motor neurons in the ALS spinal cord. The epigenetic and transcriptional differences between the twins and higher abundance of IL-6- and TNF-α-producing macrophages in the ALS twin may account for their different phenotypes. The putative but heterogeneous role of neurotoxic cytokines was highlighted in 2 other sALS patients, one with and the other without neurotoxic cytokines. Our recent study of immune pathways in PBMCs of 9 sALS patients revealed that patients cluster into an inflammatory subset with an inflammatory Th1/Th17 signature and a noninflammatory subset with a B-cell signature (63). We propose that RNA sequencing offers an approach to the selection of ALS patients for different anti-inflammatory therapies.
AUTHOR CONTRIBUTIONS
M. Fiala and M. Pellegrini designed the research; L. Lam, L. Chin, R. C. Halder, B. Sagong, S. Famenini, and L. Rubbi performed the research; L. Lam, J. Sayre, D. Montoya, M. Pellegrini, and M. Fiala analyzed the data; and M. Fiala, L. Lam, and M. Pellegrini wrote the paper.
Supplementary Material
ACKNOWLEDGMENTS
The authors thank Giovanni Coppola for genetic screening of the twins, Anna Caputo for testing toxicities of PBMC supernatants in rat neurons, Julian Whitelegge for fibrillary wild-type SOD-1, Larry Magpantay for testing cytokines, and Elizabeth Rigali (all from UCLA School of Medicine) for assistance with manuscript preparation. Funding was provided by U.S. National Institutes of Health (NIH) National Institute of Human Genome Research Grant T32 HG008553-01 (to L.M.) and NIH National Institute of Arthritis and Musculoskeletal and Skin Diseases Grant 3P50AR063020-03S1 (to D.M.). M.F. was supported by and received paid travel to meetings from Genentech, Inc. (South San Francisco, CA, USA), and honoraria and paid travel from Smartfish AS (Oslo, Norway).
Glossary
- ALS
amyotrophic lateral sclerosis
- APL
acute premyelocytic leukemia
- ChIP-seq
chromatin immunoprecipitation sequencing
- CSF
cerebrospinal fluid
- EGF
epidermal growth factor
- ExAC
Exome Aggregation Consortium
- FBS
fetal bovine serum
- FUS
RNA binding protein fused in sarcoma/translocated in liposarcoma
- GREAT
Genomic Regions Enrichment of Annotations Tool
- IOD
integrated optical density
- MAF
minor allele frequency
- MEM
minimal essential medium
- MIF
migration inhibitory factor
- PBMC
peripheral blood mononuclear cell
- PGRC
polycomb group repressor complex
- RNA-seq
RNA sequencing
- RRBS
reduced representation bisulfite sequencing
- sALS
sporadic ALS
- SDExp
signature delta expression
- SOD
superoxide dismutase
- TAR
transactive response
- TDP
TAR DNA-binding protein
Footnotes
This article includes supplemental data. Please visit http://www.fasebj.org to obtain this information.
REFERENCES
- 1.Andersen P. M., Al-Chalabi A. (2011) Clinical genetics of amyotrophic lateral sclerosis: what do we really know? Nat. Rev. Neurol. 7, 603–615 [DOI] [PubMed] [Google Scholar]
- 2.Vucic S., Rothstein J. D., Kiernan M. C. (2014) Advances in treating amyotrophic lateral sclerosis: insights from pathophysiological studies. Trends Neurosci. 37, 433–442 [DOI] [PubMed] [Google Scholar]
- 3.Peters O. M., Ghasemi M., Brown R. H. Jr (2015) Emerging mechanisms of molecular pathology in ALS. J. Clin. Invest. 125, 1767–1779 [DOI] [PMC free article] [PubMed] [Google Scholar]
- 4.Neumann M., Sampathu D. M., Kwong L. K., Truax A. C., Micsenyi M. C., Chou T. T., Bruce J., Schuck T., Grossman M., Clark C. M., McCluskey L. F., Miller B. L., Masliah E., Mackenzie I. R., Feldman H., Feiden W., Kretzschmar H. A., Trojanowski J. Q., Lee V. M. (2006) Ubiquitinated TDP-43 in frontotemporal lobar degeneration and amyotrophic lateral sclerosis. Science 314, 130–133 [DOI] [PubMed] [Google Scholar]
- 5.Li Y. R., King O. D., Shorter J., Gitler A. D. (2013) Stress granules as crucibles of ALS pathogenesis. J. Cell Biol. 201, 361–372 [DOI] [PMC free article] [PubMed] [Google Scholar]
- 6.Cooper-Knock J., Higginbottom A., Stopford M. J., Highley J. R., Ince P. G., Wharton S. B., Pickering-Brown S., Kirby J., Hautbergue G. M., Shaw P. J. (2015) Antisense RNA foci in the motor neurons of C9ORF72-ALS patients are associated with TDP-43 proteinopathy. Acta Neuropathol. 130, 63–75 [DOI] [PMC free article] [PubMed] [Google Scholar]
- 7.Kawamata T., Akiyama H., Yamada T., McGeer P. L. (1992) Immunologic reactions in amyotrophic lateral sclerosis brain and spinal cord tissue. Am. J. Pathol. 140, 691–707 [PMC free article] [PubMed] [Google Scholar]
- 8.Graves M. C., Fiala M., Dinglasan L. A., Liu N. Q., Sayre J., Chiappelli F., van Kooten C., Vinters H. V. (2004) Inflammation in amyotrophic lateral sclerosis spinal cord and brain is mediated by activated macrophages, mast cells and T cells. Amyotroph. Lateral Scler. Other Motor Neuron Disord. 5, 213–219 [DOI] [PubMed] [Google Scholar]
- 9.Henkel J. S., Engelhardt J. I., Siklós L., Simpson E. P., Kim S. H., Pan T., Goodman J. C., Siddique T., Beers D. R., Appel S. H. (2004) Presence of dendritic cells, MCP-1, and activated microglia/macrophages in amyotrophic lateral sclerosis spinal cord tissue. Ann. Neurol. 55, 221–235 [DOI] [PubMed] [Google Scholar]
- 10.McGeer P. L., McGeer E. G. (2002) Inflammatory processes in amyotrophic lateral sclerosis. Muscle Nerve 26, 459–470 [DOI] [PubMed] [Google Scholar]
- 11.Turner M. R., Goldacre R., Ramagopalan S., Talbot K., Goldacre M. J. (2013) Autoimmune disease preceding amyotrophic lateral sclerosis: an epidemiologic study. Neurology 81, 1222–1225 [DOI] [PMC free article] [PubMed] [Google Scholar]
- 12.Boillée S., Vande Velde C., Cleveland D. W. (2006) ALS: a disease of motor neurons and their nonneuronal neighbors. Neuron 52, 39–59 [DOI] [PubMed] [Google Scholar]
- 13.Yamanaka K., Chun S. J., Boillee S., Fujimori-Tonou N., Yamashita H., Gutmann D. H., Takahashi R., Misawa H., Cleveland D. W. (2008) Astrocytes as determinants of disease progression in inherited amyotrophic lateral sclerosis. Nat. Neurosci. 11, 251–253 [DOI] [PMC free article] [PubMed] [Google Scholar]
- 14.Heath P. R., Shaw P. J. (2002) Update on the glutamatergic neurotransmitter system and the role of excitotoxicity in amyotrophic lateral sclerosis. Muscle Nerve 26, 438–458 [DOI] [PubMed] [Google Scholar]
- 15.Kang S. H., Li Y., Fukaya M., Lorenzini I., Cleveland D. W., Ostrow L. W., Rothstein J. D., Bergles D. E. (2013) Degeneration and impaired regeneration of gray matter oligodendrocytes in amyotrophic lateral sclerosis. Nat. Neurosci. 16, 571–579 [DOI] [PMC free article] [PubMed] [Google Scholar]
- 16.Persidsky Y., Gendelman H. E. (2003) Mononuclear phagocyte immunity and the neuropathogenesis of HIV-1 infection. J. Leukoc. Biol. 74, 691–701 [DOI] [PubMed] [Google Scholar]
- 17.Zaghi J., Goldenson B., Inayathullah M., Lossinsky A. S., Masoumi A., Avagyan H., Mahanian M., Bernas M., Weinand M., Rosenthal M. J., Espinosa-Jeffrey A., de Vellis J., Teplow D. B., Fiala M. (2009) Alzheimer disease macrophages shuttle amyloid-beta from neurons to vessels, contributing to amyloid angiopathy. Acta Neuropathol. 117, 111–124 [DOI] [PMC free article] [PubMed] [Google Scholar]
- 18.Fiala M., Chattopadhay M., La Cava A., Tse E., Liu G., Lourenco E., Eskin A., Liu P. T., Magpantay L., Tse S., Mahanian M., Weitzman R., Tong J., Nguyen C., Cho T., Koo P., Sayre J., Martinez-Maza O., Rosenthal M. J., Wiedau-Pazos M. (2010) IL-17A is increased in the serum and in spinal cord CD8 and mast cells of ALS patients. J. Neuroinflammation 7, 76–90 [DOI] [PMC free article] [PubMed] [Google Scholar]
- 19.Lang L., Zetterström P., Brännström T., Marklund S. L., Danielsson J., Oliveberg M. (2015) SOD1 aggregation in ALS mice shows simplistic test tube behavior. Proc. Natl. Acad. Sci. USA 112, 9878–9883 [DOI] [PMC free article] [PubMed] [Google Scholar]
- 20.Forsberg K., Jonsson P. A., Andersen P. M., Bergemalm D., Graffmo K. S., Hultdin M., Jacobsson J., Rosquist R., Marklund S. L., Brännström T. (2010) Novel antibodies reveal inclusions containing non-native SOD1 in sporadic ALS patients. PLoS One 5, e11552 [DOI] [PMC free article] [PubMed] [Google Scholar]
- 21.Kabashi E., Valdmanis P. N., Dion P., Rouleau G. A. (2007) Oxidized/misfolded superoxide dismutase-1: the cause of all amyotrophic lateral sclerosis? Ann. Neurol. 62, 553–559 [DOI] [PubMed] [Google Scholar]
- 22.Guareschi S., Cova E., Cereda C., Ceroni M., Donetti E., Bosco D. A., Trotti D., Pasinelli P. (2012) An over-oxidized form of superoxide dismutase found in sporadic amyotrophic lateral sclerosis with bulbar onset shares a toxic mechanism with mutant SOD1. Proc. Natl. Acad. Sci. USA 109, 5074–5079 [DOI] [PMC free article] [PubMed] [Google Scholar]
- 23.Bosco D. A., Morfini G., Karabacak N. M., Song Y., Gros-Louis F., Pasinelli P., Goolsby H., Fontaine B. A., Lemay N., McKenna-Yasek D., Frosch M. P., Agar J. N., Julien J. P., Brady S. T., Brown R. H. Jr (2010) Wild-type and mutant SOD1 share an aberrant conformation and a common pathogenic pathway in ALS. Nat. Neurosci. 13, 1396–1403 [DOI] [PMC free article] [PubMed] [Google Scholar]
- 24.Xi Z., Zinman L., Moreno D., Schymick J., Liang Y., Sato C., Zheng Y., Ghani M., Dib S., Keith J., Robertson J., Rogaeva E. (2013) Hypermethylation of the CpG island near the G4C2 repeat in ALS with a C9orf72 expansion. Am. J. Hum. Genet. 92, 981–989 [DOI] [PMC free article] [PubMed] [Google Scholar]
- 25.Paez-Colasante X., Figueroa-Romero C., Sakowski S. A., Goutman S. A., Feldman E. L. (2015) Amyotrophic lateral sclerosis: mechanisms and therapeutics in the epigenomic era. Nat. Rev. Neurol. 11, 266–279 [DOI] [PubMed] [Google Scholar]
- 26.Jones A. R., Troakes C., King A., Sahni V., De Jong S., Bossers K., Papouli E., Mirza M., Al-Sarraj S., Shaw C. E., Shaw P. J., Kirby J., Veldink J. H., Macklis J. D., Powell J. F., Al-Chalabi A. (2015) Stratified gene expression analysis identifies major amyotrophic lateral sclerosis genes. Neurobiol. Aging 36, 2006.e1–2006.e9 [DOI] [PubMed] [Google Scholar]
- 27.Baciu C., Thompson K. J., Mougeot J. L., Brooks B. R., Weller J. W. (2012) The LO-BaFL method and ALS microarray expression analysis. BMC Bioinformatics 13, 244 [DOI] [PMC free article] [PubMed] [Google Scholar]
- 28.FALS Sequencing Consortium (2015) Exome sequencing in amyotrophic lateral sclerosis identifies risk genes and pathways. Science 347, 1436–1441 [DOI] [PMC free article] [PubMed] [Google Scholar]
- 29.Fiala M., Mizwicki M. T., Weitzman R., Magpantay L., Nishimoto N. (2013) Tocilizumab infusion therapy normalizes inflammation in sporadic ALS patients. Am. J. Neurodegener. Dis. 2, 129–139 [PMC free article] [PubMed] [Google Scholar]
- 30.Holmoy T. (2008) T cells in amyotrophic lateral sclerosis. Eur. J. Neurol. 15, 360–366 [DOI] [PubMed] [Google Scholar]
- 31.Kebir H., Kreymborg K., Ifergan I., Dodelet-Devillers A., Cayrol R., Bernard M., Giuliani F., Arbour N., Becher B., Prat A. (2007) Human TH17 lymphocytes promote blood-brain barrier disruption and central nervous system inflammation. Nat. Med. 13, 1173–1175 [DOI] [PMC free article] [PubMed] [Google Scholar]
- 32.Campbell I. L., Erta M., Lim S. L., Frausto R., May U., Rose-John S., Scheller J., Hidalgo J. (2014) Trans-signaling is a dominant mechanism for the pathogenic actions of interleukin-6 in the brain. J. Neurosci. 34, 2503–2513 [DOI] [PMC free article] [PubMed] [Google Scholar]
- 33.Endo F., Komine O., Fujimori-Tonou N., Katsuno M., Jin S., Watanabe S., Sobue G., Dezawa M., Wyss-Coray T., Yamanaka K. (2015) Astrocyte-derived TGF-β1 accelerates disease progression in ALS mice by interfering with the neuroprotective functions of microglia and T cells. Cell Reports 11, 592–604 [DOI] [PubMed] [Google Scholar]
- 34.Hooten K. G., Beers D. R., Zhao W., Appel S. H. (2015) Protective and toxic neuroinflammation in amyotrophic lateral sclerosis. Neurotherapeutics 12, 364–375 [DOI] [PMC free article] [PubMed] [Google Scholar]
- 35.Tovar-y-Romo L. B., Ramírez-Jarquín U. N., Lazo-Gómez R., Tapia R. (2014) Trophic factors as modulators of motor neuron physiology and survival: implications for ALS therapy. Front. Cell. Neurosci. 8, 61 [DOI] [PMC free article] [PubMed] [Google Scholar]
- 36.Israelson A., Ditsworth D., Sun S., Song S., Liang J., Hruska-Plochan M., McAlonis-Downes M., Abu-Hamad S., Zoltsman G., Shani T., Maldonado M., Bui A., Navarro M., Zhou H., Marsala M., Kaspar B. K., Da Cruz S., Cleveland D. W. (2015) Macrophage migration inhibitory factor as a chaperone inhibiting accumulation of misfolded SOD1. Neuron 86, 218–232 [DOI] [PMC free article] [PubMed] [Google Scholar]
- 37.Collins M. A., An J., Hood B. L., Conrads T. P., Bowser R. P. (2015) Label-free LC-MS/MS proteomic analysis of cerebrospinal fluid identifies protein/pathway alterations and candidate biomarkers for amyotrophic lateral sclerosis. J. Proteome Res. 14, 4486–4501 [DOI] [PMC free article] [PubMed] [Google Scholar]
- 38.Meltz Steinberg K., Nicholas T. J., Koboldt D. C., Yu B., Mardis E., Pamphlett R. (2015) Whole genome analyses reveal no pathogenetic single nucleotide or structural differences between monozygotic twins discordant for amyotrophic lateral sclerosis. Amyotroph. Lateral Scler. Frontotemporal Degener. 16, 385–392 [DOI] [PubMed] [Google Scholar]
- 39.Xi Z., Yunusova Y., van Blitterswijk M., Dib S., Ghani M., Moreno D., Sato C., Liang Y., Singleton A., Robertson J., Rademakers R., Zinman L., Rogaeva E. (2014) Identical twins with the C9orf72 repeat expansion are discordant for ALS. Neurology 83, 1476–1478 [DOI] [PMC free article] [PubMed] [Google Scholar]
- 40.Trapnell C., Pachter L., Salzberg S. L. (2009) TopHat: discovering splice junctions with RNA-Seq. Bioinformatics 25, 1105–1111 [DOI] [PMC free article] [PubMed] [Google Scholar]
- 41.Anders S., Huber W. (2010) Differential expression analysis for sequence count data. Genome Biol. 11, R106 [DOI] [PMC free article] [PubMed] [Google Scholar]
- 42.Anders S., Pyl P. T., Huber W. (2015) HTSeq: a Python framework to work with high-throughput sequencing data. Bioinformatics 31, 166–169 [DOI] [PMC free article] [PubMed] [Google Scholar]
- 43.Su A. I., Wiltshire T., Batalov S., Lapp H., Ching K. A., Block D., Zhang J., Soden R., Hayakawa M., Kreiman G., Cooke M. P., Walker J. R., Hogenesch J. B. (2004) A gene atlas of the mouse and human protein-encoding transcriptomes. Proc. Natl. Acad. Sci. USA 101, 6062–6067 [DOI] [PMC free article] [PubMed] [Google Scholar]
- 44.McCall M. N., Bolstad B. M., Irizarry R. A. (2010) Frozen robust multiarray analysis (fRMA). Biostatistics 11, 242–253 [DOI] [PMC free article] [PubMed] [Google Scholar]
- 45.Smith Z. D., Gu H., Bock C., Gnirke A., Meissner A. (2009) High-throughput bisulfite sequencing in mammalian genomes. Methods 48, 226–232 [DOI] [PMC free article] [PubMed] [Google Scholar]
- 46.Guo W., Fiziev P., Yan W., Cokus S., Sun X., Zhang M. Q., Chen P. Y., Pellegrini M. (2013) BS-Seeker2: a versatile aligning pipeline for bisulfite sequencing data. BMC Genomics 14, 774 [DOI] [PMC free article] [PubMed] [Google Scholar]
- 47.Martens J. H., Stunnenberg H. G. (2013) BLUEPRINT: mapping human blood cell epigenomes. Haematologica 98, 1487–1489 [DOI] [PMC free article] [PubMed] [Google Scholar]
- 48.Robinson J. T., Thorvaldsdóttir H., Winckler W., Guttman M., Lander E. S., Getz G., Mesirov J. P. (2011) Integrative genomics viewer. Nat. Biotechnol. 29, 24–26 [DOI] [PMC free article] [PubMed] [Google Scholar]
- 49.McLean C. Y., Bristor D., Hiller M., Clarke S. L., Schaar B. T., Lowe C. B., Wenger A. M., Bejerano G. (2010) GREAT improves functional interpretation of cis-regulatory regions. Nat. Biotechnol. 28, 495–501 [DOI] [PMC free article] [PubMed] [Google Scholar]
- 50.McKenna A., Hanna M., Banks E., Sivachenko A., Cibulskis K., Kernytsky A., Garimella K., Altshuler D., Gabriel S., Daly M., DePristo M. A. (2010) The Genome Analysis Toolkit: a MapReduce framework for analyzing next-generation DNA sequencing data. Genome Res. 20, 1297–1303 [DOI] [PMC free article] [PubMed] [Google Scholar]
- 51.ITALSGEN Consortium (2011) A hexanucleotide repeat expansion in C9ORF72 is the cause of chromosome 9p21-linked ALS-FTD. Neuron 72, 257–268 [DOI] [PMC free article] [PubMed] [Google Scholar]
- 52.Feng X. (2005) Regulatory roles and molecular signaling of TNF family members in osteoclasts. Gene 350, 1–13 [DOI] [PubMed] [Google Scholar]
- 53.Locksley R. M., Killeen N., Lenardo M. J. (2001) The TNF and TNF receptor superfamilies: integrating mammalian biology. Cell 104, 487–501 [DOI] [PubMed] [Google Scholar]
- 54.Pollack B. P. (2012) EGFR inhibitors, MHC expression and immune responses: can EGFR inhibitors be used as immune response modifiers? OncoImmunology 1, 71–74 [DOI] [PMC free article] [PubMed] [Google Scholar]
- 55.Zaiss D. M., Gause W. C., Osborne L. C., Artis D. (2015) Emerging functions of amphiregulin in orchestrating immunity, inflammation, and tissue repair. Immunity 42, 216–226 [DOI] [PMC free article] [PubMed] [Google Scholar]
- 56.Povlsen G. K., Berezin V., Bock E. (2008) Neural cell adhesion molecule-180-mediated homophilic binding induces epidermal growth factor receptor (EGFR) down-regulation and uncouples the inhibitory function of EGFR in neurite outgrowth. J. Neurochem. 104, 624–639 [DOI] [PubMed] [Google Scholar]
- 57.Young M. D., Willson T. A., Wakefield M. J., Trounson E., Hilton D. J., Blewitt M. E., Oshlack A., Majewski I. J. (2011) ChIP-seq analysis reveals distinct H3K27me3 profiles that correlate with transcriptional activity. Nucleic Acids Res. 39, 7415–7427 [DOI] [PMC free article] [PubMed] [Google Scholar]
- 58.Lo H. M., Wang S. W., Chen C. L., Wu P. H., Wu W. B. (2014) Effects of all-trans retinoic acid, retinol, and β-carotene on murine macrophage activity. Food Funct. 5, 140–148 [DOI] [PubMed] [Google Scholar]
- 59.Mesci P., Zaïdi S., Lobsiger C. S., Millecamps S., Escartin C., Seilhean D., Sato H., Mallat M., Boillée S. (2015) System xC− is a mediator of microglial function and its deletion slows symptoms in amyotrophic lateral sclerosis mice. Brain 138, 53–68 [DOI] [PMC free article] [PubMed] [Google Scholar]
- 60.Nishimoto N., Terao K., Mima T., Nakahara H., Takagi N., Kakehi T. (2008) Mechanisms and pathologic significances in increase in serum interleukin-6 (IL-6) and soluble IL-6 receptor after administration of an anti-IL-6 receptor antibody, tocilizumab, in patients with rheumatoid arthritis and Castleman disease. Blood 112, 3959–3964 [DOI] [PubMed] [Google Scholar]
- 61.Sallusto F., Lenig D., Förster R., Lipp M., Lanzavecchia A. (1999) Two subsets of memory T lymphocytes with distinct homing potentials and effector functions. Nature 401, 708–712 [DOI] [PubMed] [Google Scholar]
- 62.Huster K. M., Busch V., Schiemann M., Linkemann K., Kerksiek K. M., Wagner H., Busch D. H. (2004) Selective expression of IL-7 receptor on memory T cells identifies early CD40L-dependent generation of distinct CD8+ memory T cell subsets. Proc. Natl. Acad. Sci. USA 101, 5610–5615 [DOI] [PMC free article] [PubMed] [Google Scholar]
- 63.Lam L., Halder R. C., Montoya D. J., Rubbi L., Rinaldi A., Sagong B., Weitzman S., Rubattino R., Singh R. R., Pellegrini M., Fiala M. (2015) Anti-inflammatory therapies of amyotrophic lateral sclerosis guided by immune pathways. Am. J. Neurodegener. Dis. 4, 28–39 [PMC free article] [PubMed] [Google Scholar]
Associated Data
This section collects any data citations, data availability statements, or supplementary materials included in this article.