

Abstract
Purpose
Trimodality therapy (chemoradiation and surgery) is standard of care for Stage II/III rectal cancer but nearly one third of patients do not receive radiation therapy (RT). We examined the relationship between density of radiation oncologist and travel distance to receipt of RT.
Materials/Methods
A retrospective study based on the National Cancer Data Base identified 26,845 patients aged 18–80 with Stage II/III rectal cancer diagnosed between 2007–2010. Radiation oncologists were identified through Physician Compare Dataset. Generalized Estimating Equations clustering by Hospital Service Area was utilized to examine the association between geographic access and receipt of RT, controlling for patient sociodemographic and clinical characteristics.
Results
70% of patients received RT within 180 days of diagnosis or within 90 days of surgery. Compared to travel distance <12.5 miles, patients diagnosed at reporting facility who traveled ≥50 miles had a decreased likelihood of receipt of RT (50–249 miles: adjusted Odds Ratio [aOR] 0.75, p<.001; ≥250 miles: aOR 0.46, p=.002), all else being equal. Density level of radiation oncologists was not significantly associated with receipt of RT. Patients who were female, nonwhites, ≥50 years, and with comorbidities were less likely to receive RT (p<.05). Patients who were uninsured but self-paid for their medical services, initially diagnosed elsewhere but treated at reporting facility, and resided in Midwest had increased likelihood of receipt of RT (p<.05).
Conclusions
Increased travel burden was associated with a decreased likelihood of receiving RT for stage II/III rectal cancer patients when all else being equal, but radiation oncologist density was not. Further research in geographic access and establishing transportation assistance programs, or lodging services for patients with unmet need may help decrease geographic barriers and improve the quality of rectal cancer care.
Introduction
The efficacy of adjuvant chemoradiation therapy for surgically resectable Stage II/III rectal cancer is well-established from randomized trials. These studies demonstrated an increase in local control, disease-free and overall survival when combined with a 5-fluorouracil based chemotherapy after surgical resection. Preoperative chemoradiation followed by surgery is often employed to allow sphincter-preservation and to decrease bowel morbidity. NCCN treatment guidelines also recommend radiation therapy (RT), either pre-operatively or post-operatively for stage II/III rectal cancer.1 However, a large proportion of patients do not receive recommended RT.2–4
Because RT requires access to radiation oncologists and linear accelerators for treatment, the receipt of RT may be partly influenced by geographic access. Geographic availability of RT resources may be evaluated by assessing geographic distribution of radiation oncologists and/or travel burden experienced by the patient. Higher population density of radiation oncologists is associated with increased likelihood of receiving RT5 and improved treatment outcome.6 Studies have demonstrated, however, that radiation oncologists are geographically maldistributed across the nation,7, 8 clustered at academic centers7 and of limited accessibility relative to other oncology specialists.9 Traveling long distances to cancer care is a barrier to cancer treatment,10–12 associated with decreased utilization of RT,13–15 or worse treatment outcome.16 Even with data on association between geographic access and receipt of RT, there is limited information specific to rectal cancer. Therefore, we sought to examine the relationship nationally between geographic access to cancer care and receipt of RT for stage II/III rectal cancer.
Methods and Materials
Data source
The National Cancer Data Base (NCDB), a hospital-based cancer registry that is jointly sponsored by the American College of Surgeons and the American Cancer Society, contains standardized data collected from over 1,500 Commission on Cancer (CoC)-accredited facilities and captures around 70% of newly diagnosed cancer cases in the United States.17 The Morehouse School of Medicine Institutional Review Board reviewed this study and granted IRB review exemption.
The Centers for Medicare and Medicaid Services Physician Compare dataset was used to identify number and location of radiation oncologists. It includes physicians and other providers, identified by National Provider Identifier, who have submitted Medicare claims in the previous 12 months. The data contains demographic information, practice location and specialty designation and is updated monthly.
Study population
Patients with first primary American Joint Committee On Cancer collaborative stage II/III rectal cancer (International Classification of Disease for Oncology, 3rd Edition site codes: C19.9–C20.9) with no distant metastasis, diagnosed between 2007 and 2010, aged 18 to 80, who were surgical candidates, and treated at CoC-accredited facilities were selected. Patients were considered surgical candidates if they received cancer-directed surgery (including partial or total proctectomy) within six months of diagnosis. Patients were excluded if receipt of RT, RT administration dates, surgical treatment or area of residence was unknown (Figure 1). Due to small numbers, patients who had government sponsored insurance other than Medicaid and Medicare (e.g. Indian Bureau of Affairs, Public Health Service) (n=149) were excluded from the study.
Figure 1.
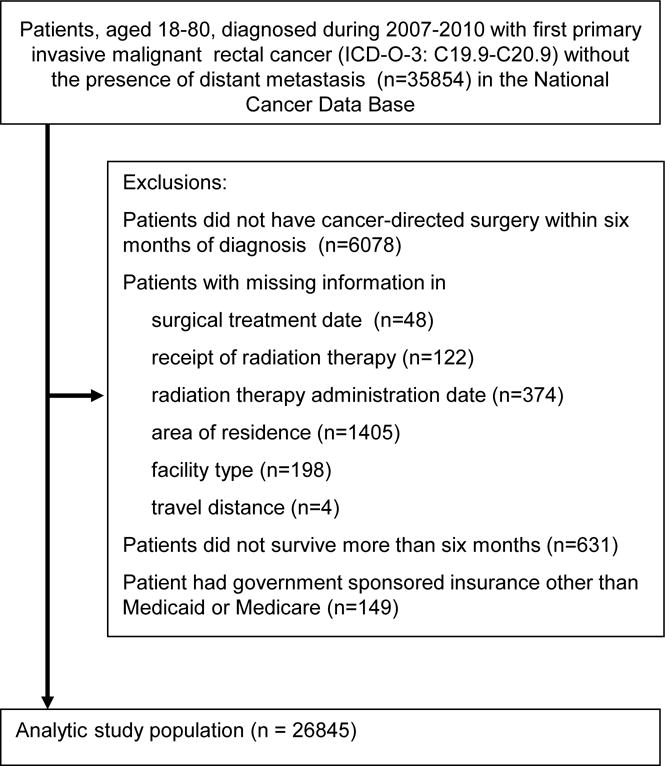
Patient selection schema
Outcome and Covariates
The primary outcome was receipt of RT. The consensus for optimal management of rectal cancer has changed over the past decade. Several randomized clinical trials support either preoperative or postoperative irradiation.18, 19,20 In order to include both treatment sequencing patterns, receipt of RT was allowed within 180 days of diagnosis or 90 days of surgery in the NCDB. Time from diagnosis to RT was calculated from the date of cancer diagnosis to the RT start date while time from surgery to RT was calculated from the surgical date to the RT start date.
The major variables of interest were density level of radiation oncologists in a patient’s area of residence and travel distance to cancer treatment facility. Radiation Oncologists were identified through a November 2013 Physician Compare dataset if their primary specialty was listed as radiation oncology. The number of unique radiation oncologists was counted per Hospital Service area (HSA). HSAs, developed by the Dartmouth Atlas of Health Care21, are geographic areas covering one or more ZIP codes where medical resources are used based on the analysis of travel patterns for routine hospital care. The density was then calculated as the number of unique radiation oncologists per 100,000 residents in each HSA. Because many HSAs did not have radiation oncologists, a separate density level was created as “no radiation oncologist.” Among HSAs with ≥1 radiation oncologist, quartiles of density level were created from Q1 to Q4, with Q1 as the lowest quartile and Q4 as the highest quartile. Each patient was, then, assigned with a density level of radiation oncologists based on the HSA of residence at diagnosis.
Travel distance to cancer treatment was defined as driving distance between the centroids of ZIP codes of patient residence at diagnosis and reporting facility, as calculated by using Google Maps in the NCDB dataset. It was categorized as 0–12.49, 12.5–49.9, 50–249 and ≥250 miles, based on previous literature.22–24 For patients who lived outside the continental U.S. but traveled back to seek cancer treatment, their travel distance was calculated by the “crow-fly” method.
Other variables of interest extracted from the NCDB included: patient demographics (age at diagnosis, gender, race/ethnicity), comorbidity, socioeconomic status (median income of their neighborhood), insurance, census region, location of diagnosis, facility type, and cancer stage. Patient insurance status was defined as private, uninsured-charity, uninsured-self-pay, Medicaid, younger Medicare (age 18–64) and older Medicare (age ≥65). Race/ethnicity was categorized as non-Hispanic white, black, Hispanic, other and missing. Comorbidity was designated by the Charlson-Deyo comorbidity score based on medical conditions captured in comorbidity and complication fields. Median income in the neighborhood of a patient’s residence was derived from 2000 US Census data and categorized based on national quartiles by ZIP code. Location of diagnosis was defined using the class of case codes. Initial diagnosis at reporting facility was defined by codes 10–14, while initial diagnosis elsewhere was defined by codes 20–22. Facility type was assigned by the CoC accreditation program.
Statistical Analysis
Geographic distribution of radiation oncologists was mapped by ArcGIS software (version 10.2.2). Patient characteristics were summarized overall, by density level of radiation oncologists, by travel distance, and by location of diagnosis. Chi-squared tests were used to determine if statistically significant differences existed at 0.05 levels. Generalized Estimating Equations (GEE) clustering by HSA were utilized to examine the association between geographic access and receipt of RT, controlling for patient sociodemographic and clinical characteristics. GEE is a multivariate model that allows for potential correlation among patients within the same HSA. Pairwise comparison of interaction terms between main effects (radiation oncologist density, travel distance) and all other covariates were evaluated and included in the model if significant interaction was found. Two-sided p values with significance level at 0.05 were reported. All statistical analyses were performed using SAS 9.4 (Cary, NC).
Results
Geographic distribution of Radiation Oncologists Nationwide
A total of 4,253 radiation oncologists were identified. Figure 2 shows geographic distribution of radiation oncologists in quartiles at HSA level. Of 3436 HSAs in the U.S., 1053 (30.7%) HSAs have at least one radiation oncologist. The density levels from Q1 to Q4 are 0–1.46, 1.47–2.32, 2.33–4.22, and ≥4.23, respectively, and overall average density is 1.28 radiation oncologists (Interquartile range [IQR]: 1.25) per 100,000 residents. While over half of HSAs have no radiation oncologists, only 26.1% of population resided in those HSAs. The HSAs with no radiation oncologists were more likely to have smaller population (average 27000s–32000s residents) and in Midwest or South regions.
Figure 2.
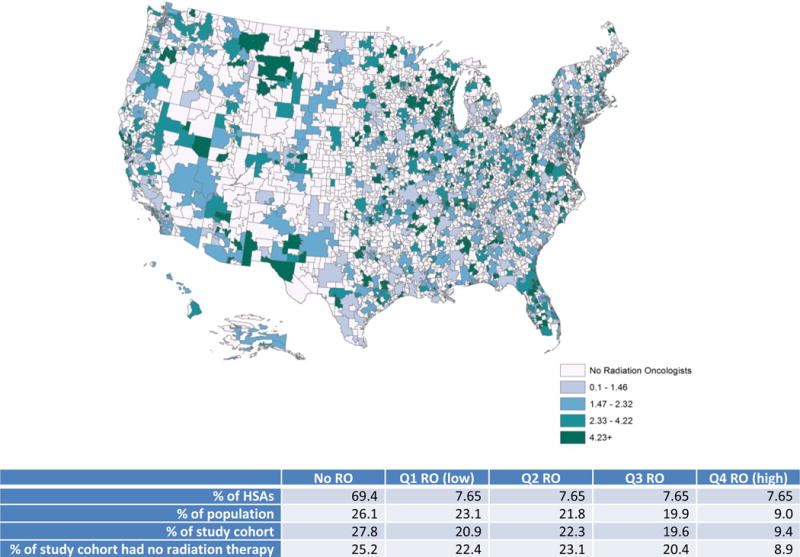
Radiation Oncologists per 100,000 residents by Hospital Service Area (HSA)
Sensitivity analyses were conducted using de-identified American Society for Radiation Oncology (ASTRO) membership data aggregated by ZIP code of practice location to define the number and location of radiation oncologists. Overall, geographic distribution of ASTRO-member radiation oncologists was similar to those based on Physician Compare but did not capture a greater number of radiation oncologists in majority of the HSAs.
Patient Characteristics
Among 26,845 rectal cancer patients identified as study cohort, nearly 70% of them received RT within 180 days of diagnosis or within 90 days of surgery (Table 1). Median age was 60 years (IQR: 17). Most RT, if performed, was received pre-operationally (75%) and in reporting facilities (68%). The majority (99%) of RT was external beam RT with median total dose of 50.4Gy. Median time from diagnosis to initiation of RT was 38 days while median time between initiation of RT and surgery was 84 days (prior to surgery).
Table 1.
Characteristics of Stage II–III rectal cancer patients
| Categories | Total |
|---|---|
| N=26845 | |
| N (%) | |
| Radiation Therapy | |
| No RT within 180 days of diagnosis | 8169 (30.43) |
| have RT within 180 days of diagnosis | 18676 (69.57) |
| Density of RO | |
| no RO | 7467 (27.82) |
| RO_Q1 (low) | 5609 (20.89) |
| RO_Q2 | 5993 (22.32) |
| RO_Q3 | 5254 (19.57) |
| RO_Q4(high) | 2522 (9.39) |
| Travel Distance | |
| 0–12.49 miles | 12302 (45.83) |
| 12.5–49.9 miles | 10632 (39.61) |
| 50–249 miles | 3552 (13.23) |
| ≥250 miles | 359 (1.34) |
| Age Group | |
| 18–50 | 6317 (23.53) |
| 51–64 | 10779 (40.15) |
| 65–70 | 4460 (16.61) |
| 71–75 | 2941 (10.96) |
| 76–80 | 2348 (8.75) |
| Gender | |
| Male | 16171 (60.24) |
| Female | 10674 (39.76) |
| Race/Ethnicity | |
| Non-Hispanic white | 19939 (74.27) |
| Hispanic | 1487 (5.54) |
| Black | 2260 (8.42) |
| Others | 1286 (4.79) |
| Missing | 1873 (6.98) |
| Insurance | |
| Uninsured, self-pay | 836 (3.11) |
| Uninsured, charity | 459 (1.71) |
| Medicaid | 1638 (6.1) |
| Younger Medicare | 1194 (4.45) |
| Older Medicare | 7939 (29.57) |
| Private | 14413 (53.69) |
| Missing | 366 (1.36) |
| Diagnosis Year | |
| 2007 | 7113 (26.5) |
| 2008 | 6745 (25.13) |
| 2009 | 6519 (24.28) |
| 2010 | 6468 (24.09) |
| Stage | |
| Stage II | 11202 (41.73) |
| Stage III | 15643 (58.27) |
| Rural/Urban† | |
| Rural | 5387 (20.07) |
| Urban | 20988 (78.18) |
| Unknown | 470 (1.75) |
| Region | |
| Northeast | 5051 (18.82) |
| Midwest | 7365 (27.44) |
| South | 10126 (37.72) |
| West | 4303 (16.03) |
| Median Income-Quartile 2000‡ | |
| <$30,000 | 3761 (14.01) |
| $30,000–$34,999 | 5081 (18.93) |
| $35,000–$45,999 | 7428 (27.67) |
| $46,000+ | 10240 (38.14) |
| Missing | 335 (1.25) |
| Facility Type | |
| Community Cancer Program | 2939 (10.95) |
| Comprehensive Community Cancer Program | 12808 (47.71) |
| Academic Comprehensive Cancer Program | 5852 (21.8) |
| NCI Program/Network | 2517 (9.38) |
| Other | 2729 (10.17) |
| Charlson Comorbidity Score | |
| 0 | 20576 (76.65) |
| 1 | 4651 (17.33) |
| 2+ | 1618 (6.03) |
| Diagnosis location | |
| Diagnosed at reporting facility | 14607 (54.41) |
| Diagnosed elsewhere | 12238 (45.59) |
Uninsured-charity was included for patients without insurance and for whom the facility declared their care as charity write-off. The uninsured-self-pay was defined as when patients have no insurance but are responsible for their own charges.
Rural/Urban is based on 2003 Rural-Urban Continuum Codes developed by the United States Department of Agriculture, Economic Research Service. Counties whose continuum codes between 1 and 3 were considered urban while counties with continuum codes between 4 and 9 were grouped as rural.
Median Income is based on aggregate U.S. 2000 census data for the patient’s residential ZIP code
Among those patients who did not receive RT, 6.5% of them received RT but in a later time period, with median time from diagnosis as 226 days and median time from surgery as 203 days (after surgery). Of others who did not receive RT, 86% of the reason for not receiving RT was “not part of first course of treatment”; 6% involved patient refusal; 3% was not recommended by doctors because of other risk factors; 1% was recommended by physicians but reason unknown why not administered; and 3% was recommended by doctors but unknown whether administered.
Around a quarter (27.8%) of patients resided in areas with no radiation oncologist (Supplementary Table 1). The majority (75%) of those residing in areas with no radiation oncologists sought treatment at facilities in areas with ≥1 radiation oncologists. Patients resided in areas with no radiation oncologists who traveled to seek RT were more likely to go to an academic comprehensive cancer program or NCI-designated facilities compared with patients resided in areas with radiation oncologists. As expected, most patients (75%) who resided in areas with ≥1 radiation oncologists did not seek treatment in areas with higher density of radiation oncologists.
Nearly half (45.8%) of patients had traveled <12.5 miles to the reporting facility (Supplementary Table 2A). Patients who resided in “no radiation oncologist” HSAs traveled almost three times as far to a reporting facility for treatment compared with those who resided in areas with ≥1 radiation oncologists (median distance: 30 vs. 11 miles, p<.001). Since there was a significant interaction between travel distance and diagnosis location (p<.001), stratified descriptive analyses showed that among patients diagnosed at reporting facility, those traveled ≥50 miles were less likely to receive RT than those traveled shorter distance (Supplementary Table 2B). This trend, however, was opposite among patients diagnosed elsewhere (Supplementary Table 2C).
Almost half (45.6%) of our study cohort were diagnosed elsewhere but treated at reporting facility (Table 2). Compared with patients diagnosed and treated at reporting facility, those diagnosed elsewhere were more likely to receive RT (65% vs. 75%, p<.001), reside in areas without any radiation oncologists (23% vs. 33%, p<.001), and travel ≥50 miles to reporting facility (7% vs. 23%, p<.001). Patients were less likely to seek treatment in different facilities if aged ≥76, black race, female, uninsured or Medicaid insured, with comorbidities, resided in areas with lower median income.
Table 2.
Characteristics of Stage II–III rectal cancer patients by location of diagnosis and factors associated with being diagnosed elsewhere
| Categories | Diagnosed at reporting facility | Diagnosed elsewhere | χ2 p-value | Adjusted Odds Ratio (95% CI) | P value |
|---|---|---|---|---|---|
| N=14607 (54.4) | N=12238(45.6) | ||||
| N (%) | N (%) | ||||
| Radiation Therapy | |||||
| No RT* within 180 days of diagnosis | 5119 (35.04) | 3050 (24.92) | < 0.0001 | ||
| have RT within 180 days of diagnosis | 9488 (64.96) | 9188 (75.08) | |||
| Travel Distance | |||||
| 0–12.49 miles | 8205 (56.17) | 4097 (33.48) | < 0.0001 | 1 | |
| 12.5–49.9 miles | 5351 (36.63) | 5281 (43.15) | 1.7(1.59–1.83) | <.0001 | |
| 50–249 miles | 981 (6.72) | 2571 (21.01) | 3.92(3.45–4.44) | <.0001 | |
| ≥250 miles | 70 (0.48) | 289 (2.36) | 4.54(3.47–5.95) | <.0001 | |
| Density of Radiation Oncologist (RO) | |||||
| no RO | 3339 (22.86) | 4128 (33.73) | < 0.0001 | 1.41(1.21–1.64) | <.0001 |
| RO_Q1 (low) | 3183 (21.79) | 2426 (19.82) | 1.05(0.89–1.25) | 0.5708 | |
| RO_Q2 | 3587 (24.56) | 2406 (19.66) | 0.98(0.82–1.17) | 0.8407 | |
| RO_Q3 | 3067 (21) | 2187 (17.87) | 1.05(0.88–1.26) | 0.5993 | |
| RO_Q4(high) | 1431 (9.8) | 1091 (8.91) | 1 | ||
| Age Group | |||||
| 18–50 | 3236 (22.15) | 3081 (25.18) | < 0.0001 | 1 | |
| 51–64 | 5801 (39.71) | 4978 (40.68) | 0.96(0.9–1.03) | 0.2835 | |
| 65–70 | 2444 (16.73) | 2016 (16.47) | 0.92(0.82–1.04) | 0.1916 | |
| 71–75 | 1707 (11.69) | 1234 (10.08) | 0.89(0.78–1.01) | 0.0784 | |
| 76–80 | 1419 (9.71) | 929 (7.59) | 0.85(0.74–0.97) | 0.0187 | |
| Gender | |||||
| Male | 8703 (59.58) | 7468 (61.02) | 0.016 | 1 | |
| Female | 5904 (40.42) | 4770 (38.98) | 0.95(0.9–1) | 0.0411 | |
| Race/Ethnicity | |||||
| Non-Hispanic white | 10741 (73.53) | 9198 (75.16) | < 0.0001 | 1 | |
| Hispanic | 822 (5.63) | 665 (5.43) | 0.97(0.85–1.1) | 0.6197 | |
| Black | 1394 (9.54) | 866 (7.08) | 0.88(0.8–0.98) | 0.0161 | |
| Others | 661 (4.53) | 625 (5.11) | 1.13(0.98–1.31) | 0.0991 | |
| Missing | 989 (6.77) | 884 (7.22) | 1.04(0.93–1.17) | 0.4696 | |
| Insurance | |||||
| Uninsured, self-pay | 554 (3.79) | 282 (2.3) | < 0.0001 | 0.54(0.46–0.63) | <.0001 |
| Uninsured, charity | 311 (2.13) | 148 (1.21) | 0.48(0.38–0.6) | <.0001 | |
| Medicaid | 939 (6.43) | 699 (5.71) | 0.8(0.71–0.91) | 0.0003 | |
| Younger Medicare | 660 (4.52) | 534 (4.36) | 0.92(0.81–1.04) | 0.2011 | |
| Older Medicare | 4529 (31.01) | 3410 (27.86) | 0.97(0.87–1.08) | 0.5377 | |
| Private | 7437 (50.91) | 6976 (57) | 1 | ||
| Missing | 177 (1.21) | 189 (1.54) | 0.93(0.74–1.17) | 0.5263 | |
| Diagnosis Year | |||||
| 2007 | 3969 (27.17) | 3144 (25.69) | 0.015 | 1 | |
| 2008 | 3684 (25.22) | 3061 (25.01) | 1.06(0.98–1.14) | 0.1381 | |
| 2009 | 3518 (24.08) | 3001 (24.52) | 1.08(1–1.16) | 0.0588 | |
| 2010 | 3436 (23.52) | 3032 (24.78) | 1.1(1.02–1.18) | 0.0093 | |
| Stage | |||||
| Stage II | 6228 (42.64) | 4974 (40.64) | 0.0010 | 1 | |
| Stage III | 8379 (57.36) | 7264 (59.36) | 1.05(1–1.1) | 0.0682 | |
| Rural/Urban† | |||||
| Rural | 2321 (15.89) | 3066 (25.05) | < 0.0001 | ||
| Urban | 12052 (82.51) | 8936 (73.02) | |||
| Unknown | 234 (1.6) | 236 (1.93) | |||
| Region | |||||
| Northeast | 2772 (18.98) | 2279 (18.62) | < 0.0001 | 1 | |
| Midwest | 4171 (28.55) | 3194 (26.1) | 0.95 (0.83–1.07) | 0.3777 | |
| South | 5395 (36.93) | 4731 (38.66) | 1.06 (0.94–1.2) | 0.3207 | |
| West | 2269 (15.53) | 2034 (16.62) | 1.12 (0.97–1.29) | 0.1315 | |
| Median Income-Quartile 2000 | |||||
| <$30,000 | 2008 (13.75) | 1753 (14.32) | 0.0002 | 0.89 (0.8–0.98) | 0.0159 |
| $30,000–$34,999 | 2635 (18.04) | 2446 (19.99) | 0.98 (0.9–1.06) | 0.5991 | |
| $35,000–$45,999 | 4133 (28.29) | 3295 (26.92) | 0.99 (0.91–1.07) | 0.7533 | |
| $46,000+ | 5644 (38.64) | 4596 (37.56) | 1 | ||
| Missing | 187 (1.28) | 148 (1.21) | 0.92 (0.73–1.16) | 0.4956 | |
| Facility Type | |||||
| Community Cancer Program | 1959 (13.41) | 980 (8.01) | < 0.0001 | 1 | |
| Comprehensive Community Cancer Program | 7517 (51.46) | 5291 (43.23) | 1.29 (1.14–1.46) | <.0001 | |
| Academic Comprehensive Cancer Program | 3047 (20.86) | 2805 (22.92) | 1.84 (1.59–2.13) | <.0001 | |
| NCI* Program/Network | 556 (3.81) | 1961 (16.02) | 5.65 (4.64–6.87) | <.0001 | |
| Other | 1528 (10.46) | 1201 (9.81) | 1.55 (1.31–1.85) | <.0001 | |
| Charlson Comorbidity Score | |||||
| 0 | 10868 (74.4) | 9708 (79.33) | < 0.0001 | 1 | |
| 1 | 2681 (18.35) | 1970 (16.1) | 0.83 (0.78–0.89) | <.0001 | |
| 2+ | 1058 (7.24) | 560 (4.58) | 0.62 (0.55–0.7) | <.0001 |
RT, Radiation Therapy; NCI, National Cancer Institute
Since rural/urban status is highly correlated with travel distance, it was not included in the multivariate analyses.
Factors associated with receipt of radiation therapy
The adjusted associations between geographic access to and receipt of RT are shown in Table 3 and stratified analyses by diagnosis location are presented in Supplementary Table 3. In univariate analysis (Supplementary Table 2A), receipt of RT was lower among whom traveled <12.5 miles. These untreated patients were more likely to be female, of non-white races, ≥50 years, had ≥1 comorbidities, lower income, non-private insurance, or resided in the South. However, after taking into account all the variables in multivariate analyses, patients diagnosed at reporting facility who traveled ≥50 miles had a decreased likelihood of receipt of RT (50–249 miles: adjusted Odds Ratio [aOR] 0.75, p=<.001; ≥250 miles: aOR 0.46, p=.002) than those traveled <12.5 miles. This likely indicates that the patient population varied significantly as distance from the reporting facility changed. Hence, taking into account these other variables is important in estimating the effect of distance.
Table 3.
The likelihood of receipt of radiation therapy among stage II–III rectal cancer patients
| Categories | OR(95% CI) | p value |
|---|---|---|
| Travel distance | ||
| (When diagnosed at reporting facility) | ||
| 0–12.49 miles | 1 | |
| 12.5–49.9 miles | 0.94(0.87–1.02) | 0.1694 |
| 50–249 miles | 0.75(0.65–0.87) | 0.0002 |
| ≥250 miles | 0.46(0.28–0.74) | 0.0015 |
| (When diagnosed elsewhere) | ||
| 0–12.49 miles | 1 | |
| 12.5–49.9 miles | 1.11(1.01–1.22) | 0.0318 |
| 50–249 miles | 1.05(0.92–1.19) | 0.4331 |
| ≥250 miles | 0.98(0.74–1.31) | 0.9105 |
| Density of Radiation Oncologist (RO) | ||
| No RO | 1.04(0.92–1.19) | 0.5359 |
| RO Q1 (low) | 0.9(0.78–1.04) | 0.1435 |
| RO Q2 | 0.95(0.83–1.09) | 0.4848 |
| RO Q3 | 0.9(0.79–1.04) | 0.1469 |
| RO Q4 (high) | 1 | |
| Age Group | ||
| 18–50 | 1 | |
| 51–64 | 0.88(0.81–0.94) | 0.0006 |
| 65–70 | 0.7(0.62–0.79) | <.0001 |
| 71–75 | 0.54(0.47–0.62) | <.0001 |
| 76–80 | 0.41(0.36–0.48) | <.0001 |
| Race/Ethnicity | ||
| Non-Hispanic white | ||
| Hispanic | 0.85(0.75–0.95) | 0.0064 |
| Black | 0.8(0.72–0.88) | <.0001 |
| Others | 0.86(0.75–0.99) | 0.0312 |
| Missing | 0.96(0.85–1.09) | 0.5636 |
| Gender | ||
| Male | 1 | |
| Female | 0.8(0.76–0.85) | <.0001 |
| Insurance | ||
| Private | 1 | |
| Uninsured, self-pay | 1.21(1.02–1.44) | 0.03 |
| Uninsured, charity-waive | 1.17(0.93–1.48) | 0.179 |
| Medicaid | 1.08(0.96–1.22) | 0.1878 |
| Younger Medicare | 0.92(0.81–1.06) | 0.2555 |
| Older Medicare | 1.09(0.97–1.21) | 0.1448 |
| Missing | 1.01(0.81–1.26) | 0.9454 |
| Stage | ||
| Stage II | 1 | |
| Stage III | 0.99(0.94–1.05) | 0.8199 |
| Charlson Comorbidity Score | ||
| 0 | 1 | |
| 1 | 0.83(0.77–0.89) | <.0001 |
| 2+ | 0.64(0.57–0.71) | <.0001 |
| Diagnosis Year | ||
| 2007 | 1 | |
| 2008 | 0.98(0.91–1.06) | 0.6626 |
| 2009 | 1.04(0.96–1.13) | 0.3078 |
| 2010 | 1.05(0.98–1.14) | 0.1787 |
| Median Income-Quartile 2000 | ||
| <$30,000 | 1.04(0.95–1.14) | 0.4313 |
| $30,000–$34,999 | 1.14(1.04–1.24) | 0.0038 |
| $35,000–$45,999 | 1.08(1.01–1.16) | 0.0177 |
| $46,000+ | 1 | |
| Missing | 1.21(0.93–1.57) | 0.1541 |
| Facility Type | ||
| Community Cancer Program | 1 | |
| Comprehensive Community Cancer Program | 1.16(1.04–1.29) | 0.0077 |
| Academic Comprehensive Center Program | 1.05(0.93–1.19) | 0.3912 |
| NCI Program/Network | 1.3(1.11–1.53) | 0.0013 |
| Other | 1.25(1.08–1.44) | 0.003 |
| Region | ||
| Northeast | 1 | |
| Midwest | 1.29(1.16–1.43) | <.0001 |
| South | 0.99(0.89–1.09) | 0.779 |
| West | 1.02(0.91–1.15) | 0.7118 |
| Diagnosis location | ||
| Diagnosed elsewhere | 1.41(1.29–1.54) | <.0001 |
| Diagnosed at reporting facility | 1 |
Overall, density level of radiation oncologists was not significantly associated with receipt of RT. For patients diagnosed at reporting facility, lower density level of radiation oncologists had a trend in decreasing likelihood of receiving RT but without statistical significance in every level (Supplementary Table 3). On the other hand, for patients diagnosed elsewhere, those resided in areas with no radiation oncologist had greater likelihood in receipt of RT (aOR 1.21, p=0.04). In addition, for patients diagnosed at reporting facility, those treated at comprehensive cancer program, academic cancer program and NCI program had greater likelihood in receiving RT while there was no difference in receipt of RT across facility types for patients diagnosed elsewhere. Patients who were uninsured but self-paid for their medical services, diagnosed elsewhere, or resided in the Midwest region had increased likelihood of receiving RT.
Discussion
In this study, we observed two distinguished treatment patterns in receipt of RT. Among patients diagnosed and treated at reporting facility, those traveled ≥50 miles were less likely to receive RT compared with those traveled <12.5 miles, all else being equal, and there was a trend observed between radiation oncologist density and receipt of RT. On the other hand, among patients diagnosed elsewhere but treated at reporting facility, traveling longer distance was not associated with decreasing likelihood of receiving RT.
Despite the fact that combined RT, with or without chemotherapy, plus surgery has been a consensus guideline treatment for stage II/III rectal cancer patients, only 70% of our study cohort received RT. For the majority of those not receiving RT, the reason given was redundantly that RT was not included as part of first course of treatment. Similar RT underuse among patients in the SEER registry with 32.35% of stage II/III rectal cancer patients not receiving RT was reported.2 Based on guidelines and expert opinion, the optimal utilization rate was estimated around 73.6% (±0.7%)25; however, the actual utilization rate was found lower.26, 27 Similar to previous studies,2, 27, 28 our study found that patients with older age, female sex and a diagnosis in earlier study years were associated with a decreased likelihood of receiving RT.
Possible explanations for underuse of RT include: referral to a radiation oncologist was not made, some radiation oncologists failed to follow treatment guidelines to deliver RT, and that these data under-report the use of RT given that NCDB is a hospital-based registry and outpatient RT might not be captured well. In a study evaluating completeness of NCDB treatment data by comparing with private payer claims in Ohio, NCDB captured 84% of RT in colorectal cases.29 Similar under-ascertainment of RT was also reported by studies using population-based cancer registry data.30,31 Walker et al. reported that delay in the start of RT, residence in a newer cancer registry, advanced age or rural county were associated with under-ascertainment of RT. Therefore, even though CoC-accredited programs required facilities to capture all first course treatment, our study cannot rule out possible under-ascertainment of RT use in the NCDB.
A substantial variation in the density of radiation oncologists across the country was observed in this study, which is consistent with previous findings.6, 7, 9, 32 Aneja et al. used the Area Resource File to examine geographic access to radiation oncologists.6, 7 They reported that radiation oncologist density varies regionally and were inequitably distributed, being primarily located in metropolitan areas and being absent in 66% of 2472 counties or 44% of 949 Health Service Areas in the U.S. By using linked SEER-Medicare claims and the American Medical Association Masterfile, Baldwin et al. reported that one fourth of colorectal cancer patients did not have radiation oncology services available within 30 miles of their residence.9 Since radiation oncologists cannot deliver external beam RT without a linear accelerator, geographic distribution of facilities equipped with radiation delivery units can also provide insights into RT accessibility. By merging data from the Radiologic Physics Center, the Radiation Dosimetry Services, and the American Hospital Association and state health department, Ballas et al. identified 2246 unique radiation facilities in the U.S. and found that people in many rural areas would need to travel great distances to access RT.32
Despite geographical mal-distribution of radiation oncologists, radiation oncologist density was not statistically significantly associated with receipt of RT. It is likely that travel distance trumps density and that the clustering unit HSA does not accurately reflect referral/travel patterns for RT. On the other hand, it is quite encouraging that a great proportion of patients who resided in areas with no radiation oncologist still received RT by traveling to areas with ≥1 radiation oncologists. Interestingly, they were more likely to travel to academic or NCI-designated cancer programs, which might not be the nearest RT facility. It is possible these patients were seeking care from providers perceived to have more experience or better quality of care.33, 34 However, some patients are unable to travel or obtain a referral. Our study showed that patients who were older, black, with comorbidities, uninsured or insured by Medicaid were less likely to change facility after diagnosis. Travel distance could be a barrier.
We found that travel distance to cancer treatment facility was a significant factor associated with decreased use of RT among rectal cancer patients diagnosed and treated at the same facility. Like the findings reported for other cancer diagnoses, traveling a long distance to cancer care decreased the likelihood of receiving standard treatment.10, 13, 15, 27, 35, 36 Onega et al. and Punglia et al. found that travel distance to a RT facility was associated with the selection of treatment. They found that early-stage breast cancer women were more likely to select mastectomy instead of breast-conserving surgery plus post-operative RT when travel distance to nearest RT facility was longer.13, 15 Mackillop et al.27 found that cancer patients who resided >50 km from the nearest RT center had significantly lower rate of receiving RT. In addition, travel burden varied between different race/ethnicities. Guidry et al. reported that non-white patients were more likely to consider transportation (e.g. distance and lack of transportation) as a barrier to cancer treatment and possibly forgo needed treatment.10 Onega et al. also found that black patients who resided in rural areas that required longer travel distance were less likely to access care, compared to rural whites.35 Based on simulation results in finding optimal locations for radiation, studies suggested adding new centers in underserved areas or non-centralized small-city to improve geographic access.37, 38
Our study has several limitations. First, the NCDB captures only patients who are diagnosed or treated in CoC-accredited facilities and may not be representative of all cancer patients in the United States. However, when comparing stage II/III rectal cancer patients reported by the NCDB and the SEER18 (Supplementary Table 4), most of patient demographic and clinical characteristics were similar, except race/ethnicity. The NCDB identified fewer patients with Hispanic Ethnicity than the SEER.39 Second, NCDB did not capture all RT locations to calculate travel distance. Since our entire study cohort made treatment decisions at reporting facilities and two-thirds received RT at reporting facility, travel distance to the reporting facility should be a sound proxy measure to estimate travel burden. Third, travel distance was measured between the centroids of ZIP codes of patient residence and reporting facility and might be underestimated if patient resided in the same ZIP code as the reporting facility. However, ZIP codes are the smallest geographic detail we can obtain for the study in order to protect patient privacy.
While many factors influence treatment decisions, geographic location is an important and potentially alterable factor that might affect treatment patterns. Further research in geographic access and establishing transportation assistance programs, or lodging services for patients with unmet need may help decrease geographic barriers and improve the quality of rectal cancer care.
Supplementary Material
Summary.
In a cohort of 26,845 stage II/III rectal cancer patients extracted from the National Cancer Data Base, we sought to examine the relationship between density of radiation oncologist and travel distance to receipt of radiation. Our findings showed that increased travel burden was associated with a decreased likelihood of receiving radiation therapy when all else being equal, but radiation oncologist density was not.
Acknowledgments
The data used in the study are derived from a limited data set of the National Cancer Data Base (NCDB). The authors acknowledge the efforts of the American College of Surgeons, the Commission on Cancer and the American Cancer Society in the creation of the National Cancer Data Base. The American College of Surgeons and the Commission on Cancer have not verified and are not responsible for the analytic or statistical methodology employed, or the conclusions drawn from these data by the authors. We thank ASTRO and ASCO staff provided in-kind analysis and administrative support.
This project was supported by American Cancer Society Intramural Research Funding.
Footnotes
Publisher's Disclaimer: This is a PDF file of an unedited manuscript that has been accepted for publication. As a service to our customers we are providing this early version of the manuscript. The manuscript will undergo copyediting, typesetting, and review of the resulting proof before it is published in its final citable form. Please note that during the production process errors may be discovered which could affect the content, and all legal disclaimers that apply to the journal pertain.
Disclosure or conflict of interest: All authors did not have potential conflicts of interest to disclose.
Contributor Information
Chun Chieh Lin, American Cancer Society.
Suanna S. Bruinooge, American Society of Clinical Oncology
M. Kelsey Kirkwood, American Society of Clinical Oncology.
Dawn L. Hershman, Columbia University Medical Center.
Ahmedin Jemal, American Cancer Society.
B. Ashleigh Guadagnolo, MD Anderson Cancer Center.
James B. Yu, Yale University School of Medicine.
Shane Hopkins, William R. Bliss Cancer Center.
Michael Goldstein, Beth Israel Deaconess Medical Center.
Dean Bajorin, Memorial Sloan-Kettering Cancer Center.
Sharon H. Giordano, MD Anderson Cancer Center.
Michael Kosty, Scripps Clinic.
Anna Arnone, ASTRO.
Amy Hanley, American Society of Clinical Oncology.
Stephanie Stevens, ASTRO.
Christine Olsen, Massachusetts General Hospital.
References
- 1.National Comprehensive Cancer Network. NCCN Clinical Practice Guidelines in Oncology for Rectal Cancer. doi: 10.6004/jnccn.2009.0057. http://www.nccn.org/professionals/physician_gls/PDF/rectal.pdf [accessed 3/1/2015. [DOI] [PubMed]
- 2.Fitzgerald TL, Zervos E, Wong JH. Patterns of Pelvic Radiotherapy in Patients with Stage II/III Rectal Cancer. J Cancer Epidemiol. 2013;2013:408460. doi: 10.1155/2013/408460. [DOI] [PMC free article] [PubMed] [Google Scholar]
- 3.Fitzgerald TL, Biswas T, O’Brien K, Zervos EE, Wong JH. Neoadjuvant radiotherapy for rectal cancer: adherence to evidence-based guidelines in clinical practice. World J Surg. 2013;37:639–645. doi: 10.1007/s00268-012-1862-z. [DOI] [PubMed] [Google Scholar]
- 4.Roos M, Wong JH, Roy-Chowdhury S, Lum SS, Morgan JW, Kazanjian AK. The impact of multidisciplinary therapy in node-positive rectal cancer. Am Surg. 2010;76:1163–1166. [PubMed] [Google Scholar]
- 5.Feinstein AJ, Soulos PR, Long JB, et al. Variation in receipt of radiation therapy after breast-conserving surgery: assessing the impact of physicians and geographic regions. Med Care. 2013;51:330–338. doi: 10.1097/MLR.0b013e31827631b0. [DOI] [PMC free article] [PubMed] [Google Scholar]
- 6.Aneja S, Yu JB. The impact of county-level radiation oncologist density on prostate cancer mortality in the United States. Prostate Cancer Prostatic Dis. 2012;15:391–396. doi: 10.1038/pcan.2012.28. [DOI] [PubMed] [Google Scholar]
- 7.Aneja S, Smith BD, Gross CP, et al. Geographic analysis of the radiation oncology workforce. Int J Radiat Oncol Biol Phys. 2012;82:1723–1729. doi: 10.1016/j.ijrobp.2011.01.070. [DOI] [PubMed] [Google Scholar]
- 8.Aboagye JK, Kaiser HE, Hayanga AJ. Rural-Urban Differences in Access to Specialist Providers of Colorectal Cancer Care in the United States: A Physician Workforce Issue. JAMA Surg. 2014 doi: 10.1001/jamasurg.2013.5062. [DOI] [PubMed] [Google Scholar]
- 9.Baldwin LM, Cai Y, Larson EH, et al. Access to cancer services for rural colorectal cancer patients. J Rural Health. 2008;24:390–399. doi: 10.1111/j.1748-0361.2008.00186.x. [DOI] [PMC free article] [PubMed] [Google Scholar]
- 10.Guidry JJ, Aday LA, Zhang D, Winn RJ. Transportation as a barrier to cancer treatment. Cancer Pract. 1997;5:361–366. [PubMed] [Google Scholar]
- 11.Goodwin JS, Hunt WC, Samet JM. Determinants of cancer therapy in elderly patients. Cancer. 1993;72:594–601. doi: 10.1002/1097-0142(19930715)72:2<594::aid-cncr2820720243>3.0.co;2-#. [DOI] [PubMed] [Google Scholar]
- 12.Peipins LA, Graham S, Young R, Lewis B, Flanagan B. Racial disparities in travel time to radiotherapy facilities in the Atlanta metropolitan area. Soc Sci Med. 2013;89:32–38. doi: 10.1016/j.socscimed.2013.04.018. [DOI] [PMC free article] [PubMed] [Google Scholar]
- 13.Punglia RS, Weeks JC, Neville BA, Earle CC. Effect of distance to radiation treatment facility on use of radiation therapy after mastectomy in elderly women. International Journal of Radiation Oncology*Biology*Physics. 2006;66:56–63. doi: 10.1016/j.ijrobp.2006.03.059. [DOI] [PubMed] [Google Scholar]
- 14.Jones AP, Haynes R, Sauerzapf V, Crawford SM, Zhao H, Forman D. Travel time to hospital and treatment for breast, colon, rectum, lung, ovary and prostate cancer. Eur J Cancer. 2008;44:992–999. doi: 10.1016/j.ejca.2008.02.001. [DOI] [PubMed] [Google Scholar]
- 15.Onega T, Cook A, Kirlin B, et al. The influence of travel time on breast cancer characteristics, receipt of primary therapy, and surveillance mammography. Breast Cancer Research and Treatment. 2011;129:269–275. doi: 10.1007/s10549-011-1549-4. [DOI] [PMC free article] [PubMed] [Google Scholar]
- 16.Jones AP, Haynes R, Sauerzapf V, Crawford SM, Zhao H, Forman D. Travel times to health care and survival from cancers in Northern England. Eur J Cancer. 2008;44:269–274. doi: 10.1016/j.ejca.2007.07.028. [DOI] [PubMed] [Google Scholar]
- 17.Lerro CC, Robbins AS, Phillips JL, Stewart AK. Comparison of cases captured in the national cancer data base with those in population-based central cancer registries. Ann Surg Oncol. 2013;20:1759–1765. doi: 10.1245/s10434-013-2901-1. [DOI] [PubMed] [Google Scholar]
- 18.Bosset JF, Collette L, Calais G, et al. Chemotherapy with preoperative radiotherapy in rectal cancer. N Engl J Med. 2006;355:1114–1123. doi: 10.1056/NEJMoa060829. [DOI] [PubMed] [Google Scholar]
- 19.Marijnen CA, van de Velde CJ, Putter H, et al. Impact of short-term preoperative radiotherapy on health-related quality of life and sexual functioning in primary rectal cancer: report of a multicenter randomized trial. J Clin Oncol. 2005;23:1847–1858. doi: 10.1200/JCO.2005.05.256. [DOI] [PubMed] [Google Scholar]
- 20.Tepper JE, O’Connell M, Niedzwiecki D, et al. Adjuvant therapy in rectal cancer: analysis of stage, sex, and local control–final report of intergroup 0114. J Clin Oncol. 2002;20:1744–1750. doi: 10.1200/JCO.2002.07.132. [DOI] [PubMed] [Google Scholar]
- 21.Dartmouth Atlas of Health Care. http://www.dartmouthatlas.org/data/region/, Accessed in Oct, 2013. Available from URL: http://www.dartmouthatlas.org/data/region/ [accessed 11/24/2014.
- 22.Onega T, Duell EJ, Shi X, Wang D, Demidenko E, Goodman D. Geographic access to cancer care in the US. Cancer. 2008;112:909–918. doi: 10.1002/cncr.23229. [DOI] [PubMed] [Google Scholar]
- 23.Massarweh NN, Chiang YJ, Xing Y, et al. Association between travel distance and metastatic disease at diagnosis among patients with colon cancer. J Clin Oncol. 2014;32:942–948. doi: 10.1200/JCO.2013.52.3845. [DOI] [PMC free article] [PubMed] [Google Scholar]
- 24.Wang EH, Mougalian SS, Soulos PR, et al. Adoption of hypofractionated whole-breast irradiation for early-stage breast cancer: a National Cancer Data Base analysis. Int J Radiat Oncol Biol Phys. 2014;90:993–1000. doi: 10.1016/j.ijrobp.2014.06.038. [DOI] [PubMed] [Google Scholar]
- 25.Foroudi F, Tyldesley S, Barbera L, Huang J, Mackillop WJ. An evidence-based estimate of the appropriate radiotherapy utilization rate for colorectal cancer. International Journal of Radiation Oncology*Biology*Physics. 2003;56:1295–1307. doi: 10.1016/s0360-3016(03)00423-1. [DOI] [PubMed] [Google Scholar]
- 26.Delaney G, Barton M, Jacob S. Estimation of an optimal radiotherapy utilization rate for gastrointestinal carcinoma. Cancer. 2004;101:657–670. doi: 10.1002/cncr.20443. [DOI] [PubMed] [Google Scholar]
- 27.Mackillop WJ, Kong W, Brundage M, et al. A Comparison of Evidence-Based Estimates and Empirical Benchmarks of the Appropriate Rate of Use of Radiation Therapy in Ontario. International Journal of Radiation Oncology*Biology*Physics. 2015;91:1099–1107. doi: 10.1016/j.ijrobp.2014.11.026. [DOI] [PubMed] [Google Scholar]
- 28.Sankaranarayanan J, Watanabe-Galloway S, Sun J, Qiu F, Boilesen EC, Thorson AG. Age and rural residence effects on accessing colorectal cancer treatments: a registry study. Am J Manag Care. 2010;16:265–273. [PubMed] [Google Scholar]
- 29.Mallin K, Palis BE, Watroba N, et al. Completeness of American Cancer Registry Treatment Data: Implications for Quality of Care Research. Journal of the American College of Surgeons. 2013;216:428–437. doi: 10.1016/j.jamcollsurg.2012.12.016. [DOI] [PubMed] [Google Scholar]
- 30.Walker GV, Giordano SH, Williams M, et al. Muddy water? Variation in reporting receipt of breast cancer radiation therapy by population-based tumor registries. Int J Radiat Oncol Biol Phys. 2013;86:686–693. doi: 10.1016/j.ijrobp.2013.03.016. [DOI] [PMC free article] [PubMed] [Google Scholar]
- 31.Jagsi R, Abrahamse P, Hawley ST, Graff JJ, Hamilton AS, Katz SJ. Underascertainment of radiotherapy receipt in Surveillance, Epidemiology, and End Results registry data. Cancer. 2012;118:333–341. doi: 10.1002/cncr.26295. [DOI] [PMC free article] [PubMed] [Google Scholar]
- 32.Ballas LK, Elkin EB, Schrag D, Minsky BD, Bach PB. Radiation therapy facilities in the United States. Int J Radiat Oncol Biol Phys. 2006;66:1204–1211. doi: 10.1016/j.ijrobp.2006.06.035. [DOI] [PubMed] [Google Scholar]
- 33.Rieber GM, Benzie D, McMahon S. Why patients bypass rural health care centers. Minn Med. 1996;79:46–50. [PubMed] [Google Scholar]
- 34.Meyerhardt JA, Catalano PJ, Schrag D, et al. Association of hospital procedure volume and outcomes in patients with colon cancer at high risk for recurrence. Ann Intern Med. 2003;139:649–657. doi: 10.7326/0003-4819-139-8-200310210-00008. [DOI] [PubMed] [Google Scholar]
- 35.Onega T, Duell EJ, Shi X, Demidenko E, Goodman D. Influence of Place of Residence in Access to Specialized Cancer Care for African Americans. The Journal of Rural Health. 2010;26:12–19. doi: 10.1111/j.1748-0361.2009.00260.x. [DOI] [PubMed] [Google Scholar]
- 36.Gillan C, Briggs K, Goytisolo Pazos A, et al. Barriers to accessing radiation therapy in Canada: a systematic review. Radiat Oncol. 2012;7:167. doi: 10.1186/1748-717X-7-167. [DOI] [PMC free article] [PubMed] [Google Scholar]
- 37.Santibáñez P, Gaudet M, French J, Liu E, Tyldesley S. Optimal Location of Radiation Therapy Centers With Respect to Geographic Access. International Journal of Radiation Oncology*Biology*Physics. 2014;89:745–755. doi: 10.1016/j.ijrobp.2014.04.011. [DOI] [PubMed] [Google Scholar]
- 38.Craighead PS, Dunscombe P. Defining the elements for successful implementation of a small-city radiotherapy department. Current Oncology. 2011;18:e137–e149. doi: 10.3747/co.v18i3.741. [DOI] [PMC free article] [PubMed] [Google Scholar]
- 39.Mettlin CJ, Menck HR, Winchester DP, Murphy GP. A comparison of breast, colorectal, lung, and prostate cancers reported to the National Cancer Data Base and the Surveillance, Epidemiology, and End Results program. Cancer. 1997;79:2052–2061. doi: 10.1002/(sici)1097-0142(19970515)79:10<2052::aid-cncr29>3.0.co;2-s. [DOI] [PubMed] [Google Scholar]
Associated Data
This section collects any data citations, data availability statements, or supplementary materials included in this article.