Abstract
Ultrasonography has become one of the most popular techniques for noninvasive body assessment. The advent of sophisticated Doppler imaging has added an “information about blood flow” dimension. However, searching for complex details, despite enhanced system design and capabilities, place an increased demand on the operator. Examination technique and equipment settings are potential sources of error and therefore to obtain and interpret Doppler indices well it is essential to understand the physics of the Doppler principle and the dynamics of blood flow.
Fig. 1.

Portrait of Christian Doppler, physicist and mathematician 1901 1. .
“Mr Doppler talked about a wonderful phenomenon of the coloured light of the double stars and some other stars in the heavens. He sought the explanation of this striking phenomenon in formulating a new general theory… ”
So said the minutes of the meeting reported on Doppler's lecture in 1842 2 . This principle is now known as the Doppler Effect. It was initially discovered by Austrian mathematician Christian Doppler who hypothesised that the pitch of a sound would change if the source of the sound was moving 2 .
The word hemodynamics is derived from two Greek words meaning blood and power. Doppler ultrasound is used to detect and evaluate blood flow in the body 3 .
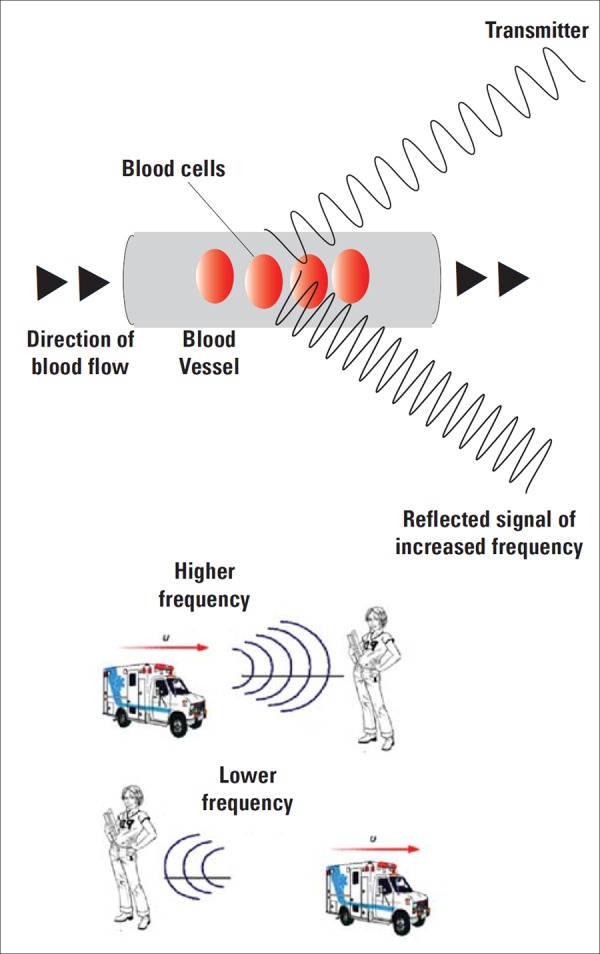
In ultrasound imaging, a series of pulses is transmitted to detect movement of blood. Echoes from stationary tissue are unchanged from pulse to pulse. However, echoes from moving scatterers show minor differences in the frequency of the signal returned to the receiver. The Doppler shift is the difference between the frequency of the incident ultrasound beam and that of the received echoes 4 . This can then be processed to create either a color flow display or a Doppler sonogram 5 .
Fig. 2.

Although the siren originating from the ambulance is of a constant pitch there is indeed an increase in the observed frequency of sound that the stationary girl hears (louder) when the ambulance is approaching her. Likewise when the sound source (ambulance) moves away from the stationary receiver there is a reduction in perceived frequency (quieter).
Scattering from erythrocytes give rise to echo signals from blood for Doppler applications. Red blood cells are called Rayleigh scatterers as their dimensions (average 8 micrometer size) are much less than the ultrasonic wave‐length 4 .
Fig. 3.

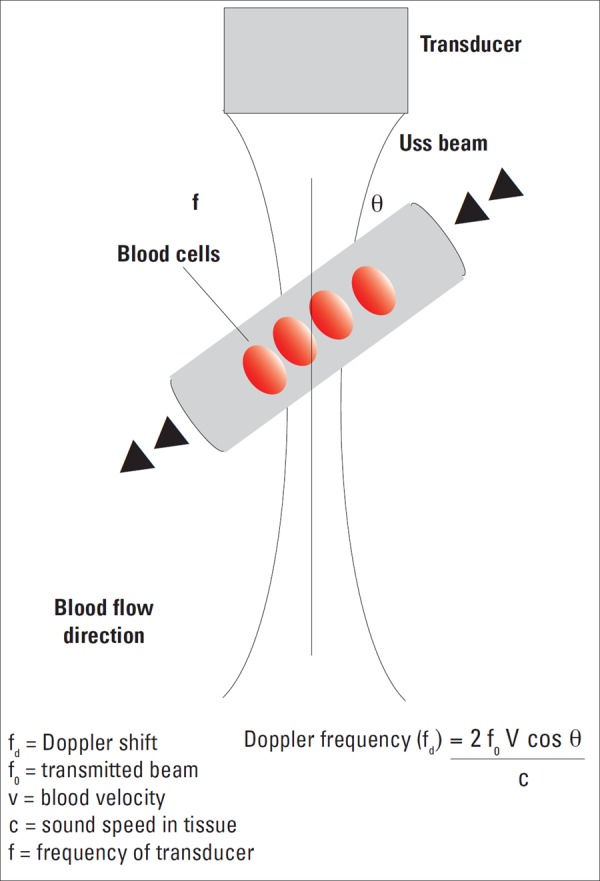
Formula for Doppler frequency calculation.
The Doppler shift frequency (fd) is the the difference between transmitted and received frequencies. It depends on the insonating frequency, the velocity of moving blood, and the intercept angle between the sound beam and direction of blood flow, as described in the Doppler equation. The equation can be rearranged to solve for blood velocity, and this is the value calculated by the Doppler ultrasound machine.
Optimal examination technique and equipment settings can improve the sensitivity of the Doppler achieved by using appropriate transducer frequency, best selection of velocity range, sample volume size, angle of approach, gain control and filter settings. Inadequate velocity range can results in aliasing.
The examination technique includes angle of insonation, the exact positioning of sample volume and amount of pressure applied to the transducer 9 .
The cosine of 90° is zero, so if the ultrasound beam is perpendicular to the direction of moving blood, there will be no Doppler shift and it will appear as though there is no flow in the vessel. Appropriate estimation of the angle of insonation, or angle correction, is essential for the accurate determination of Doppler shift and blood flow velocity.
The angle of insonation should be less than 60° at all times, since the cosine function has a steeper curve above this angle and errors in angle correction will be magnified here. This underscores the importance of having the beam as parallel to blood flow as possible 9 . This desired “zero angle” is particularly relevant for velocity quantification 9 .
Instrumentation
Doppler information can be obtained with either continuous or pulsed ultrasound waves. The major difference between the two systems is the amount of time that the beam is turned on. This is relevant to tissue energy transfer and power disposition 9 .
The major doppler techniques include continuous wave (CW) Doppler, pulsed Doppler ultrasound, colour Doppler and power Doppler sonography
1 Continous wave
Continuous wave is a simple and straightforward method of obtaining the Doppler information and the signal can be presented audibly or graphically. This is done using two piezoelectric crystal elements (one for transmission and one for signal reception) aligned at an angle to each other, in the same transducer casing. The area of overlap is the most sensitive region for signal detection. CW can measure a wide range of velocities, however no position information is available as it is impossible to separate Doppler signals from different depths. Such devices are useful for detection of fetal heart beat, used both in the hand held models and fetal cardiocotocographs (CTGs) 4 .
2 Pulsed wave Doppler
The position insensitivity of continuous wave Doppler is overcome by pulsed wave Doppler.
The pulse length and the relative amount of time the pulse is turned on ie duty factor are relevant parameters.
The maximum Doppler shift that can be accurately determined with pulsed Doppler is PRF/2, which is known as Nyquist limit hence for correct blood velocity calculation the sampling frequency (PRF) must be at least twice that of Doppler shift being assessed otherwise aliasing would occur.
3 Colour Doppler imaging
Is a real‐time blood flow display in a specified region of interest. This combines both anatomic and velocity data and display the information to the clinician in an easily comprehended format. This is a pathfinder, highlights suspicious areas and detects small vessels. Detailed quantitative analysis still requires range gate Doppler measurements.
Colour Doppler images are representations of Doppler shifts and commonly produced by a technique called autocorrelation.
Colour Doppler images are not angle corrected and do not allow the measurement of velocity.
Equipment settings are important to maximise the Doppler sensitivity. Ideally, a low frequency and lowest possible filter settings should be used.
4 Power Doppler (PD)
Similar to colour Doppler imaging the scan line is interrogated at multiple locations to generate the doppler signal however the processing methods uses the integral of the power spectrum instead of estimating variance and mean frequency via autocorrelation. PD is very sensitive to low level flow.
As power of the Doppler signal is quantified rather than mean frequency shift there is no dependence on the angle of approach. The power Doppler image colours only show that blood flow is present; and give no information about the velocity of blood flow.
Table 1.
Comparative advantages and disadvantages.
| Continous wave | Pulsed wave | Colour Doppler | Power Doppler |
|---|---|---|---|
|
Simple High sensitivity Larger sample volume No aliasing Measures high Doppler shifts No depth resolution Poor spatial resolution |
Single sample volume from gate Good spatial resolution Nyquist limit Higher intensity levels used |
Path finder Low sensitivity Highlights suspicious areas Detects small vessels Reduced ability to show low velocity flow No velocity calculation Subject to aliasing |
High sensitivity Angle independent Not subject to aliasing Poor temporal resolution Susceptible to flash artifact No velocity information No directional information Attenuation effect decreases imaging capability at depth |
The angle independence and the lack of directional information enables vessels with different directions/tourtous vessels to be displayed with uniform colour and give a clear impression on continuity.
Spectral Doppler
Above is a graph displaying frequency content of the Doppler shift plotted against time (Fig. 4).
Fig. 4.

Graph displaying frequency content of the Doppler shift plotted against time.
Multiple calculations can be obtained from the spectral display
-
■
Pulsatility index (PI)
-
■
Resistance index (RI)
-
■
Systolic/diastolic (S/D) ratio.
Velocity measurement requires angle correction whereas RI (S‐D/S) and PI (S‐D/mean velocity) are ratios and independent of angle of approach and transmitted frequency.
Conclusion
Doppler ultrasound images are basically obtained from measurements of movement. It is essential for users to appreciate the factors that affect the Doppler signal to aid improved image collection and interpretations of results in a clinical context.
Acknowledgement
Thanks to Shaista Ahmad for help with illustrations.
References
- 1. Todd D, Lynn W. Stars and Telescopes. 1901. pp 286
- 2. Schwippel J, Christian Doppler and the Royal Bohemian Society of Sciences. The Phenomenon of Doppler. Prague: 1992. pp 46–54.
- 3. Kremkau F. Diagnostic ultrasound. rinciples and instrumentation. Amsterdam: Elsevier; 2006. [Google Scholar]
- 4. Zagzebski J. Essentials of ultrasound physics. Amsterdam: Mosby; 1996. [Google Scholar]
- 5. Deane C. Doppler Ultrasound Principles and practice. Doppler in Obstetrics. Diploma in Fetal Medicine and ISUOG educational series.
- 6. Nicolaides K, Rizzo G, Hecker K and Ximenes R. Doppler inObstetrics. Diploma in Fetal Medicine and ISUOG educational series. ISUOG. [Google Scholar]
- 7. Gill RW. Measurement of blood flow by ultrasound: accuracy and sources of error. Ultrasound Med Biol 1985; 7: 625–42. [DOI] [PubMed] [Google Scholar]
- 8. Hedrick W, Hykes D, Starchman D. Ultrasound Physics and Instrumentation 2005. Amsterdam: Elsevier; 2005. [Google Scholar]
- 9. Gent R. Applied physics and technology of diagnostic ultrasound. Milner publishing; 1997. [Google Scholar]


