

Abstract
Phototropin1 is a blue light (BL) receptor in plants and shows BL-dependent kinase activation. The BL-excited light-oxygen-voltage-sensing domain 2 (LOV2) is primarily responsible for the activation of the kinase domain; however, the molecular mechanism by which conformational changes in LOV2 are transmitted to the kinase domain remains unclear. Here, we investigated BL-induced structural changes of a minimum functional fragment of Arabidopsis phototropin1 composed of LOV2, the kinase domain, and a linker connecting the two domains using small-angle x-ray scattering (SAXS). The fragment existed as a dimer and displayed photoreversible SAXS changes reflected in the radii of gyration of 42.9 Å in the dark and 48.8 Å under BL irradiation. In the dark, the molecular shape reconstructed from the SAXS profiles appeared as two bean-shaped lobes in a twisted arrangement that was 170 Å long, 80 Å wide, and 50 Å thick. The molecular shape under BL became slightly elongated from that in the dark. By fitting the crystal structure of the LOV2 dimer and a homology model of the kinase domain to their inferred shapes, the BL-dependent change could be interpreted as the positional shift in the kinase domain relative to that of the LOV2 dimer. In addition, we found that lysine 475, a functionally important residue, in the N-terminal region of LOV2 plays a critical role in transmitting the structural changes in LOV2 to the kinase domain. The interface between the domains is critical for signaling, suitably changing the structure to activate the kinase in response to conformational changes in the adjoining LOV2.
Keywords: photobiology, photoreceptor, plant molecular biology, protein kinase, x-ray scattering, blue light, phototropin
Introduction
Phototropin (phot)2 is one of the blue light (BL) receptor proteins in plants (1, 2). It plays several important roles to maximize the efficiency of photosynthesis: namely phototropism (3), chloroplast movement (4, 5), stomata opening (6), and leaf expansion (7). Most plants possess two isoforms of phot, designated as phot1 and phot2 (1). Both isoforms redundantly regulate stomata opening (6) and chloroplast accumulation depending on fluence rate of BL (3). However, only phot2 is responsible for the photoavoidance response in chloroplast relocation (4). Regarding the phototropic response, phot2 works under high irradiance condition, whereas phot1 predominantly initiates the response under low irradiance condition (3).
The structure of plant phot, which consists of ∼950–1000 amino acid residues and two flavin mononucleotide (FMN) molecules (1), folds into three functional domains (Fig. 1A). The N-terminal half contains two light-oxygen-voltage-sensing domains (LOVs) (designated LOV1 and LOV2) (8, 9), which belong to the PAS (Per-Arnt-Sim) superfamily found in heterodimeric interaction in cellular signaling. Each LOV domain receives BL via the FMN molecule bound to the pocket formed by the characteristic α-helix/β-strand-mixed structure known as the α/β-scaffold (10, 11). The C-terminal half of phot is a serine-threonine kinase (STK) domain classified into group VIII of the AGC family (12). The linker region, which has Jα-helix lying on the α/β-scaffold in the N-terminal quarter, connects LOV2 and STK (13). The LOV1 domain acts as a site for dimerization of Arabidopsis thaliana (At) phot1 and phot2 (14–17), whereas BL-activated LOV2 is primarily responsible for inducing autophosphorylation of phot (18) and phosphorylation of substrate proteins such as ABCB19 (19), PKS4 (20), and BLUS1 (21) in the downstream signaling pathways.
FIGURE 1.
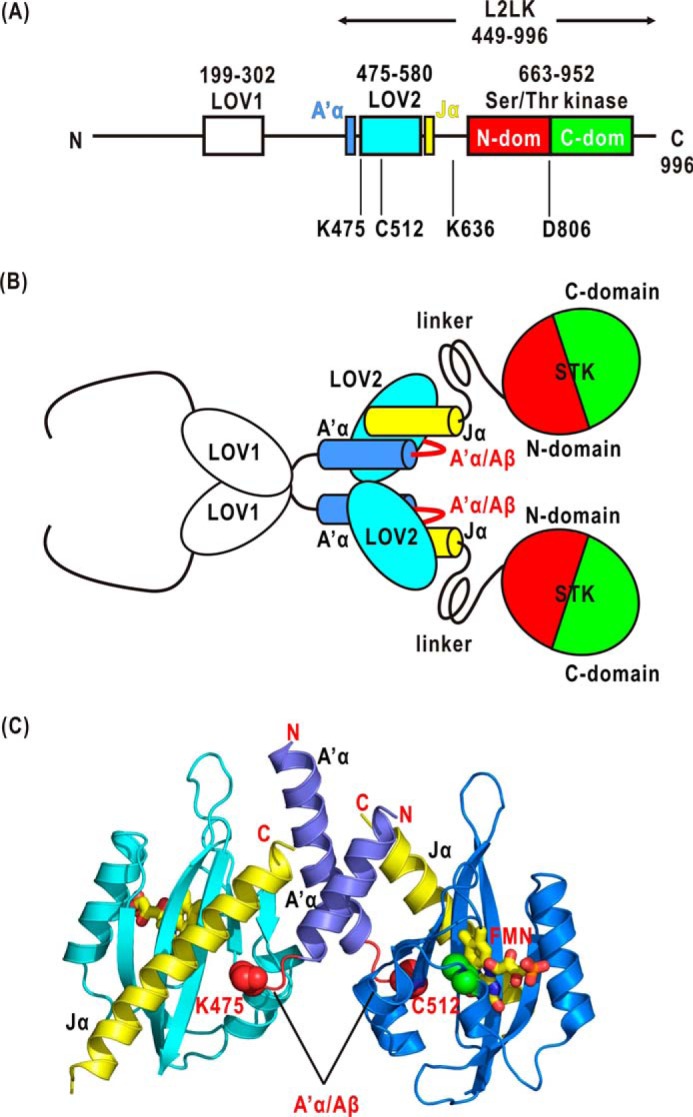
A, schematic illustration of the organization of LOV1, LOV2, and STK in the primary sequence of At phot1. The arrow indicates the region of P1L2LK used in this study. The positions of four amino acid residues mutated in this study are also shown. dom, domain. B, schematic illustration of the structure of At phot1 based on the crystal structures of LOV1 and LOV2-Jα. The arrangements of the LOV1 dimer, LOV2-Jα dimer, and STK are still unknown, however. C, the positions of the A′α/Aβ gap, the Jα-helix, and the Lys-475 and Cys-512 residues in the crystal structure of LOV2-Jα of phot1.
Structural and spectroscopic studies on phot and its functional domains have focused on the molecular mechanism for how BL-excited phot acquires the kinase activity. Upon BL irradiation, LOV undergoes a characteristic photoreaction cycle (22–24). A transient adduct is formed between FMN and a conserved Cys residue (S390 intermediate state with an absorption maximum at 390 nm) (22, 23), which then is thermally broken to the dark state (D450 with an absorption maximum at 450 nm). In the S390 of LOV2, a couple of small structural changes in the side chains of the amino acid residues near FMN are thought to be the primary step necessary for the activation of STK (18). Under BL irradiation, the Jα-helix unfolds, and then its interaction with the α/β-scaffold would change (13, 25–27).
To date, we have been investigating the minimum functional unit of phot, LOV2-linker-STK fragment (L2LK) (28, 29), to understand how the conformational changes in LOV2 propagate to STK. For example, the BL-induced rearrangement of LOV2 and STK was found in the L2LKs of At phot2 (30) and Chlamydomonas reinhardtii (Cr) phot (31, 32) through structural studies by using small-angle x-ray scattering (SAXS). Mutation studies demonstrated that amino acid residues critical to the phosphorylation activity of STK are localized around the N-terminal regions of LOV2 (33, 34). From these studies, we envision a scenario whereby the linker and its adjoining region mediate the propagation of small conformational changes in BL-excited LOV2 to STK (Fig. 1B).
In the case of At phot1, mutagenesis studies of phot1 L2LK (P1L2LK) (residues 449–996; Fig. 1A) are in progress to identify the residues necessary for the BL-dependent kinase activity (34, 35). Cys-512 residue in LOV2 is critical for the adduct formation with FMN in the photoreaction cycle. Asp-806 residue in STK is essential for the kinase activity (18). Lys-475 residue in the A′α/Aβ gap of the N terminus of LOV2 and Lys-636 residue in the linker region would have important roles in the BL-dependent kinase activity. Although the arrangement of LOV2 and STK in phot1 remains unknown, the dimer structures of LOV1 and LOV2 are now known (Fig. 1C) (14–17). Therefore, the structural roles of the lysine residues are difficult to ascertain. Here, we study the molecular structures of wild-type and mutated P1L2LK by SAXS to better understand the molecular mechanism responsible for BL-induced kinase activity of phot1.
Results
Photoreaction Kinetics of the Wild-type P1L2LK
The purity of the wild-type P1L2LK was greater than 98% as indicated by the sodium dodecyl sulfate-polyacrylamide gel electrophoresis (SDS-PAGE) pattern. Size exclusion chromatography (SEC) indicated that P1L2LK probably forms a dimer in solution in the concentration range used in the spectroscopic and SAXS measurements (0.5–2.3 mg ml−1) (Fig. 2A). The absorption spectra of D450 and S390 states were almost identical to those of the recombinant phot1 LOV2 (24).
FIGURE 2.
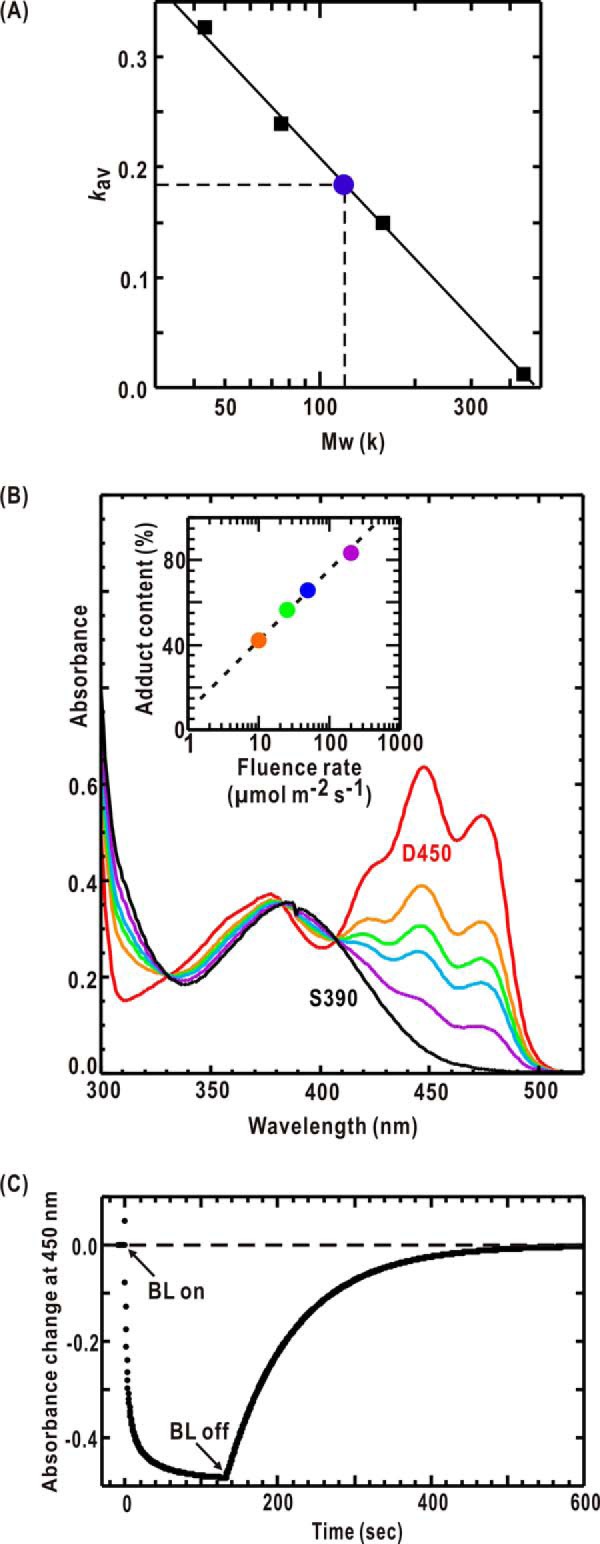
Purification and characterization of wild-type P1L2LK. A, the elution in SEC. When a solution of 10 mg ml−1 is applied (filled circle), L2LK elutes at an elution volume corresponding to a globular protein of 123 kDa, approximately twice the molecular mass of P1L2LK. The concentration in the elution peak was 0.1 mg ml−1. Ovalbumin (44 kDa), conalbumin (75 kDa), aldolase (158 kDa), and ferritin (440 kDa) were used for the molecular mass standards (black square). B, absorption spectra of D450 in the dark (solid red line) and under BL (λmax = 460 nm) at fluence rates of 10 (orange), 25 (green), 50 (cyan), and 200 (purple) μmol m−2 s−1. The black line shows the absorption spectrum of S390 extrapolated from those spectra under different BL irradiation. The inset depicts the fluence dependence in the accumulation of S390. C, kinetics of S390 formation of P1L2LK under BL irradiation of 200 μmol m−2 s−1 and its reversion in the dark conditions as monitored by the absorption at 450 nm.
Under successive BL irradiation, the amount of accumulated S390 depended on the fluence of BL because of the dark (thermal) reversion from S390 to D450. For SAXS measurements, almost all of the P1L2LK in solution sample must be converted to the S390 state under BL irradiation. To estimate the fluence rate necessary to accumulate almost completely S390, we measured the amount of S390 under BL irradiation by using our custom-made cell holder mounted on the UV-visible spectrometer. This device is limited to measuring the UV-visible spectra under a fluence rate of less than 200 μmol m−2 s−1 because of the stray light under high fluence rate. Therefore, we measured the amount of S390 under a fluence rate of less than 200 μmol m−2 s−1. Then the fluence rate necessary for the almost complete accumulation of S390 was estimated to be 400 μmol m−2 s−1 by an extrapolation (see Fig. 2B, inset).
Within 120 s after starting BL irradiation of 200 μmol m−2 s−1, the amount of L2LK in S390 reached saturation. The thermal dark reversion took more than 400 s after turning off BL at 293 K (Fig. 2C). After BL irradiation of 200–400 μmol m−2 s−1, P1L2LK undergoes photoreaction. This result indicated little molecular damage in P1L2LK under the BL irradiation of the fluence rate of 400 μmol m−2 s−1.
BL-induced Conformational Changes of the Wild-type P1L2LK
Little x-ray radiation damage to the samples was found as verified by very small differences between the absorption spectra and SDS-PAGE patterns of specimens before and after the exposure to x-rays within one round of DK1-BL1-DK2 exposures. To avoid x-ray radiation damage during several rounds of x-ray exposure, SAXS profiles of the three states were recorded through only one round of exposure as done in our previous SAXS studies on the LOV2-linker-kinase fragment of At phot2 (30) and full-length phot of Chlamydomonas (31).
For each P1L2LK solution, we sequentially recorded the SAXS profiles of P1L2LK in the order of DK1, BL1, and DK2 states (Fig. 3A). The scattering intensities of BL1 increased in S < 0.003 Å−1 but decreased in 0.004 < S < 0.010 Å−1 for the DK1 state (Fig. 3A). The SAXS profiles of the DK2 state resembled those of the DK1 state rather than the BL1 state. The profile difference, calculated by subtracting the profile of the BL1 state from that of the DK1 state, is negative in S < 0.003 Å−1 with a maximum at approximately S = 0.005 Å−1. The profile difference obtained by subtracting the profile of the BL1 state from that of the DK2 state is positive in S < 0.003 Å−1 with a minimum at approximately S = 0.005 Å−1. Because these two cases are almost opposite in sign, the SAXS changes reflecting BL-induced conformational alternation of P1L2LK were probably photoreversible.
FIGURE 3.

A, the SAXS profiles and structure models of DK1 (red dots), BL1 (blue), and DK2 (green). The profiles are shown as a semilogarithmic form of the scattering intensity. B, difference SAXS profiles calculated by subtracting DK1 from BL1 (magenta) and DK2 from BL1 (cyan). C, the P(r) functions of DK1 (Dmax of 146 ± 2 Å), BL1 (162 ± 2 Å), and DK2 (152 ± 2 Å). D, Guinier plots, which represent the logarithm of the scattering intensity plotted against the square of the scattering vector, for DK1 (red symbols), BL (blue), and DK2 (green) solutions of 0.8 mg ml−1. The data are shifted appropriately along the ordinate for clarity. The regression lines of the Guinier approximation were calculated using the least square fitting method for the regions indicated by arrows. The high angle edges of the region (S2 = 35–40 × 10−6 Å2) satisfy the criteria for reliable approximation (SRg < (2π)−1). E, the concentration-dependent variations of Rg(C)2 (upper panel) and C/I(0, C) (lower panel) of DK1 (red), BL (blue), and DK2 (green). Error bars represent S.D. For the C/I(0, C) data, S.D. lie within the symbols.
When taking into consideration the reciprocity between the length of the scattering vector and the distance between any pairs of large electron density clusters, such as functional domains, the changes in 0.004 < S < 0.010 Å−1 suggest rearrangement of domains separated by ∼150 Å. In this regard, differences in the P(r) functions between the DK1 and BL1 states were prominent at r > 100 Å (Fig. 3C).
The Guinier plots for SAXS profiles of P1L2LK in the DK1, BL1, and DK2 states could be approximated by straight lines in S2 < 40 × 10−6 Å−2 (Fig. 3D). The calculated C/I(S = 0, C) and Rg2(C) values displayed almost linear concentration dependences (Fig. 3E), indicating their monodispersive properties. The apparent molecular weight estimated from I(S = 0, C = 0) indicated that P1L2LK forms a dimer both in the dark and under BL. This result is consistent with the crystal structure of LOV2-Jα (17) and the SEC prior to the SAXS measurements. Because the I(S = 0, C = 0) value of the DK1 state is almost the same as that of the BL1 state, the dimer structure is kept under BL irradiation.
The P1L2LK in the BL1 state had an Rg(C = 0) of 48.8 ± 0.5 Å that was significantly larger than that of either the DK1 date (42.9 ± 0.5 Å) or the DK2 state (43.5 ± 0.5 Å). This increase in Rg(C = 0) suggests an expansion and/or hydration changes in P1L2LK under BL. The slightly greater Rg(C = 0) of the DK2 state than that of the DK1 state indicates that the thermal reversion of the overall structure proceeded more slowly than did the structural relaxation around the FMN monitored in the absorption spectra (Fig. 2B).
Molecular Shape of the Wild-type L2LK
Each molecular shape, restored by applying the GASBOR program to the observed SAXS profile, gave a theoretical scattering curve that closely matched those observed with χ2 values of 2% (Fig. 4A). Following the principal component analysis (PCA) and K-means clustering analysis, the molecular shapes of DK1, BL1, and DK2 were calculated from 472, 380, and 307 restored models, respectively.
FIGURE 4.
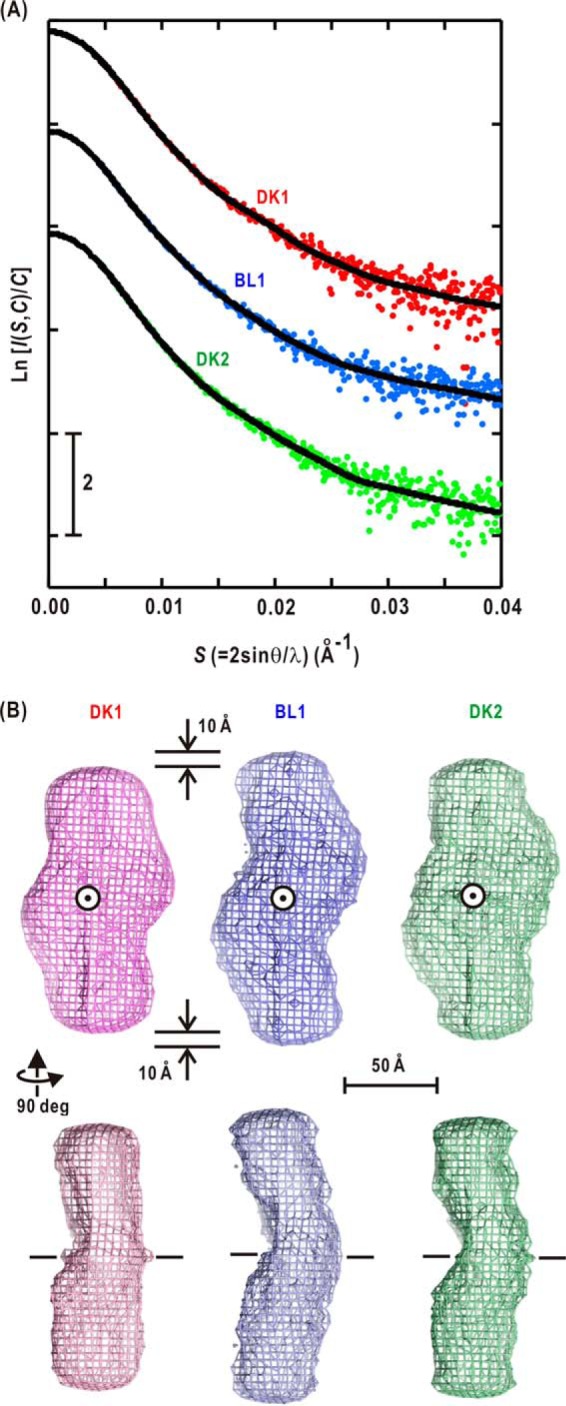
A, the SAXS profiles of DK1 (red symbols), BL1 (blue), and DK2 (green) are compared with the calculated profiles of GASBOR models (black). The scattering intensities are plotted in semilogarithmic form and shifted appropriately along the ordinate for clarity. B, the molecular shapes of DK1 (pink mesh), BL1 (blue), and DK2 (green) are displayed as density maps of dummy residues in 4 × 4 × 4-Å3 cubes after averaging the restored models. The 2-fold symmetry axes of the models are indicated by circles in the upper panels and dashed lines in the lower panels. deg, degrees.
The averaged molecular shape of P1L2LK in the DK1 state appeared as two bean-shaped lobes in a twisted arrangement along the long molecular axes (Fig. 4B). Its dimensions are 170 Å long, 80 Å wide, and 50 Å thick. The molecular shape of the BL1 state was slightly different from that of the DK1 state. The two lobes were elongated and simultaneously tilted by ∼30° against the 2-fold symmetry axis of the dimer. Then the dimension along the molecular axis was enlarged by ∼20 Å from that of the DK1 state. The molecular shape and dimensions of P1L2LK in the DK2 state are more similar to those of the DK1 state than of the BL1 state.
Structure Changes of the Mutated P1L2LK under BL
Structural roles of Lys-475 and Lys-636 residues located at the interface between LOV2 and STK were studied through SAXS for K475A/D806N and K636A/D806N double mutants. K475A and K636A mutations cause reduction of the kinase activity of STK (34, 35). D806N mutation results in the loss of the phosphorylation activity of STK because the side chain of the Asp-806 residue is expected to stabilize the position of a magnesium ion necessary for the ATPase activity as well as various kinases (36). Therefore, the D806N mutation was introduced to avoid heterogeneity of P1L2LK in regard to phosphorylation in the purification (29). As a reference, the C512A/D806N mutant was used to examine whether BL irradiation is essential for structural changes because C512A mutation results in the loss of adduct formation capability under BL irradiation. Prior to SAXS measurements, the dark reversion kinetics of D806N, K475A/D806N, and K636A/D806N mutants were determined through UV-visible absorption measurements.
Prior to the x-ray measurements, the relaxation times of the S390 states of D806N, K475A/D806N, and K636A/D806N were determined by measuring their UV-visible absorption. The relaxation time in D806N was 93 s, which is nearly the same as that of the wild-type (91 s). This result indicates that the mutation in STK has little influence on the photoreaction of LOV2 as well as in the case of LOV2-linker-kinase of At phot2 (30). In contrast, the K475A and K636A mutations yielded relaxation times of 69 (34) and 78 s (35), respectively.
We measured SAXS of four mutants in which amino acid residues important for phot activity were substituted to alanine (Fig. 5A). We qualitatively examined whether BL-induced changes in structure of the mutated P1L2LK were similar to that of the wild-type P1L2LK by comparing the difference in SAXS profiles between DK1 (DK2) and BL1 (Fig. 5B) with those of the wild type (Fig. 2B).
FIGURE 5.

A, the SAXS profiles of D806N, C512A/D806N, K475A/D806N, and K636A/D806N mutants in DK1 (red dots), BL1 (blue), and DK2 (green). B, difference in SAXS profiles of the four mutants. C, the time course of integrated SAXS intensity in S < 0.003 Å−1 (red symbols) and the absorption at 450 nm (blue symbols). D, the semilogarithmic plot for C. The absorption change is approximated by an exponential function from 100 to 300 s after turning off BL. The other exponential function explains the decrease of SAXS intensity in 150–700 s.
The SAXS changes in D806N mutant were similar to those of the wild type (Fig. 5B), suggesting this mutation had little influence on the BL-induced conformational changes. The D806N mutation is only critical for ATPase activity of STK as well as D720N mutation in the phot2 LOV2-linker STK fragment (30). Therefore, SAXS measurements for double mutants with D806N and the other single mutations reflect the influence of the single mutation on the structure and function of P1L2LK.
Regarding the C512A/D806N mutant, which lacks the capability to form S390 under BL, little profile change around S = 0.005 Å−1 is observed (Fig. 5B). Hence, these SAXS changes in the wild-type and D806N mutant profiles are caused by the BL-induced S390 formation in LOV2.
The K475A mutation in the A′α/Aβ gap causes the loss of BL-induced kinase activity, although the LOV2 still yielded S390. The amount of S390 was approximately comparable with that in the wild-type P1L2LK under BL (34). The DK1 of the K475A/D806N-mutated P1L2LK probably forms oligomers as indicated by the significant deviation of the SAXS profile from that expected of a monodispersive solution in S < 0.003 Å−1 (Fig. 5A). The profile differences in 0.003 < S < 0.010 Å−1 were qualitatively different from those of the wild-type and the D806N-mutated P1L2LK (Fig. 5B).
Interestingly, as depicted in Fig. 5C, the SAXS profile of K475A/D806N mutation in S < 0.003 Å−1 increased dramatically after starting BL irradiation with a delay of ∼100 s, whereas the LOV2 was immediately converted to S390 as monitored by the absorption change. The SAXS change is observed in every sample and almost independent of concentration of samples measured. From the SAXS changes for 2 min after turning off BL, we estimated that the amount of oligomeric K475A/D806N mutants in S390 decreased with a half-life time of 239 s (relaxation time of 345 s) under the approximation of single exponential decay. Regarding the absorption change, the half-life time was 89 s (decay- constant of 128 s), which is similar to the decay speed in a previous report (34). Therefore, the decay of S390 proceeded significantly faster than the deoligomerization of K475A/D806 double mutant. The decrease in the scattering intensity depends on the dissociation of oligomers, probably caused by the relaxation of the BL-induced conformational changes. It should be noted that this series of 14 SAXS measurements was conducted with attenuated x-ray beam to avoid radiation damage. In fact, the absorption and the SDS-PAGE patterns after the x-ray exposures displayed little differences from those before the measurement.
The K636A mutation in the middle of the linker region resulted in the reduction of the BL-dependent kinase activity to 30% of the wild type (35). The similarity of profile differences among the wild-type P1L2LK and K636A/D806N and D806N mutants suggests that the BL-induced rearrangement of functional domains is necessary for kinase activity (Fig. 5, A and B).
Discussion
The present study on P1L2LK has revealed that BL-excited LOV2 causes global conformational changes detectable by SAXS. Based on the present results, we now discuss the arrangement of functional domains and the structural roles of lysine residues composing the A′α/Aβ and linker regions for the BL-induced kinase activity of P1L2LK.
Arrangement of the Functional Domains in P1L2LK
The present SAXS study and the SEC measurement revealed the dimeric association of P1L2LK. Here, we discuss the arrangement of LOV2 and STK domains in the restored molecular shapes of P1L2LK dimer (Fig. 6A). For the molecular shape of DK1, the crystal structure model of LOV2-Jα dimer (17) fit to the center part of the molecular shape well. In addition, two homology models of STK can be placed in the bean-shaped lobes such that the N-terminal domain of STK faces both the Jα-helix and the A′α/Aβ gap. For BL1, the LOV2-Jα subunits are fitted to the molecular shape by altering the rearrangement under restraint to satisfy small changes in the SAXS of the LOV2-linker fragment under BL (14). Each of two STK models fits well to the lobe.
FIGURE 6.
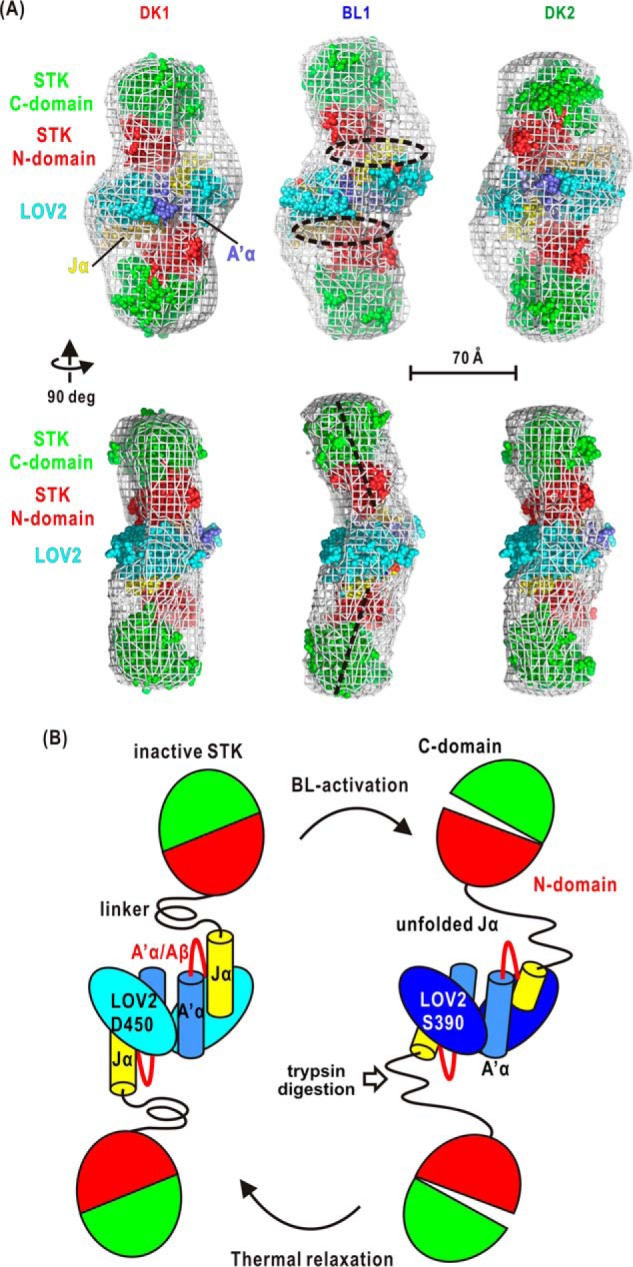
A, arrangement of the LOV2-Jα dimer (Protein Data Bank code 4HHB) and the two STKs in the molecular shapes of DK1, BL1, and DK2 (white mesh). The homology model of STK is built from the crystal structure of cAMP-dependent protein kinase in the unliganded state (Protein Data Bank code 1J3H) as a template. The dashed circles indicate the interface between LOV2 and STK. The dashed lines in the perpendicular view of the BL1 model indicate the molecular axes of STKs. In this arrangement, it is difficult for one subunit to make contact with the other subunit for intramolecular phosphorylation. deg, degrees. B, schematic illustration of the BL-induced conformational changes of L2LK based on the experimental results presented here.
The molecular structure of P1L2LK in the BL1 state has a longer molecular shape than that in the DK1 state. Each STK in the BL1 state is likely located at a different position from that in the DK1 state. In the previous trypsin digestion assay for P1L2LK (34), Lys-603 of the Jα-helix is first digested by trypsin under BL. After a moment, a trypsin molecule can digest the Lys-475 of the A′α/Aβ gap region. In contrast, both lysine residues are difficult to digest in the dark (34). Taken together, the BL-induced conformational changes in the Jα-helix and A′α/aβ gap likely drive the positional shifts of STK (Fig. 6B). In the proposed arrangement of the functional domains, it is difficult for each STK to phosphorylate the other STK in the dimer.
The rearrangement of LOV2 and STK under BL is observed in monomeric At phot2-LOV2-linker-STK (30) and in monomeric Cr phot (31). In the case of Cr phot, the residues composing the Jα-helix and adjoining region are known to be critical for the BL-dependent kinase activity (33). The rearrangements of LOV2 relative to STK observed in P1L2LK are similar to those observed in At phot2-LOV2-linker-STK and Cr phot under BL. Although the quaternary structures and amino acid sequences are different among the three phots, molecular mechanisms in the BL-induced rearrangements of LOV2 and STK would be similar among them. To discuss further these molecular mechanisms, we must study the roles of amino acid residues composing the interface between LOV2 and STK critical for transmitting BL-induced conformational changes in LOV2 to STK.
The Roles of Lys-475 and Lys-636 in BL-induced Kinase Activation
The wild type and D806N mutants displayed photoreversible changes in their SAXS profiles (Fig. 5B), whereas the C512A/D806N mutant did not. Thus, the photoreversible change around S = 0.005 Å−1 of the SAXS profiles could be useful to examine whether BL-induced conformational changes occur in mutated P1L2LK.
Here we speculate the mechanism in oligomer formation/deformation of K475A/D806N mutant. In our structural model proposed (Fig. 6A), K475A residue located at the interface between LOV2 and STK would contribute to the drastic changes of surface properties under BL irradiation. The conformation of K475A is thought to depend on the small conformational changes in the α/β-scaffold of LOV2. Then the surface structures change to increase intermolecular interactions among P1L2LK in specimens. The loop structures in the linker region may contribute to the association of P1L2LK under BL, but the structure of this region is unclear due to the lack of the crystal structure of P1L2LK.
The different SAXS profiles and the lack of BL-induced kinase activity in the K475A mutant suggest that the K475A mutation probably causes conformational changes to prevent the propagation of a structural signal from LOV2 to STK. The photoreversible association/dissociation implies that the Lys-475 mutation induces conformational changes different from that of the wild type. Therefore, Lys-475 and the adjoining amino acid residues may function as a switch that regulates the propagation of structural changes from LOV2 at the S390 state to STK.
The profile difference of the K636A/D806N mutant was similar to those observed for the wild type and D806N mutant. In addition, the Lys-636 mutation only reduced the BL-dependent kinase activity. Therefore, the capability to rearrange functional domains under BL is kept in the K636A mutant. However, the reduced kinase activity implies that lysine is more functionally suitable than alanine at position 636 to correctly transmit the structural changes from LOV2 to STK.
In the transmission of conformational changes from LOV2 to STK, Lys-475 is critical, whereas Lys-636 may play a role in optimally transmitting these conformational changes to STK. Through SAXS measurements of the other mutated P1L2LKs, the structural roles of residues should be investigated further based on the kinase activity and SAXS changes under BL.
In the beamtime at the synchrotron facility, the longest time to measure the thermal reversion is 15 min for each sample solution. To measure how long the thermal reversion takes, management of the measurement schedule should be taken into consideration in the near future.
Dimerization of Phot1
The present SAXS evidence as well as the quaternary structures of LOV1 (15, 16) and LOV2-Jα (17) implies that full-length At phot1 probably exists as a dimer. However, the arrangement of the LOV1 dimer relative to the LOV2 dimer is still unknown. To date, the molecular shape of monomeric full-length Chlamydomonas phot is known (31). In Chlamydomonas phot, LOV1 and LOV2 likely have direct contacts, probably because the number of amino acid residues linking LOV1 and LOV2 is ∼80. In contrast, the corresponding linker in phot1 is composed of approximately twice the number of amino acid residues as that of Chlamydomonas phot, and the arrangement of the LOV1 dimer relative to the LOV2 dimer and two STKs is difficult to speculate (Figs. 1A and 7). However, the N-terminal region composed of 200 amino acid residues may contact the active site cleft of STK within a subunit (Fig. 7) because the phosphorylation sites of phot1 known so far are predominantly located in the N-terminal region (37). Thus, not only intermolecular but also intramolecular autophosphorylation is likely possible.
FIGURE 7.
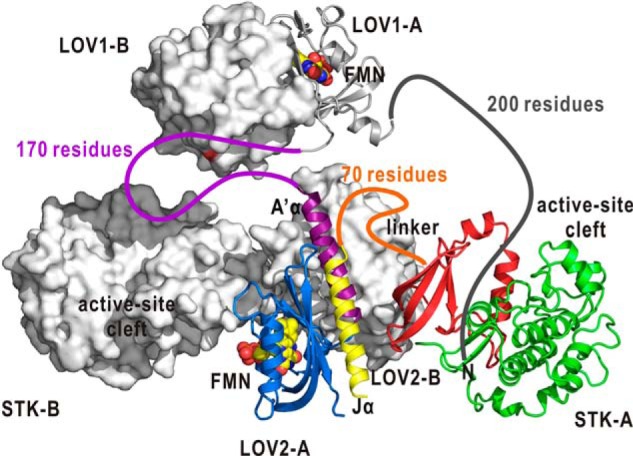
A putative model of phot1 dimer expected from the present SAXS model (Fig. 6A) and the crystal structure of phot1 LOV1 dimer (15). The functional domains in the subunit designated as A are illustrated as ribbon models in the coloring scheme used in Fig. 1, B and C. The N-terminal region and those connecting the domains are illustrated as colored lines. The approximate number of residues composing each region is labeled. The functional domains in the other subunit are displayed as surface-rendered models. In this model, intramolecular phosphorylation of the N-terminal region may be possible.
To characterize the arrangement of LOV1 further, a SAXS study or crystal structure analysis of full-length phot1 is necessary, although we have not yet succeeded in the preparation of full-length phot1. In this regard, it is of interest to study whether monomeric phot1 can activate the signaling system in vivo through modifying the residues necessary for dimerization for LOV1 (15) and LOV2 (17).
Experimental Procedures
Sample Preparation
We prepared wild-type P1L2LK, one single mutant (D806N), and three double mutants (C512A/D806N, K475A/D806N, and K636/D806N), all of which have histidine tags attached to their N-terminal end with the expression vectors reported previously (28, 34, 35). The D806N mutation for the double mutants was introduced through PCR-based site-directed mutagenesis with the following two primers: 5′-GCGATATCTCTTTGTCGAATTTTGATCTGTCTTGC-3′ and 5′-GCAAGACAGATCAAAATTCGACAAAGAGATATCGC-3′. The vectors for the three double mutants were prepared from the vector used for D806N mutation following a procedure already reported (28).
The P1L2LK peptides were overexpressed in Escherichia coli BL21(DE3) and purified by means of nickel affinity chromatography and SEC as described previously (28). Because SAXS measurements require sample solutions with a high purity of 95% or greater, each peptide was purified further through anion exchange chromatography using a Mono Q column (GE Healthcare) (30). The purity of each specimen was examined by SDS-PAGE using Coomassie Brilliant Blue staining. To estimate the molecular weights of the purified fragments, SEC was used with a Sephacryl S-200 column (GE Healthcare). Purified L2LK was stored in a buffer containing 20 mm Tris-HCl, pH 7.8, 100 mm NaCl, 10% (w/v) glycerol, and 1 mm EGTA.
Measurement of UV-Visible Absorption Spectra
Absorption spectra and the time course of absorption changes during thermal decay of S390 to D450 were measured at 293 K using a U-3310 spectrophotometer (Hitachi-High Technologies, Japan). The sample chamber of the spectrophotometer was modified to measure the spectrum of sample solution under continuous BL irradiation at a fluence rate of less than 200 μmol m−2 s−1. For a high fluence rate of greater than 200 μmol m−2 s−1, it is difficult to measure the spectrum under continuous BL irradiation because stray light significantly increasing inside the sample chamber prevents the measurement. When carrying out the scan measurement just after shutting out BL, the scanned spectrum contains the spectrum from P1L2LK fragment in the thermal recovery process. Thus, we estimated the spectrum of S390 by extrapolating from those recorded under a fluence rate of 200 μmol m−2 s−1.
The P1L2LK solutions, at a concentration of 37 μm in 20 mm Tris-HCl, 500 mm NaCl, 1 mm EDTA, and 10% (w/v) glycerol, pH 7.8, were measured after a centrifugation at 100, 000 × g for 30 min at 277 K. A blue photodiode illuminator (λmax = 460 nm) was used for the light activation of fragments. The fluence rate of the photodiode was changed in the range of 10–200 μmol m−2 s−1 to estimate the amount of S390 intermediate in sample solutions under continuous BL irradiation. The time course of absorption changes under both BL illumination at a fluence rate of 190 μmol m−2 s−1 and in darkness was monitored at 447 nm (28).
SAXS Measurement
The SAXS measurements were performed at BL45XU of SPring-8. The wavelength of the x-ray was 1.0000 Å, and the camera distance was ∼2500 mm. The temperature of a specimen cell was maintained at 293 K. The SAXS patterns of wild-type and mutated P1L2LK were recorded by a PILATUS 300K-W. Each successive SAXS pattern of the wild type was accumulated as 12 time-resolved frames at a 5-s exposure, whereas those of the mutants were accumulated as 20 frames at a 1-s exposure. Intensities of the incident x-ray beam were kept constant during the experiments by the top-up operation of the SPring-8 storage ring.
For each specimen solution, SAXS patterns were measured sequentially in the dark (the DK1 state), under BL of 450 μmol m−2 s−1 after preirradiation for 5 min (the BL1 state), and then in the dark after a dark adaptation for 15 min (the DK2 state). By comparing SAXS profiles of the DK1 state and the BL1 state, we could examine whether BL-induced conformational changes occur in P1L2LK under the BL1 state. In addition, by comparing SAXS profiles from the BL1 state and the DK2 state, structural changes during the thermal reversion can be monitored.
When recording the SAXS profiles in the thermal reversion of the K475A/D806N mutant, the x-ray beam was attenuated to 6% of the original flux intensity by using aluminum foil with a thickness of 800 μm. This attenuation is necessary to reduce radiation damage during successive exposures to x-rays. The specimen solution was irradiated by BL for 40 s. Then the SAXS profile was recorded for 30 s as time-resolved frames of a 10-s exposure by using a PILATUS 3X 2M detector. The schedule of x-ray exposure is given under “Results.”
SAXS Analysis
Each two-dimensionally recorded SAXS pattern was reduced to a one-dimensional profile through circular averaging from which the background scattering of buffer solution was subtracted. The Guinier approximation (38) was applied to the SAXS profiles. The scattering intensity I(S, C) at a scattering vector S and a protein concentration C is expressed using the forward scattering intensity, I(0, C), and the radius of gyration of the solute, Rg(C), as follows.
 |
 |
where λ and 2θ are the x-ray wavelength and the scattering angle, respectively. Under diluted conditions, the concentration dependences of I(S = 0, C) and Rg(C)2 were approximated as follows.
 |
where K is a geometrical constant in the SAXS measurement, Mw is the apparent molecular weight of protein, A is the second virial coefficient, and B depends on the interprotein interactions (36). Assuming a partial specific volume of 0.74 cm3 g−1 for soluble proteins, the Mw of solute is determined by reference to I(S = 0, C = 0) of hen egg white lysozyme serving as a reference. The pair correlation functions P(r) were calculated using the program GNOM (39).
Molecular Shape
The molecular shapes of P1L2LK were predicted by applying the ab initio structure determination program GASBOR (40) to the x-ray scattering profiles in S < 0.04 Å−1. This program minimizes the discrepancy between the experimental (Iexp(S)) and the calculated (Imodel(S)) scattering profiles in retaining compact packing of the dummy residues representing the molecular structure. The discrepancy between the experimental and calculated profiles is monitored using the following equation.
 |
where N is the number of data points, K is a scale factor, and σ(Sj) is the statistical error of Iexp(Sj) at the scattering vector Sj.
The optimum number of dummy residues is that which gives the smallest χ2 values as an average. This was searched for by varying the number between 450 and 650 per subunit with a step of 25. For each number, the GASBOR calculations were conducted independently 20 times, each time starting from different models. For the optimum number of dummy residues, GASBOR calculations began from 576 different models for each state. Calculations were performed on a supercomputer system with 576 cores of Intel Xeon CPU X5690 (3.7 GHz per core).
Each model shape is expressed as an assembly of voxels of 4 × 4 × 4 Å3 for subsequent analyses. After superimposition, all restored molecular shapes are classified into several groups by applying PCA followed by K-means clustering. In PCA, molecular shapes in a multidimensional space were projected onto the plane spanned by the first and second principal components. After applying the K-means clustering, we obtained the best molecular shape as the average for models composing the largest class. The details of the analysis will be published elsewhere.3 Finally, the molecular shapes are conveyed as density maps of the dummy residues in 4 × 4 × 4-Å3 cubes. It should be noted here that the mirror images of the molecular models could also explain the measured scattering profiles. The molecular models are illustrated using PyMOL (41).
Author Contributions
K. O., T. O., M. Y., and M. N. designed the study and wrote the paper. S. K. constructed vectors and purified P1L2K and mutants. M. O., S. K., Y. T., K. O., and T. H. performed SAXS. T. H. and M. Y. set up the BL45XU beam line at Spring-8. M. O., K. O., T. O., and M. N. analyzed the results.
Acknowledgments
The SAXS experiments were performed under the approval of the RIKEN Harima Institute (Proposals 2011007, 20140018, and 20150021). We are grateful to Professor Satoru Tokutomi of Osaka Prefecture University for encouragement and support in the preliminary stage of this study.
This work was supported by Grants-in-aid for Scientific Research jp15076210, jp20050030, jp1920402, jp22018027, jp22244054, jp23120525, jp24654140, jp25120725, jp15H01647, and jp16H02218 (to M. N.); jp24113723 (to T. O.); and jp15K18559 (to K. O.) from the Ministry of Education, Culture, Sports, Science and Technology, Japan. The authors declare that they have no conflicts of interest with the contents of this article.
M. Oide, Y. Sekiguchi, T. Oroguchi, and M. Nakasako, manuscript in preparation.
- phot
- phototropin
- At
- A. thaliana
- Cr
- C. reinhardtii
- BL
- blue light
- BL1
- state under blue light irradiation in small-angle x-ray scattering
- D450
- dark state
- DK1
- dark state 1 in small-angle x-ray scattering experiment
- DK2
- dark state 2 in small-angle x-ray scattering experiment
- LOV
- light-oxygen-voltage
- P1L2LK
- phot1 L2LK
- phot1
- At phototropin1
- phot2
- At phototropin2
- S390
- adduct state
- SAXS
- small-angle x-ray scattering
- STK
- serine-threonine kinase
- L2LK
- LOV2-linker-STK fragment
- SEC
- size exclusion chromatography
- PCA
- principal component analysis.
References
- 1. Christie J. M. (2007) Phototropin blue-light receptors. Annu. Rev. Plant Biol. 58, 21–45 [DOI] [PubMed] [Google Scholar]
- 2. Christie J. M., Reymond P., Powell G. K., Bernasconi P., Raibekas A. A., Liscum E., and Briggs W. R. (1998) Arabidopsis NPH1: a flavoprotein with the properties of a photoreceptor for phototropism. Science 282, 1698–1701 [DOI] [PubMed] [Google Scholar]
- 3. Sakai T., Kagawa T., Kasahara M., Swartz T. E., Christie J. M., Briggs W. R., Wada M., and Okada K. (2001) Arabidopsis nph1 and npl1: blue light receptors that mediate both phototropism and chloroplast relocation. Proc. Natl. Acad. Sci. U.S.A. 98, 6969–6974 [DOI] [PMC free article] [PubMed] [Google Scholar]
- 4. Kagawa T., Sakai T., Suetsugu N., Oikawa K., Ishiguro S., Kato T., Tabata S., Okada K., and Wada M. (2001) Arabidopsis NPL1: a phototropin homolog controlling the chloroplast high-light avoidance response. Science 291, 2138–2141 [DOI] [PubMed] [Google Scholar]
- 5. Jarillo J. A., Gabrys H., Capel J., Alonso J. M., Ecker J. R., and Cashmore A. R. (2001) Phototropin-related NPL1 controls chloroplast relocation induced by blue light. Nature 410, 952–954 [DOI] [PubMed] [Google Scholar]
- 6. Kinoshita T., Doi M., Suetsugu N., Kagawa T., Wada M., and Shimazaki K. (2001) Phot1 and phot2 mediate blue light regulation of stomatal opening. Nature 414, 656–660 [DOI] [PubMed] [Google Scholar]
- 7. de Carbonnel M., Davis P., Roelfsema M. R., Inoue S., Schepens I., Lariguet P., Geisler M., Shimazaki K., Hangarter R., and Fankhauser C. (2010) The Arabidopsis PHYTOCHROME KINASE SUBSTRATE2 protein is a phototropin signaling element that regulates leaf flattening and leaf positioning. Plant Physiol. 152, 1391–1405 [DOI] [PMC free article] [PubMed] [Google Scholar]
- 8. Möglich A., Ayers R. A., and Moffat K. (2009) Structure and signaling mechanism of Per-ARNT-Sim domains. Structure 17, 1282–1294 [DOI] [PMC free article] [PubMed] [Google Scholar]
- 9. Möglich A., Yang X., Ayers R. A., and Moffat K. (2010) Structure and function of plant photoreceptors. Annu. Rev. Plant Biol. 61, 21–47 [DOI] [PubMed] [Google Scholar]
- 10. Crosson S., and Moffat K. (2001) Structure of a flavin-binding plant photoreceptor domain: insights into light-mediated signal transduction. Proc. Natl. Acad. Sci. U.S.A. 98, 2995–3000 [DOI] [PMC free article] [PubMed] [Google Scholar]
- 11. Crosson S., and Moffat K. (2002) Photoexcited structure of a plant photoreceptor domain reveals a light-driven molecular switch. Plant Cell 14, 1067–1075 [DOI] [PMC free article] [PubMed] [Google Scholar]
- 12. Bögre L., Okrész L., Henriques R., and Anthony R. G. (2003) Growth signalling pathways in Arabidopsis and the AGC protein kinases. Trends Plant Sci. 8, 424–431 [DOI] [PubMed] [Google Scholar]
- 13. Harper S. M., Neil L. C., and Gardner K. H. (2003) Structural basis of a phototropin light switch. Science 301, 1541–1544 [DOI] [PubMed] [Google Scholar]
- 14. Nakasako M., Iwata T., Matsuoka D., and Tokutomi S. (2004) Light-induced structural changes of LOV domain-containing polypeptides from Arabidopsis phototropin 1 and 2 studied by small-angle x-ray scattering. Biochemistry 43, 14881–14890 [DOI] [PubMed] [Google Scholar]
- 15. Nakasako M., Zikihara K., Matsuoka D., Katsura H., and Tokutomi S. (2008) Structural basis of the LOV1 dimerization of Arabidopsis phototropins 1 and 2. J. Mol. Biol. 381, 718–733 [DOI] [PubMed] [Google Scholar]
- 16. Katsura H., Zikihara K., Okajima K., Yoshihara S., and Tokutomi S. (2009) Oligomeric structure of LOV domains in Arabidopsis phototropin. FEBS Lett. 583, 526–530 [DOI] [PubMed] [Google Scholar]
- 17. Halavaty A. S., and Moffat K. (2013) Coiled-coil dimerization of the LOV2 domain of the blue-light photoreceptor phototropin 1 from Arabidopsis thaliana. Acta Crystallogr. Sect. F Struct. Biol. Cryst. Commun. 69, 1316–1321 [DOI] [PMC free article] [PubMed] [Google Scholar]
- 18. Christie J. M., Swartz T. E., Bogomolni R. A., and Briggs W. R. (2002) Phototropin LOV domains exhibit distinct roles in regulating photoreceptor function. Plant J. 32, 205–219 [DOI] [PubMed] [Google Scholar]
- 19. Christie J. M., Yang H., Richter G. L., Sullivan S., Thomson C. E., Lin J., Titapiwatanakun B., Ennis M., Kaiserli E., Lee O. R., Adamec J., Peer W. A., and Murphy A. S. (2011) phot1 inhibition of ABCB19 primes lateral auxin fluxes in the shoot apex required for phototropism. PLoS Biol. 9, e1001076. [DOI] [PMC free article] [PubMed] [Google Scholar]
- 20. Demarsy E., Schepens I., Okajima K., Hersch M., Bergmann S., Christie J., Shimazaki K., Tokutomi S., and Fankhauser C. (2012) Phytochrome kinase substrate 4 is phosphorylated by the phototropin 1 photoreceptor. EMBO J. 31, 3457–3467 [DOI] [PMC free article] [PubMed] [Google Scholar]
- 21. Takemiya A., Sugiyama N., Fujimoto H., Tsutsumi T., Yamauchi S., Hiyama A., Tada Y., Christie J. M., and Shimazaki K. (2013) Phosphorylation of BLUS1 kinase by phototropins is a primary step in stomatal opening. Nat. Commun. 4, 2094. [DOI] [PubMed] [Google Scholar]
- 22. Salomon M., Christie J. M., Knieb E., Lempert U., and Briggs W. R. (2000) Photochemical and mutational analysis of the FMN-binding domains of the plant blue light receptor, phototropin. Biochemistry 39, 9401–9410 [DOI] [PubMed] [Google Scholar]
- 23. Swartz T. E., Corchnoy S. B., Christie J. M., Lewis J. W., Szundi I., Briggs W. R., and Bogomolni R. A. (2001) The photocycle of a flavin-binding domain of the blue light photoreceptor phototropin. J. Biol. Chem. 276, 36493–36500 [DOI] [PubMed] [Google Scholar]
- 24. Kasahara M., Swartz T. E., Olney M. A., Onodera A., Mochizuki N., Fukuzawa H., Asamizu E., Tabata S., Kanegae H., Takano M., Christie J. M., Nagatani A., and Briggs W. R. (2002) Photochemical properties of the flavin mononucleotide-binding domains of the phototropins from Arabidopsis, rice, and Chlamydomonas reinhardtii. Plant Physiol. 129, 762–773 [DOI] [PMC free article] [PubMed] [Google Scholar]
- 25. Iwata T., Nozaki D., Tokutomi S., Kagawa T., Wada M., and Kandori H. (2003) Light-induced structural changes in the LOV2 domain of Adiantum phytochrome3 studied by low-temperature FTIR and UV-visible spectroscopy. Biochemistry 42, 8183–8191 [DOI] [PubMed] [Google Scholar]
- 26. Harper S. M., Christie J. M., and Gardner K. H. (2004) Disruption of the LOV-Jα helix interaction activates phototropin kinase activity. Biochemistry 43, 16184–16192 [DOI] [PubMed] [Google Scholar]
- 27. Nakasone Y., Eitoku T., Matsuoka D., Tokutomi S., and Terazima M. (2007) Dynamics of conformational changes of Arabidopsis phototropin 1 LOV2 with the linker domain. J. Mol. Biol. 367, 432–442 [DOI] [PubMed] [Google Scholar]
- 28. Okajima K., Matsuoka D., and Tokutomi S. (2011) LOV2-linker-kinase phosphorylates LOV1-containing N-terminal polypeptide substrate via photoreaction of LOV2 in Arabidopsis phototropin1. FEBS Lett. 585, 3391–3395 [DOI] [PubMed] [Google Scholar]
- 29. Okajima K., Kashojiya S., and Tokutomi S. (2012) Photosensitivity of kinase activation by blue light involves the lifetime of a cysteinyl-flavin adduct intermediate, S390, in the photoreaction cycle of the LOV2 domain in phototropin, a plant blue light receptor. J. Biol. Chem. 287, 40972–40981 [DOI] [PMC free article] [PubMed] [Google Scholar]
- 30. Takayama Y., Nakasako M., Okajima K., Iwata A., Kashojiya S., Matsui Y., and Tokutomi S. (2011) Light-induced movement of the LOV2 domain in an Asp720Asn mutant LOV2-kinase fragment of Arabidopsis phototropin 2. Biochemistry 50, 1174–1183 [DOI] [PubMed] [Google Scholar]
- 31. Okajima K., Aihara Y., Takayama Y., Nakajima M., Kashojiya S., Hikima T., Oroguchi T., Kobayashi A., Sekiguchi Y., Yamamoto M., Suzuki T., Nagatani A., Nakasako M., and Tokutomi S. (2014) Light-induced conformational changes of LOV1 (light oxygen voltage-sensing domain 1) and LOV2 relative to the kinase domain and regulation of kinase activity in Chlamydomonas phototropin. J. Biol. Chem. 289, 413–422 [DOI] [PMC free article] [PubMed] [Google Scholar]
- 32. Okajima K. (2016) Molecular mechanism of phototropin light signaling. J. Plant Res. 129, 149–157 [DOI] [PubMed] [Google Scholar]
- 33. Aihara Y., Yamamoto T., Okajima K., Yamamoto K., Suzuki T., Tokutomi S., Tanaka K., and Nagatani A. (2012) Mutations in N-terminal flanking region of blue light-sensing light-oxygen and voltage 2 (LOV2) domain disrupt its repressive activity on kinase domain in the Chlamydomonas phototropin. J. Biol. Chem. 287, 9901–9909 [DOI] [PMC free article] [PubMed] [Google Scholar]
- 34. Kashojiya S., Okajima K., Shimada T., and Tokutomi S. (2015) Essential role of the A′α/Aβ gap in the N-terminal upstream of LOV2 for the blue light signaling from LOV2 to kinase in Arabidopsis photototropin1, a plant blue light receptor. PLoS One 10, e0124284. [DOI] [PMC free article] [PubMed] [Google Scholar]
- 35. Kashojiya S., Yoshihara S., Okajima K., and Tokutomi S. (2016) The linker between LOV2-Jα and STK plays an essential role in the kinase activation by blue light in Arabidopsis phototropin1, a plant blue light receptor. FEBS Lett. 590, 139–147 [DOI] [PubMed] [Google Scholar]
- 36. Hanks S. K., and Hunter T. (1995) Protein kinases 6. The eukaryotic protein kinase superfamily: kinase (catalytic) domain structure and classification. FASEB J. 9, 576–596 [PubMed] [Google Scholar]
- 37. Inoue S., Kinoshita T., Matsumoto M., Nakayama K. I., Doi M., and Shimazaki K. (2008) Blue light-induced autophosphorylation of phototropin is a primary step for signaling. Proc. Natl. Acad. Sci. U.S.A. 105, 5626–5631 [DOI] [PMC free article] [PubMed] [Google Scholar]
- 38. Guinier A., and Fournet G. (1955) Small-angle Scattering of X-rays, John Wiley & Sons, New York [Google Scholar]
- 39. Svergun D. I. (1992) Determination of the regularization parameter in indirect-transform methods using perceptual criteria. J. Appl. Crystallogr. 25, 495–503 [Google Scholar]
- 40. Svergun D. I., Petoukhov M. V., and Koch M. H. (2001) Determination of domain structure of proteins from x-ray solution scattering. Biophys. J. 80, 2946–2953 [DOI] [PMC free article] [PubMed] [Google Scholar]
- 41. DeLano W. L. (2012) The PyMOL Molecular Graphics System, version 1.5.0.1, Schrödinger, LLC, New York [Google Scholar]