

Abstract
2-Hydroxyglutarate (2-HG) is an important epigenetic regulator, with potential roles in cancer and stem cell biology. The d-(R)-enantiomer (d-2-HG) is an oncometabolite generated from α-ketoglutarate (α-KG) by mutant isocitrate dehydrogenase, whereas l-(S)-2-HG is generated by lactate dehydrogenase and malate dehydrogenase in response to hypoxia. Because acidic pH is a common feature of hypoxia, as well as tumor and stem cell microenvironments, we hypothesized that pH may regulate cellular 2-HG levels. Herein we report that cytosolic acidification under normoxia moderately elevated 2-HG in cells, and boosting endogenous substrate α-KG levels further stimulated this elevation. Studies with isolated lactate dehydrogenase-1 and malate dehydrogenase-2 revealed that generation of 2-HG by both enzymes was stimulated severalfold at acidic pH, relative to normal physiologic pH. In addition, acidic pH was found to inhibit the activity of the mitochondrial l-2-HG removal enzyme l-2-HG dehydrogenase and to stimulate the reverse reaction of isocitrate dehydrogenase (carboxylation of α-KG to isocitrate). Furthermore, because acidic pH is known to stabilize hypoxia-inducible factor (HIF) and 2-HG is a known inhibitor of HIF prolyl hydroxylases, we hypothesized that 2-HG may be required for acid-induced HIF stabilization. Accordingly, cells stably overexpressing l-2-HG dehydrogenase exhibited a blunted HIF response to acid. Together, these results suggest that acidosis is an important and previously overlooked regulator of 2-HG accumulation and other oncometabolic events, with implications for HIF signaling.
Keywords: acidosis, cancer, epigenetics, hypoxia, metabolism, 2-hydroxyglutarate
Introduction
The field of cancer biology has long been rapt by the notion of a cancer-specific metabolic phenotype, perhaps most famously embodied in the “Warburg effect,” wherein glycolytic metabolism predominates in cancer cells despite O2 availability and largely intact mitochondrial respiratory function (1). A prominent feature of the cancer metabolic phenotype (reviewed in Ref. 2) is an elevated level of the small metabolic acid 2-hydroxyglutarate (2-HG),2 derived from the TCA cycle intermediate α-ketoglutarate (α-KG) (3). The d-(R)-enantiomer of 2-HG (d-2-HG) was shown to be generated by mutant forms of isocitrate dehydrogenase (ICDH) that are associated with a variety of cancers including aggressive gliomas (4). In addition, more recently the l-(S)-enantiomer (l-2-HG) was shown to be generated under hypoxic conditions by lactate dehydrogenase (LDH) and malate dehydrogenase (MDH) (5, 6). We have also reported elevated d/l-2-HG levels in the heart following ischemic preconditioning (7).
In addition to synthesis, 2-HG levels are regulated by a pair of dehydrogenases that convert 2-HG back to α-KG (i.e. l-2-HGDH and d-2-HGDH). Mutations in these enzymes manifest as the hydroxyglutaric acidurias, devastating inherited metabolic diseases with symptoms including epilepsy and cerebellar ataxia (8–11). However, the importance of these dehydrogenases in regulating 2-HG levels in other settings is not clear.
The downstream signaling roles of d-2-HG in cancer biology and of l-2-HG in hypoxia or stem cell biology are thought to be mediated by epigenetic effects (12–14), because of competitive inhibition of the α-KG-dependent dioxygenase superfamily of enzymes. This includes the JmjC domain-containing histone demethylases, the TET 5-methylcytosine hydroxylases, the EGLN prolyl-hydroxylases that regulate hypoxia inducible factor (HIF), and the AlkB homolog family of DNA/RNA demethylases (15–18). As such, 2-HG is a potentially important link between metabolism and epigenetic signaling.
A common feature of hypoxia, as well as the tumor and stem cell microenvironments, is metabolic acidosis. However, the role of pH in regulating 2-HG formation and disposal has not been considered. We tested the hypothesis that acidic pH is a regulator of 2-HG metabolism at the cellular, mitochondrial, and isolated enzyme levels. Our results indicate that acidic pH can independently drive elevated 2-HG levels, and we propose that pH regulation of 2-HG may have important implications for 2-HG signaling in hypoxia and other settings.
Results and Discussion
We investigated the role of pH as an independent variable in the regulation of 2-HG levels in HEK293 cells, using an ammonium plus 5-(N-ethyl-N-isopropyl) amiloride (EIPA) pH clamp system (19). This system was capable of depressing and maintaining intracellular pH to 6.8 within 2 h (Fig. 1, A–C). This magnitude of pH depression (∼0.5 units) is similar to that previously reported upon exposure of cells to hypoxia/anoxia (20–22). As such, the pH-dependent signaling effects measured herein can be considered to represent those that may be expected to occur in hypoxic tissues.
FIGURE 1.
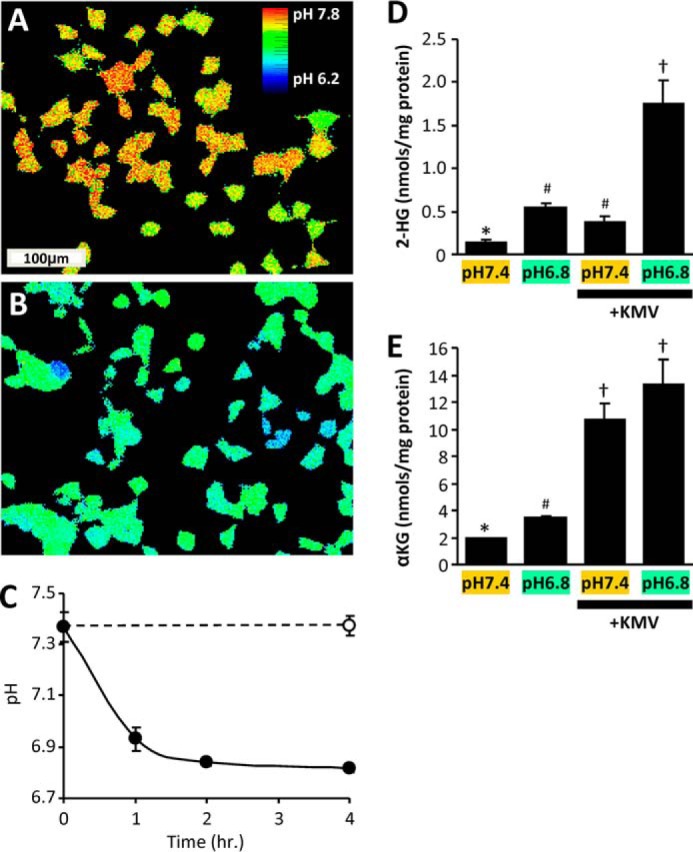
Acidic pH drives 2-HG production in cells. HEK293 cells were maintained at pH 7.4 or incubated under conditions to acidify the cytosol (see “Experimental Procedures”). A and B, pseudocolored 490-nm/440-nm dual excitation ratiometric images of BCECF fluorescence, showing intracellular pH for cells maintained at pH 7.4 (A) or pH 6.5 with EIPA (B). C, quantitative time course of cellular acidification. The data are the means ± S.D., n = 3. D, cellular 2-HG levels measured by LC-MS/MS following incubation at different cellular pH levels in the absence or presence of the α-KGDH inhibitor KMV. E, cellular α-KG levels measured by LC-MS/MS following incubation at different cellular pH levels in the absence or presence of KMV. The data are the means ± S.E., n = 6. The different symbols above the bars (*, #, and †) indicate statistically significant differences (two-way ANOVA and Student's t test) between groups, i.e. bars with the same symbol are not different.
Although this degree of acidification drove a 4-fold elevation in 2-HG1 levels (Fig. 1D, left two bars), this was somewhat lower than the >8-fold elevation reported in the same cell type in response to hypoxia (5, 6). Because 2-HG generation also depends on the availability of substrate α-KG, which is elevated in hypoxia (6), we hypothesized that α-KG may be limiting in acidic pH alone. As such, we found that inhibiting the TCA cycle enzyme α-KGDH with ketomethyvalerate (KMV) boosted cellular α-KG levels by ∼5-fold regardless of pH (Fig. 1E). Furthermore, whereas KMV alone drove a small increase in 2-HG levels at pH 7.4 (Fig. 1D), the combination of KMV plus acidic pH yielded an overall 13-fold increase in 2-HG levels. Together, these data indicate that reproducing the acidic pH and elevated α-KG levels seen in hypoxia is sufficient to increase 2-HG in cells. Acidosis may therefore be an important variable that drives 2-HG elevation in hypoxia.
Operating on the premise that the 2-HG observed in cells was the l-isomer,3 we next investigated the mechanism of acid-induced 2-HG elevation, by examining the effects of pH on the known enzymes that generate and remove this metabolite, namely LDH, MDH, ICDH, and 2-HGDH. The purity of commercial isolated LDH-1, MDH-2, and NADP+-dependent ICDH was verified by gel electrophoresis, with ICDH found to be somewhat impure (Fig. 2A). A spectrophotometric assay for the consumption of NADH by LDH in the presence of α-KG (Fig. 3A, inset) was performed across a range of pH values spanning 6.6–7.8 (i.e. encompassing the pH values studied in intact cells) and revealed that NADH consumption was ∼2.5-fold faster at pH 6.8 than at pH 7.4 (Fig. 3A). In agreement with the cell data (Fig. 1D), the rate was also [α-KG]-dependent, being faster at 10 mm than at 1 mm α-KG. The spectrophotometric data were confirmed by LC-MS/MS measurement of 2-HG generation (Fig. 3B), with approximate molar equivalents of 2-HG produced across the pH range 6.6–7.8 (Fig. 2B, r2 = 0.97).
FIGURE 2.

Enzyme purity and assay validation. A, SDS-PAGE analysis of commercially obtained LDH (Sigma; L3916), MDH (Sigma; M2634), and ICDH (Sigma; I2002). Following electrophoresis on 12.5% SDS-PAGE, gels were transferred to nitrocellulose membranes and stained with Ponceau S. Numbers to the left of the images show molecular mass markers (in kDa). The data are shown for two separate batches of material (two lanes). The arrows to the right of the images show expected position of band, for published molecular mass of the protein. B, comparison of NADH spectrophotometric assay versus 2-HG LC-MS/MS assay for the 2-HG generating activity of LDH (i.e. data from Fig. 3, A and B). The reaction is shown in the inset, with red/blue parameters matching appropriate axes on the graph. The data are means ± S.E. The dotted line shows linear regression curve fit with correlation coefficient shown alongside inset. C, comparison of NADH spectrophotometric assay versus 2-HG LC-MS/MS assay, for the 2-HG generating activity of MDH (i.e. data from Fig. 3, D and E). The reaction is shown in the inset, with red/blue parameters matching appropriate axes on the graph. The data are means ± S.E. The dotted line shows linear regression curve fit with correlation coefficient shown alongside the inset. D, comparison of formazan spectrophotometric assay versus α-KG LC-MS/MS assay, for the l-2-HG consuming activity of l-2-HGDH (i.e. data from Fig. 6, A and B). The reaction is shown in the inset, with red/blue parameters matching appropriate axes on the graph. The data are means ± S.E., with N for each measure corresponding to the parent data sets in Figs. 2 and 3 of the main manuscript. The dotted line shows linear regression curve fit with correlation coefficient shown alongside the inset.
FIGURE 3.

pH dependence of 2-HG generation by lactic or malic dehydrogenases. The 2-HG synthetic activity of isolated LDH was assayed spectrophotometrically as NADH consumption (A) or by direct LC-MS/MS assay of 2-HG formation (B). The insets in each panel show reaction schemes, with the measured parameter (y axis of graph) highlighted in red. A, NADH consumption at various pH values, for LDH in the presence of 1 mm (white circles) or 10 mm (black circles) α-KG. B, 2-HG production at various pH values, for LDH in the presence of 1 mm α-KG. C, native pyruvate to lactate converting activity of LDH at various pH values, assayed spectrophotometrically as NADH consumption. Similar experiments were also performed with isolated MDH. D, NADH consumption at various pH values, for MDH in the presence of 1 mm (white symbols) or 10 mm (black symbols) α-KG. E, 2-HG production at various pH values, for MDH in the presence of 10 mm α-KG. (Note that with MDH, the high concentration of α-KG was necessary because of the low sensitivity of LC-MS/MS-based 2-HG assay). F, native MDH activity (oxaloacetate to malate) at various pH values, assayed spectrophotometrically as NADH consumption. (Note that MDH activity was measured in the reverse direction, i.e. oxaloacetate to malate, because of thermodynamic constraints). All data are means ± S.E., n > 3. *, p < 0.05 (two-way ANOVA followed by Student's t test) compared with the corresponding value at pH 7.4. Where error bars appear absent, they are sufficiently small as to be wholly contained within the data symbols.
The native activity of LDH (i.e. conversion of pyruvate to lactate) was unaffected by pH (Fig. 3C); unsurprising for an enzyme that typically drives metabolic acidosis. Fractionally, the 2-HG generating capacity of LDH was at least 4 orders of magnitude lower than its native activity (Fig. 3, compare A and C), indicating that acidic pH unmasks a latent 2-HG generating activity in LDH without impacting its native activity. This observation also suggests that the generation of 2-HG is not a quantitatively important metabolic sink for NADH.
As a control, the effect of hypoxia on the ability of isolated LDH to generate 2-HG at pH 7.4 was also studied. Hypoxia was verified by measuring the spectrum of oxy- versus deoxy- hemoglobin in the cuvette (Fig. 4A). In contrast to the situation seen in cells (5, 6), no effect of pO2 on 2-HG generation by isolated LDH was seen (Fig. 4, B and C). These data suggest that hypoxic stimulation of 2-HG generation by LDH is not a property of the isolated enzyme, but rather it requires the intact hypoxic cell environment, likely including acidosis.
FIGURE 4.
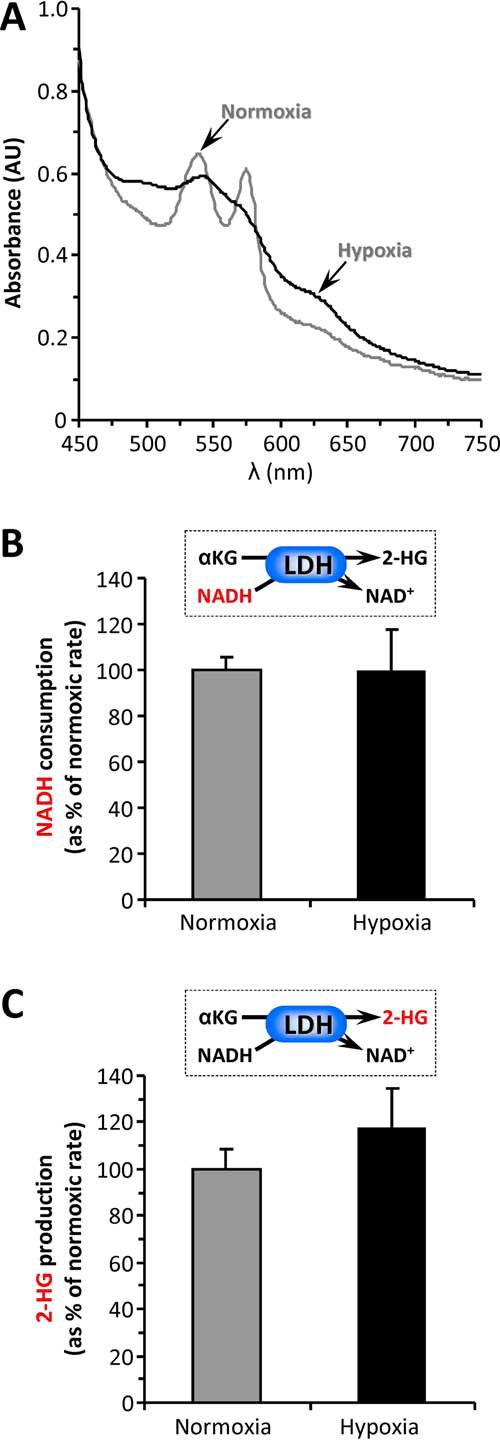
Effect of hypoxia on 2-HG generation by LDH. Isolated LDH was incubated in an open flow spectrophotometer cell, as detailed under “Experimental Procedures.” A parallel incubation contained 100 μm hemoglobin to confirm deoxygenation of the sample. A, absorbance spectra of purified Hb under normoxic (gray line) or hypoxic (black line) conditions, with the latter comprising a 1 h of argon purge. B, NADH consumption by LDH under normoxic or hypoxic conditions. The data are expressed normalized to the normoxia values and are means ± S.E. C, 2-HG generation by LDH under normoxic or hypoxic conditions. The samples were removed from the same incubations as B and rapidly deproteinized for LC-MS/MS analysis of 2-HG levels. The data are expressed normalized to the normoxia values and are means ± S.E.
Similar to LDH, the generation of 2-HG by MDH was also found to be higher at pH 6.8 than at pH 7.4 (Fig. 3, D and E). As seen with LDH, spectrophotometric and LC-MS/MS data for MDH correlated well (Fig. 2C, r2 = 0.98), with approximate molar equivalents of 2-HG produced across the pH range 6.6–7.8. Notably, unlike LDH (Fig. 3C) the native activity of MDH was itself pH-sensitive, being inhibited ∼30% at pH 6.8 versus pH 7.4 (Fig. 3F). At first glance, this result might suggest an acid-induced activity switch, away from native and toward 2-HG generation. However, it should again be noted that the 2-HG generating activity of MDH was at least 3 orders of magnitude lower than its native activity. Although 2-HG generation has been termed a “metabolic error” and the 2-HG dehydrogenases referred to as metabolite repair enzymes (11), our data suggest that the 2-HG synthetic capacity of MDH unmasked by acidic pH is fractionally small and does not represent a major diversion of carbon away from the TCA cycle.
Comparing LDH and MDH, at the pH range seen in cells (6.8 versus 7.4), and at the same α-KG level (10 mm), the relative acid-induced stimulation of 2-HG generation was slightly larger for LDH (2-fold) versus MDH (1.3-fold). In addition, the pH response of LDH appeared to initiate at slightly more neutral pH, whereas the MDH response was flatter until more acidic pH values were attained. These data, plus the >3-fold greater specific activity for 2-HG generation by LDH versus MDH, suggest that LDH may be a quantitatively more important source of 2-HG in response to acid.
The ability of native (non-mutant) ICDH to convert α-KG to 2-HG in a pH-sensitive manner was also tested. Although ICDH in the presence of α-KG indeed consumed NADPH in a manner that was accelerated at acidic pH (Fig. 5A), no 2-HG generation was seen (Fig. 5B). Instead, ICDH was observed to carboxylate α-KG to isocitrate, and this reaction was stimulated at acidic pH (Fig. 5C). This is somewhat expected because the reaction uses protons as a substrate (Fig. 5C, inset). Such reversal of ICDH activity was previously shown to be triggered under hypoxic conditions (23) and is an important pathway for diversion of carbon from anaplerotic glutamine toward lipid synthesis (via ATP citrate lyase) in cancer cells. Thus, although native ICDH does not appear to be a source for acid-triggered 2-HG generation, these data suggest that acidic pH may regulate numerous oncometabolic pathways, including reductive α-KG carboxylation.
FIGURE 5.

pH dependence of isocitrate dehydrogenase activity. The ability of commercial native ICDH (Fig. 2A) to catalyze the generation of 2-HG from α-KG was monitored spectrophotometrically as NADPH consumption (A) or by direct LC-MS/MS assay of 2-HG formation (B). The insets to each panel show reaction schemes, with the measured parameter (y axis of graph) highlighted in red. A, NADPH consumption at various pH values, for ICDH in the presence of 10 mm α-KG. B, 2-HG production at various pH values for ICDH in the presence of 10 mm α-KG. Although NADPH was consumed, 2-HG was not generated. C, reverse activity of ICDH to generate isocitrate from α-KG, monitored by LC-MS/MS assay of isocitrate formation (see inset for reaction scheme). The data are means ± S.E. n = 7–8. *, p < 0.05 (two-way ANOVA followed by Student's t test) compared with corresponding value at pH 7.4.
Because cellular 2-HG levels are also regulated by specific dehydrogenases, we next tested the effects of pH on mitochondrial l-2-HGDH activity, using both a formazan-linked colorimetric assay (10) and LC-MS/MS to quantify α-KG generation from the substrate l-2-HG. Both assays correlated well (Fig. 2D, r2 = 0.98) and showed that l-2-HGDH activity was inhibited by acidic pH (Fig. 6). Together with the data in Fig. 3, this result indicates that acidic pH both promotes the formation of l-2-HG and inhibits its removal, suggesting a coordinated metabolic response to elevate l-2-HG under acidic conditions. Based on the data in Figs. 1, 3, and 6, we conclude that pH is an important determinant of cellular 2-HG levels and that acidosis may play a key role in the l-2-HG elevation observed in hypoxia (5, 6).
FIGURE 6.
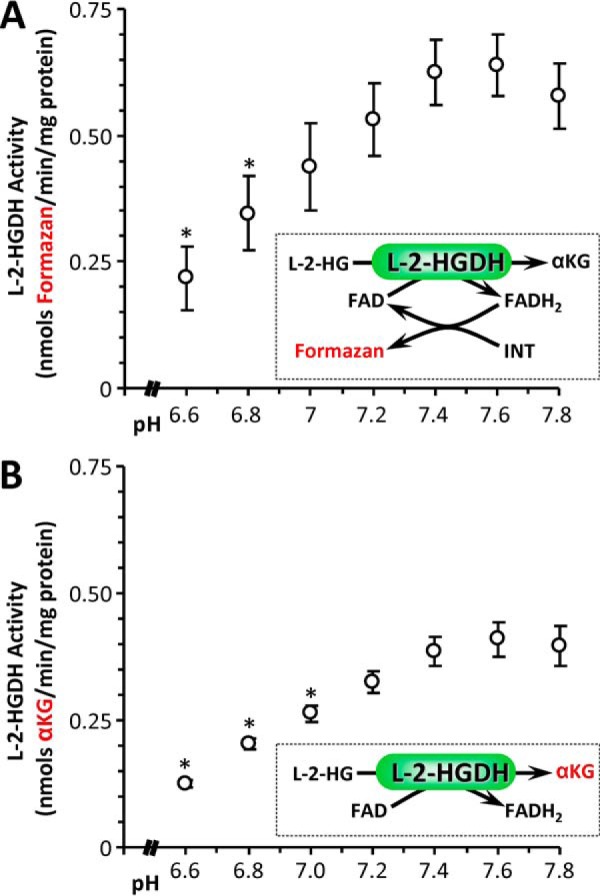
pH dependence of l-2-HG dehydrogenase (l-2-HGDH). The l-2-HGDH activity of isolated permeabilized mouse heart mitochondria was measured spectrophotometrically using either an iodonitrotetrazolium (INT) to formazan coupled assay (A) or by direct LC-MS/MS assay of α-KG formation (B). A, formazan production at various pH values for mitochondria supplied with 500 μm l-2-HG. B, α-KG production at various pH values for mitochondria supplied with 500 μm l-2-HG. The data are means ± S.E., n = 4. *, p < 0.05 (two-way ANOVA followed by Student's t test) compared with corresponding value at pH 7.4.
Biochemically, the reaction catalyzed by LDH and MDH during generation of 2-HG is the same as the native reactions of these enzymes, namely the NADH-dependent conversion of an α-keto acid to its corresponding α-hydroxy acid (Fig. 7). The only difference between substrates is the corresponding R group, and our current findings suggest that the mechanism of acid-induced 2-HG generation by LDH and MDH may involve changes in access to the active site, permitting entry of a larger R group. Such a model leads to a simple prediction: if LDH under acidic conditions can accommodate the R group of α-KG ((CH2)2–COOH), it should also be able to accommodate oxaloacetate (OAA). Fig. 7 (B and C) shows that this prediction is correct, with LDH able to convert OAA to malate (i.e. to perform the MDH reaction) in an acid-sensitive manner. A crystal structure for LDH in the presence of the inhibitor oxamate (R group = NH2, Protein Data Bank cod 1I0Z) shows the region of the protein that may accommodate the R group occupied by 2 molecules of water, with no acid-sensitive residues such as histidine nearby (24). As such, the mechanism by which acidic pH may allow larger substrates into the active site of LDH remains to be elucidated. In addition, the ability of LDH (or MDH) to accept even larger substrates such as α-ketobutyrate is unknown but could be worthy of investigation because elevated α-hydroxybutyrate has been shown to be a component of the metabolic signature of mitochondrial dysfunction across multiple organisms (25, 26). In general, the potential for acidic pH to remodel metabolite profiles by promoting α-keto to α-hydroxy acid conversion remains largely unexplored.
FIGURE 7.
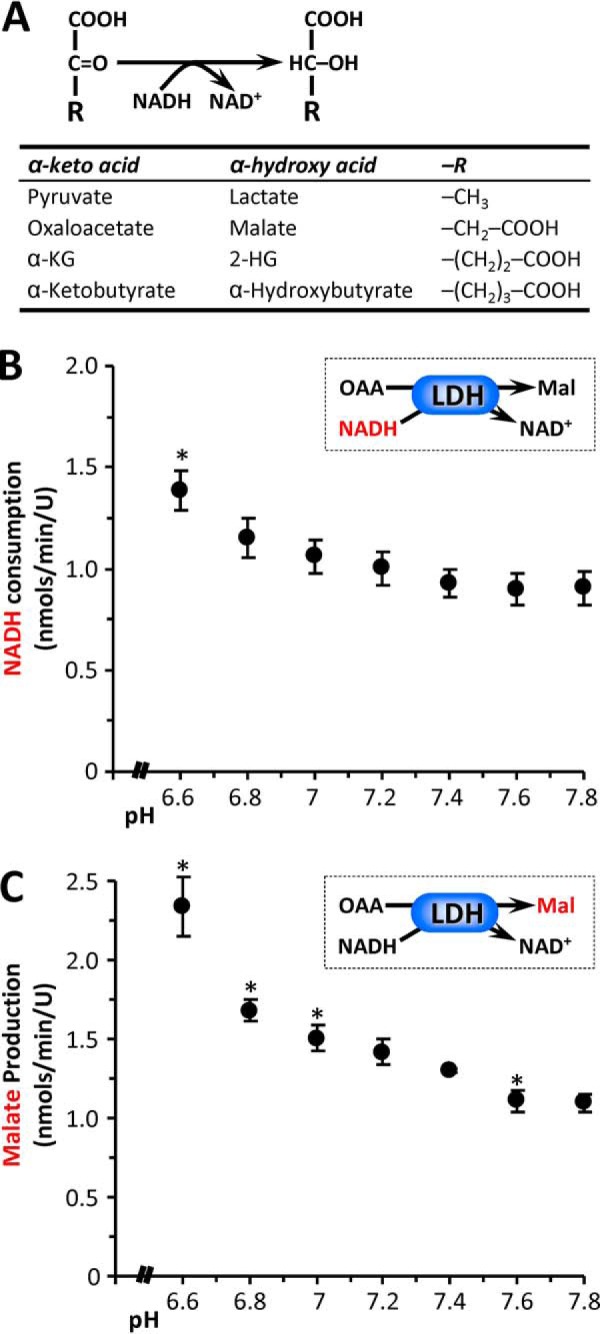
Acid-induced substrate promiscuity in α-keto acid dehydrogenases. A, generalized reaction scheme for α-keto acid dehydrogenases, with the table showing specific examples and the corresponding R group for each substrate/product pair. B, the ability of LDH to catalyze the native back reaction of MDH (i.e. OAA to malate) was measured at various pH values, assayed spectrophotometrically as NADH consumption. C, generation of malate in this system was also assayed by LC-MS/MS. The data are means ± S.E., n = 4. *, p < 0.05 (two-way ANOVA followed by Student's t test) compared with corresponding value at pH 7.4.
Downstream signaling by 2-HG is thought to be mediated by the inhibition of α-KG-dependent dioxygenases, such as the EGLN prolyl-hydroxylases that regulate HIF (15). It is known that acidic pH alone can activate HIF-1α (27), and therefore we hypothesized that 2-HG may play a role in acid-induced HIF activation. To test this, a cell line with stable transgenic overexpression of l-2-HGDH was generated (Fig. 8). The l-2-HGDH-Tg cells (clone #2) exhibited 12-fold greater l-2-HGDH activity compared with mock transfected controls (Fig. 8B). Furthermore, exposure of cells to acidosis plus KMV as in Fig. 1 resulted in elevated 2-HG in control cells with a blunted response in l-2-HGDH-Tg cells (Fig. 8C). Measurement of HIF levels by Western blot (Fig. 9) revealed that HIF stabilization in response to acid plus KMV was significantly blunted in l-2-HGDH-Tg cells (third and fourth lane). In contrast, HIF induction by hypoxia was similar between both control and l-2-HGDH-Tg cells, indicating that canonical HIF signaling was intact. These data indicate that 2-HG generation is required for acid-induced HIF stabilization.
FIGURE 8.

Characterization of l-2-HGDH transgenic cells. HEK293 cells were transfected with mock (mCherry alone) or V5:l-2-HGDH plus mCherry containing vectors, and stable clones were selected as described under “Experimental Procedures.” A, monitoring of successful transfection by Western blotting for V5 and mCherry. Clone 2 exhibited the highest levels of transfection. The bottom panel shows Ponceau S stained membrane indicating equal protein loading. B, l-2-HGDH enzymatic activity was measured by the formazan assay as described under “Experimental Procedures” (see also Fig. 3). The graph shows calculated rates, with inset showing raw spectrophotometric traces. In agreement with A, clone 2 showed the highest l-2-HGDH activity. C, quantitation of 2-HG levels in mock or l-2-HGDH transgenic cells, in response to acid plus KMV exposure as in Fig. 1. All data in this figure are n = 1, representing merely rationale for choice of clone 2 for subsequent cell signaling experiments. Ctrl, control.
FIGURE 9.
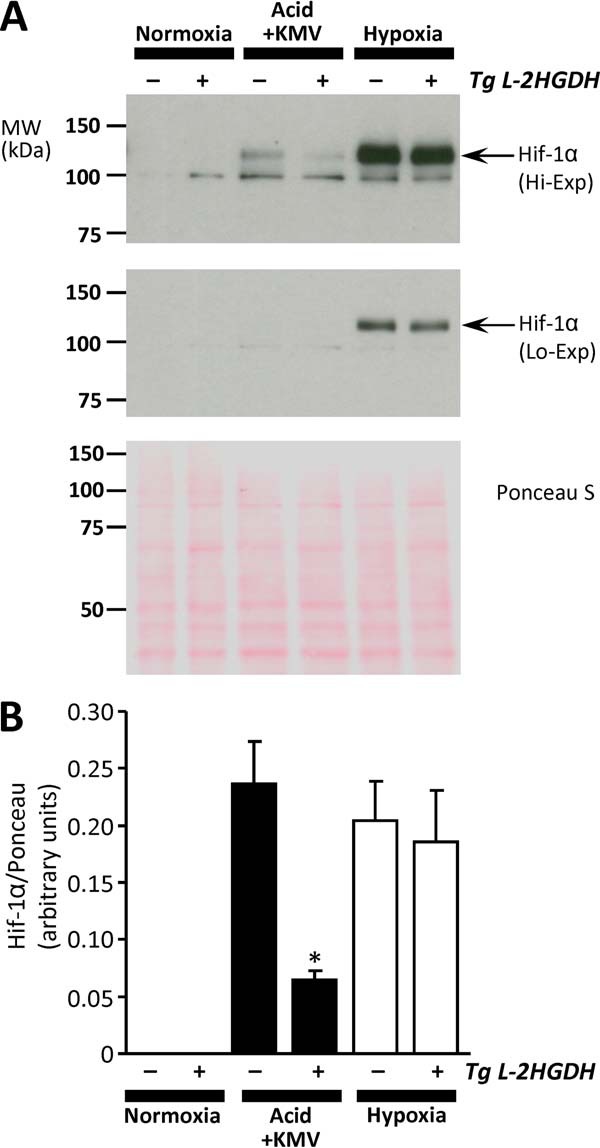
Requirement of 2-HG for acid-induced HIF induction. Mock and l-2-HGDH transfected cells (see Fig. 8) were exposed to acid plus KMV as in Fig. 1, or to hypoxia, followed by Western blotting for HIF-1α. A, representative HIF-1α Western blots at high exposure (upper panel) or low exposure (center panel), with corresponding Ponceau S stained membrane to indicate protein loading (lower panel). Arrows indicate position of HIF-1α at expected molecular mass. B, quantitative densitometry from four independent experiments of the type shown in A. For normoxia and acid plus KMV conditions, high exposure blots were used. However, because of saturation of the HIF signal, low exposure blots were used for the hypoxia condition. The data are means ± S.E., n = 4. *, p < 0.05 (paired Student's t test) between mock and l-2-HGDH-Tg cells under the same condition.
Although the current data suggest that pH is an important regulator of 2-HG signaling, the relative importance of the pH → 2-HG axis in cancer or stem cell biology remains to be determined. Although acidic pH is often associated with the high glycolytic metabolism of cancer cells, the regulation of pH in cancer is complex, with extracellular pH (pHex) tending more toward acidity than intracellular pH (pHin) (28, 29). Furthermore, although it has been suggested that exposure to acidic pHex may play a role in promoting “stem-ness” (30), there has been much recent controversy regarding the effects of acid exposure on stem cell phenotype (31). Thus, whereas it could be speculated that a simple elevation in 2-HG levels can transmit a pH signal to the epigenetic machinery and bring about a cancer or stem cell phenotype, the situation is likely to be far more complex in vivo. As the data in Fig. 1 suggest, the availability of substrate α-KG is also a major determinant of 2-HG generation, and the fact that α-KG is also a substrate for the dioxygenase signaling enzymes that 2-HG inhibits suggests that the α-KG/2-HG ratio is likely to be an important determinant of 2-HG signaling outcomes.
Finally, the current findings may also hold therapeutic implications for the hydroxyglutaric acidurias. Lactic acidosis has been reported in some 2-HG aciduric patients (32), and it could be speculated that acidotic episodes may trigger 2-HG accumulation. As such, the careful management of pH to avoid acidosis, for example by treatment with dichloroacetate (33), may be an overlooked therapeutic approach in these patients.
Experimental Procedures
All reagents including isolated enzymes were purchased from Sigma unless otherwise stated. Male C57BL/6J mice were bred in-house from stocks obtained from Jax Labs (Bar Harbor, ME) and were maintained in a thermoneutral environment on a 12-h light/dark cycle with food and water available ad libitum. All experiments were in compliance with the National Institutes of Health Guide for the Care and Use of Laboratory Animals and were approved by a local ethics committee (University Committee on Animal Resources protocol no. 2007-087). Enzyme activities were assayed in 25 mm potassium phosphate buffer at 37 °C, adjusted to specific pH values as indicated in the figures. Conversion of α-KG to l-2-HG (mediated by LDH, MDH, or ICDH) was monitored as the oxidation of NADH (0.1 mm) spectrophotometrically at 340 nm. For hypoxia experiments on isolated enzymes, an “open flow” apparatus was used in which the spectrophotometer cuvette was fitted with a lid and stirring apparatus, allowing purging of the headspace with gas mixtures defined by mass flow controllers (34). Gas mixtures were humidified to prevent sample evaporation and successful achievement of anoxia after 1 h of purging with argon was verified by the spectrum of oxy/deoxy-hemoglobin (Hb, 100 μm) in a matching open flow neighboring cuvette. Oxy-Hb was freshly prepared by dithionite reduction followed by gel filtration and incubation under 100% O2 and white light.
The disappearance and formation of l-2-HG, α-KG, citrate/isocitrate, and other metabolites was determined by LC-MS/MS analysis of the cuvette reactions. Metabolites were extracted in 80% methanol and then analyzed using reverse phase chromatography with an ion-paring reagent in a Shimadzu HPLC coupled to a Thermo Quantum triple-quadrupole mass spectrometer (7). The data were analyzed using MzRock machine learning tool kit, which automates analysis of targeted metabolites data based on chromatographic retention time, whole molecule mass, collision energy, and resulting fragment mass. Metabolite concentrations were determined from standard curves constructed using known concentrations (7).
l-2-HG dehydrogenase activity was assayed (10) in frozen mitochondria isolated from male C57BL6/J mouse hearts as previously described (35). Mitochondria were snap-frozen in liquid N2 and stored at −80 °C. Mitochondrial protein (0.3 mg/ml) was incubated in 20 mm HEPES buffer supplemented with 0.85 mm MgCl2, 0.05% (v/v) Triton X-100, and 1.5 mm iodonitrotetrazolium (ACROS organics). After 5 min, 500 μm l-2-HG was added, and the reaction was monitored spectrophotometrically at 500 nm (ϵ = 19300 cm−1 m−1) for 60 min. At the end of each run, de novo α-KG formation was confirmed by LC-MS/MS.
HEK-293 cells (ATCC) were maintained in DMEM (Life Technologies) with 25 mm d-glucose, 4 mm l-glutamine, 0.1 mm sodium pyruvate, 10% heat-inactivated FBS (Life Technologies), and 100 μg/ml penicillin-streptomycin (Life Technologies), in 5% CO2 at 37 °C. For passaging, cells at 75–90% confluence were released by 3 min of incubation with 0.25% trypsin-EDTA (Life Technologies), followed by collection in 5 volumes of medium and pelleting at 500 × g for 3 min. The cells were resuspended in 3 volumes of medium and enumerated on a hemocytometer after trypan blue staining. The cells were seeded at 106 cells/75-cm2 flask, 24 h prior to experiments. The cells were incubated in bicarbonate-free DMEM with 4 mm l-glutamine, 0.1 mm pyruvate, 10 mm glucose, and 10 mm HEPES (adjusted to pH 7.4 or 6.5) at 37 °C. Intracellular acidification (19) was achieved by supplementing pH 6.5 medium for 15 min with 30 mm NH4Cl (ACROS organics) and 10 μm EIPA, followed by washing and reincubation in pH 6.5 medium with amiloride alone for the duration of the experiment (20 h). This protocol brought intracellular pH to 6.8 within 2 h. (Fig. 1C). Where appropriate, the α-KGDH inhibitor KMV was present at 20 mm. Intracellular pH was monitored by fluorescence microscopy using the ratiometric fluorescent pH indicator 2′,7′-bis-(2-carboxyethyl)-5–6-carboxyfluorescein-acetoxymethyl ester (Invitrogen) (36). The cells were loaded with 2 μg/ml 2′,7′-bis-(2-carboxyethyl)-5–6-carboxyfluorescein-acetoxymethyl ester and incubated for 30 min at 37 °C. The cells were then washed once, and fluorescence microscopy was performed using an Eclipse TE2000-S (Nikon, Avon, MA), and the data were analyzed using TILL Photonics Imaging System Software. For cellular metabolite analysis, a bolus of 80% (v/v) methanol at −80 °C was added after incubations, and the cells were serially extracted with the same, followed by analysis by LC-MS/MS, as for enzyme assays above.
To create a stable cell line expressing l-2-HGDH, the expression vector pTS4 was created by PCR cloning of the rat l-2-HGDH open reading frame into pcDNA3.1-V5HisC (Invitrogen) as a BstEII fragment. Rat cDNA was amplified using the primers 5′-ACA CGG TCA CCA TGT GGC CGA CCC TGC GCT ACG-3′ (forward) and 5′-ACA CGG TCA CCT AAC TTA AAC CTT TGC TGT GCT TCC TC-3′ (reverse). HEK293 cells were transfected with pTFS4 using Lipofectamine 3000 (Invitrogen). Stable clonal isolates were expanded in DMEM with 10% heat-inactivated FBS under 1 mg/ml G418 selective pressure for 10 days and thereafter maintained in medium containing 200 μg/ml G418. The presence of transgenic l-2-HGDH was monitored by enzymatic assay and by Western blotting for V5 and mCherry tags. pcDNA3.1mCherry was included with pTFS4 at 1:10 to visualize transfected cells and was transfected on its own to create a negative control (mock transfected) cell line.
For 2-HG signaling experiments, the cells were incubated in a hypoxic chamber (<0.1%) at 37 °C for 20 h. For Western blot monitoring of HIF, cell lysates were harvested under hypoxia in SDS-PAGE sample buffer containing MG132, and following SDS-PAGE, the proteins were quantified by Western blot. The antibodies employed were anti-V5 (Novex, Carlsbad CA), anti-mCherry (Abcam, Cambridge, MA), anti-Hif-1α (Novus Biologics, Littleton, CO), and anti-β-actin (Santa Cruz Biotechnology, Santa Cruz, CA). The blots were developed using HRP-linked secondary antibodies and enhanced chemiluminescence, with densitometry in ImageJ software.
All experiments were performed a minimum of three times. In purified enzyme studies (Figs. 3–6), N represents a single measurement, with multiple measurements made on each of multiple batches of enzyme (i.e. technical replicates, with the number of replicates overall exceeding the number of independent batches of enzyme/biological replicates). In all other figures, N refers to independent biological preparations. Statistical significance between groups was calculated using one-way or two-way ANOVA with post hoc Student's t testing.
Addendum
During revision of this manuscript, a report emerged on LDH as a source of high levels of 2-HG found in testis (37), including data showing this phenomenon to be pH-sensitive. The relative role of acid as a 2-HG stimulus in testis under physiologically relevant conditions is unclear. We consider this study complimentary to our current findings, which span multiple enzymes and cell systems, and overall these discoveries highlight the importance of pH as a driver of metabolic signaling.
Author Contributions
S. M. N. and X. S. performed experiments. P. S. B., S. M. N., K. N., J. M., and D. F. conceived the study. P. S. B., K. N., and J. M. provided funding and resources. S. M. N. prepared the figures. P. S. B. wrote the paper, with input and editing by K. N., J. M., and D. F.
This work was supported by National Institutes of Health Grants RO1 HL-071158 (to P. S. B.), R01 AI-081773 (to J. M.), and R01-HL127891 (to P. S. B. and K. W. N.). The authors declare that they have no conflicts of interest with the contents of this article. The content is solely the responsibility of the authors and does not necessarily represent the official views of the National Institutes of Health.
The complete set of original data used to generate Figs. 1–9 is available in spreadsheet form at the data sharing site FigShare.com: https://dx.doi.org/10.6084/m9.figshare.3496286.v1.
The methodology used herein was incapable of distinguishing between L and D 2-HG. However, because the D enantiomer is primarily found in cancers associated with ICDH mutation, whereas the l-enantiomer is primarily made by LDH and MDH under hypoxia, we assume that the bulk of 2-HG measured herein was the l-enantiomer.
- 2-HG
- 2-hydroxyglutarate
- α-KG
- α-ketoglutarate dehydrogenase
- ICDH
- isocitrate dehydrogenase
- LDH
- lactate dehydrogenase
- MDH
- malate dehydrogenase
- HIF
- hypoxia-inducible factor
- EIPA
- 5-(N-ethyl-N-isopropyl) amiloride
- KMV
- ketomethyvalerate
- OAA
- oxaloacetate
- Hb
- hemoglobin
- ANOVA
- analysis of variance
- EGLN
- egg-laying defective protein nine homolog.
References
- 1. Warburg O., Wind F., and Negelein E. (1927) The metabolism of tumors in the body. J. Gen. Physiol. 8, 519–530 [DOI] [PMC free article] [PubMed] [Google Scholar]
- 2. Pavlova N. N., and Thompson C. B. (2016) The emerging hallmarks of cancer metabolism. Cell Metab. 23, 27–47 [DOI] [PMC free article] [PubMed] [Google Scholar]
- 3. Ward P. S., Patel J., Wise D. R., Abdel-Wahab O., Bennett B. D., Coller H. A., Cross J. R., Fantin V. R., Hedvat C. V., Perl A. E., Rabinowitz J. D., Carroll M., Su S. M., Sharp K. A., Levine R. L., et al. (2010) The common feature of leukemia-associated IDH1 and IDH2 mutations is a neomorphic enzyme activity converting alpha-ketoglutarate to 2-hydroxyglutarate. Cancer Cell 17, 225–234 [DOI] [PMC free article] [PubMed] [Google Scholar]
- 4. Dang L., White D. W., Gross S., Bennett B. D., Bittinger M. A., Driggers E. M., Fantin V. R., Jang H. G., Jin S., Keenan M. C., Marks K. M., Prins R. M., Ward P. S., Yen K. E., Liau L. M., et al. (2010) Cancer-associated IDH1 mutations produce 2-hydroxyglutarate. Nature 465, 966. [DOI] [PMC free article] [PubMed] [Google Scholar]
- 5. Intlekofer A. M., Dematteo R. G., Venneti S., Finley L. W., Lu C., Judkins A. R., Rustenburg A. S., Grinaway P. B., Chodera J. D., Cross J. R., and Thompson C. B. (2015) Hypoxia induces production of l-2-hydroxyglutarate. Cell Metab. 22, 304–311 [DOI] [PMC free article] [PubMed] [Google Scholar]
- 6. Oldham W. M., Clish C. B., Yang Y., and Loscalzo J. (2015) Hypoxia-mediated increases in l-2-hydroxyglutarate coordinate the metabolic response to reductive stress. Cell Metab. 22, 291–303 [DOI] [PMC free article] [PubMed] [Google Scholar]
- 7. Nadtochiy S. M., Urciuoli W., Zhang J., Schafer X., Munger J., and Brookes P. S. (2015) Metabolomic profiling of the heart during acute ischemic preconditioning reveals a role for SIRT1 in rapid cardioprotective metabolic adaptation. J. Mol. Cell Cardiol. 88, 64–72 [DOI] [PMC free article] [PubMed] [Google Scholar]
- 8. Struys E. A. (2006) D-2-Hydroxyglutaric aciduria: unravelling the biochemical pathway and the genetic defect. J. Inherit. Metab. Dis. 29, 21–29 [DOI] [PubMed] [Google Scholar]
- 9. Van Schaftingen E., Rzem R., and Veiga-da-Cunha M. (2009) l-2-Hydroxyglutaric aciduria, a disorder of metabolite repair. J. Inherit. Metab. Dis. 32, 135–142 [DOI] [PubMed] [Google Scholar]
- 10. Rzem R., Veiga-da-Cunha M., Noël G., Goffette S., Nassogne M. C., Tabarki B., Schöller C., Marquardt T., Vikkula M., and Van Schaftingen E. (2004) A gene encoding a putative FAD-dependent L-2-hydroxyglutarate dehydrogenase is mutated in l-2-hydroxyglutaric aciduria. Proc. Natl. Acad. Sci. U.S.A. 101, 16849–16854 [DOI] [PMC free article] [PubMed] [Google Scholar]
- 11. Rzem R., Achouri Y., Marbaix E., Schakman O., Wiame E., Marie S., Gailly P., Vincent M. F., Veiga-da-Cunha M., and Van Schaftingen E. (2015) A mouse model of l-2-hydroxyglutaric aciduria, a disorder of metabolite repair. PLoS One 10, e0119540. [DOI] [PMC free article] [PubMed] [Google Scholar]
- 12. Venneti S., and Thompson C. B. (2013) Metabolic modulation of epigenetics in gliomas. Brain Pathol. 23, 217–221 [DOI] [PMC free article] [PubMed] [Google Scholar]
- 13. Jin Y., Elalaf H., Watanabe M., Tamaki S., Hineno S., Matsunaga K., Woltjen K., Kobayashi Y., Nagata S., Ikeya M., Kato T. Jr, Okamoto T., Matsuda S., and Toguchida J. (2015) Mutant IDH1 dysregulates the differentiation of mesenchymal stem cells in association with gene-specific histone modifications to cartilage- and bone-related genes. PLoS One 10, e0131998. [DOI] [PMC free article] [PubMed] [Google Scholar]
- 14. Su X., Wellen K. E., and Rabinowitz J. D. (2016) Metabolic control of methylation and acetylation. Curr. Opin. Chem. Biol. 30, 52–60 [DOI] [PMC free article] [PubMed] [Google Scholar]
- 15. Koivunen P., Lee S., Duncan C. G., Lopez G., Lu G., Ramkissoon S., Losman J. A., Joensuu P., Bergmann U., Gross S., Travins J., Weiss S., Looper R., Ligon K. L., Verhaak R. G., Yan H., and Kaelin W. G. Jr. (2012) Transformation by the (R)-enantiomer of 2-hydroxyglutarate linked to EGLN activation. Nature 483, 484–488 [DOI] [PMC free article] [PubMed] [Google Scholar]
- 16. Xu W., Yang H., Liu Y., Yang Y., Wang P., Kim S. H., Ito S., Yang C., Wang P., Xiao M. T., Liu L. X., Jiang W. Q., Liu J., Zhang J. Y., Wang B., Frye S., Zhang Y., Xu Y. H., Lei Q. Y., Guan K. L., Zhao S. M., and Xiong Y. (2011) Oncometabolite 2-hydroxyglutarate is a competitive inhibitor of α-ketoglutarate-dependent dioxygenases. Cancer Cell 19, 17–30 [DOI] [PMC free article] [PubMed] [Google Scholar]
- 17. Losman J. A., and Kaelin W. G. (2013), Jr. What a difference a hydroxyl makes: mutant IDH, (R)-2-hydroxyglutarate, and cancer. Genes Dev. 27, 836–852 [DOI] [PMC free article] [PubMed] [Google Scholar]
- 18. Wang P., Wu J., Ma S., Zhang L., Yao J., Hoadley K. A., Wilkerson M. D., Perou C. M., Guan K. L., Ye D., and Xiong Y. (2015) Oncometabolite d-2-hydroxyglutarate inhibits ALKBH DNA repair enzymes and sensitizes IDH mutant cells to alkylating agents. Cell Rep. 13, 2353–2361 [DOI] [PMC free article] [PubMed] [Google Scholar]
- 19. Sandvig K., Olsnes S., Petersen O. W., and van Deurs B. (1987) Acidification of the cytosol inhibits endocytosis from coated pits. J. Cell Biol. 105, 679–689 [DOI] [PMC free article] [PubMed] [Google Scholar]
- 20. Gasbarrini A., Borle A. B., Farghali H., Bender C., Francavilla A., and Van Thiel D. (1992) Effect of anoxia on intracellular ATP, Na+i, Ca2+i, Mg2+i, and cytotoxicity in rat hepatocytes. J. Biol. Chem. 267, 6654–6663 [PubMed] [Google Scholar]
- 21. Ladilov Y. V., Balser C., and Piper H. M. (1998) Protection of rat cardiomyocytes against simulated ischemia and reoxygenation by treatment with protein kinase C activator. Circ. Res. 82, 451–457 [DOI] [PubMed] [Google Scholar]
- 22. Rose U. M., Abrahamse S. L., Jansen J. W., Bindels R. J., and van Os C. H. (1995) Cellular acidification occurs during anoxia in cultured, but not in freshly isolated, rabbit proximal tubular cells. Pflugers Arch. 429, 722–728 [DOI] [PubMed] [Google Scholar]
- 23. Wise D. R., Ward P. S., Shay J. E., Cross J. R., Gruber J. J., Sachdeva U. M., Platt J. M., DeMatteo R. G., Simon M. C., and Thompson C. B. (2011) Hypoxia promotes isocitrate dehydrogenase-dependent carboxylation of alpha-ketoglutarate to citrate to support cell growth and viability. Proc. Natl. Acad. Sci. U.S.A. 108, 19611–19616 [DOI] [PMC free article] [PubMed] [Google Scholar]
- 24. Read J. A., Winter V. J., Eszes C. M., Sessions R. B., and Brady R. L. (2001) Structural basis for altered activity of M- and H-isozyme forms of human lactate dehydrogenase. Proteins 43, 175–185 [DOI] [PubMed] [Google Scholar]
- 25. Butler J. A., Mishur R. J., Bhaskaran S., and Rea S. L. (2013) A metabolic signature for long life in the Caenorhabditis elegans Mit mutants. Aging Cell 12, 130–138 [DOI] [PMC free article] [PubMed] [Google Scholar]
- 26. Thompson Legault J., Strittmatter L., Tardif J., Sharma R., Tremblay-Vaillancourt V., Aubut C., Boucher G., Clish C. B., Cyr D., Daneault C., Waters P. J., LSFC Consortium, Vachon L., Morin C., Laprise C., Rioux J. D., Mootha V. K., and Des Rosiers C. (2015) A metabolic signature of mitochondrial dysfunction revealed through a monogenic form of Leigh syndrome. Cell Rep. 13, 981–989 [DOI] [PMC free article] [PubMed] [Google Scholar]
- 27. Mekhail K., Gunaratnam L., Bonicalzi M. E., and Lee S. (2004) HIF activation by pH-dependent nucleolar sequestration of VHL. Nat. Cell Biol. 6, 642–647 [DOI] [PubMed] [Google Scholar]
- 28. Chiche J., Brahimi-Horn M. C., and Pouysségur J. (2010) Tumour hypoxia induces a metabolic shift causing acidosis: a common feature in cancer. J. Cell Mol. Med. 14, 771–794 [DOI] [PMC free article] [PubMed] [Google Scholar]
- 29. Webb B. A., Chimenti M., Jacobson M. P., and Barber D. L. (2011) Dysregulated pH: a perfect storm for cancer progression. Nat. Rev. Cancer 11, 671–677 [DOI] [PubMed] [Google Scholar]
- 30. Hjelmeland A. B., Wu Q., Heddleston J. M., Choudhary G. S., MacSwords J., Lathia J. D., McLendon R., Lindner D., Sloan A., and Rich J. N. (2011) Acidic stress promotes a glioma stem cell phenotype. Cell Death Differ. 18, 829–840 [DOI] [PMC free article] [PubMed] [Google Scholar]
- 31. De Los Angeles A., Ferrari F., Fujiwara Y., Mathieu R., Lee S., Lee S., Tu H. C., Ross S., Chou S., Nguyen M., Wu Z., Theunissen T. W., Powell B. E., Imsoonthornruksa S., Chen J., Borkent M., Krupalnik V., Lujan E., Wernig M., Hanna J. H., Hochedlinger K., Pei D., Jaenisch R., Deng H., Orkin S. H., Park P. J., and Daley G. Q. (2015) Failure to replicate the STAP cell phenomenon. Nature 525, E6–E9 [DOI] [PubMed] [Google Scholar]
- 32. Barth P. G., Wanders R. J., Scholte H. R., Abeling N., Jakobs C., Schutgens R. B., and Vreken P. (1998) l-2-Hydroxyglutaric aciduria and lactic acidosis. J. Inherit. Metab Dis. 21, 251–254 [DOI] [PubMed] [Google Scholar]
- 33. Stacpoole P. W., Nagaraja N. V., and Hutson A. D. (2003) Efficacy of dichloroacetate as a lactate-lowering drug. J. Clin. Pharmacol. 43, 683–691 [PubMed] [Google Scholar]
- 34. Hoffman D. L., and Brookes P. S. (2009) Oxygen sensitivity of mitochondrial reactive oxygen species generation depends on metabolic conditions. J. Biol. Chem. 284, 16236–16245 [DOI] [PMC free article] [PubMed] [Google Scholar]
- 35. Nadtochiy S. M., Madukwe J., Hagen F., and Brookes P. S. (2014) Mitochondrially targeted nitro-linoleate: a new tool for the study of cardioprotection. Br. J. Pharmacol. 171, 2091–2098 [DOI] [PMC free article] [PubMed] [Google Scholar]
- 36. Thomas J. A., Buchsbaum R. N., Zimniak A., and Racker E. (1979) Intracellular pH measurements in Ehrlich ascites tumor cells utilizing spectroscopic probes generated in situ. Biochemistry 18, 2210–2218 [DOI] [PubMed] [Google Scholar]
- 37. Teng X., Emmett M. J., Lazar M. A., Goldberg E., and Rabinowitz J. D. (2016) Lactate dehydrogenase C produces S-2-hydroxyglutarate in mouse testis. ACS Chem. Biol. 10.1021/acschembio.6b00290 [DOI] [PMC free article] [PubMed] [Google Scholar]