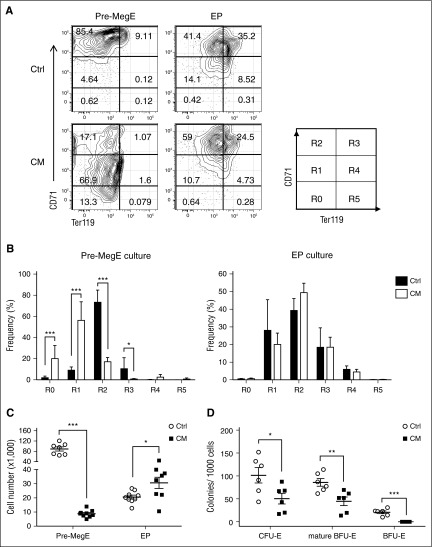
Figure 3.
CM-expressing Pre-Meg/Es are impaired in erythroid differentiation potential in vitro. (A) Representative FACS plots and gating strategy (R0-R5) of CD71 and Ter119 expression of sorted CM or control Pre-Meg/E and EPs after 3-day erythroid differentiation culture. (B) The frequency of differentiating erythroid cells at various maturation stage (R0-R5) from Pre-Meg/E (left) or EPs (right) at day 3. Bars and lines represent mean + SD (n = 7-9) from 3 independent experiments. (C) Total cell number output from CM or control Pre-Meg/E and EPs after 3 days of differentiation culture. Results include 3 independent experiments performed in triplicate. Mean ± SEM (×1000) is shown. (D) Number of CFU-E, mature BFU-E, and BFU-E colonies from CM or control Pre-Meg/Es (per 1000 cells). Results include 3 independent experiments performed in duplicate. CFU-E and mature BFU-E colonies were counted at day 3, and BFU-E colonies were counted at day 10. Mean ± SEM is shown. *P < .05; **P < .01; ***P < .001.

