

Abstract
Though sociologists have examined how mass incarceration affects stratification, remarkably little is known about how it shapes educational disparities. Analyzing the Fragile Families Study and its rich paternal incarceration data, I ask whether black and white children with fathers who have been incarcerated are less prepared for school both cognitively and non-cognitively as a result, and whether racial and gendered disparities in incarceration help explain the persistence of similar gaps in educational outcomes and trajectories. Using a variety of estimation strategies, I show that experiencing paternal incarceration by age five is associated with lower non-cognitive school readiness. While the main effect of incarceration does not vary by race, boys with incarcerated fathers have substantially worse non-cognitive skills at school entry, impacting the likelihood of special education placement at age nine. Mass incarceration facilitates the intergenerational transmission of male behavioral disadvantage, and because of the higher exposure of black children to incarceration, it also plays a role in explaining the persistently low achievement of black boys.
Keywords: educational inequality, mass incarceration, school readiness, racial disparities, gender differences, special education
INTRODUCTION
Over the past forty years, large gaps in academic achievement and educational attainment between black and white children have persisted (Jencks and Phillips 1998; Magnuson and Waldfogel 2008), presenting one of the most enduring problems facing a U.S. society committed to equal opportunity and racial justice. Alongside these racial disparities is a gender gap which is especially pronounced for boys from disadvantaged backgrounds, such that they have substantially lower achievement trajectories throughout their educational careers than similar female peers (Entwisle, Alexander and Olson 2007; Buchmann, DiPrete, and McDaniel 2008). In this paper, I argue that the racial and gendered dynamics that influence schooling trajectories for U.S. children from disadvantaged backgrounds are driven, in part, by the race- and gender-specific effects of mass incarceration on early educational outcomes.
Incarceration has strong, negative, and lasting effects on myriad aspects of imprisoned and formerly imprisoned individuals’ lives (Wakefield and Uggen 2010; Wildeman and Muller 2012), as well as on the wellbeing of families and communities (Clear 2007; Comfort 2008). Less well understood is the impact of mass incarceration for child development. More than half of state and federal inmates report having a minor child, leaving an estimated 1.5 million children with currently imprisoned parents (Glaze and Maruschak 2008). When paroled and recently released parents are included, this number rises to 3.2 million nationwide, the largest proportions of whom are black and have incarcerated fathers (Mumola 2002; Parke and Clarke-Stewart 2003; Glaze and Maruschak 2008).
This paper brings scholarship on educational inequalities into dialogue with the growing body of research on the consequences of imprisonment for families. Drawing on longitudinal birth-cohort data from the Fragile Families and Child Wellbeing Study, I first ask whether paternal incarceration diminishes young children’s school readiness. I then consider whether such effects vary by the race and gender of the child. Lastly, I test the extent to which school readiness mediates the relationship between paternal incarceration and special education placement, a particularly important early schooling decision that not only has been linked to later achievement and attainment trajectories (Morgan et al. 2010; Shifrer et al. 2013), but also reflects disproportionalities by race and gender (Hibel et al. 2010; Zhang et al. 2014).
To disentangle the unique impact of paternal incarceration from the effects of preexisting disadvantage, I condition on a wide range of covariates that address the process of social selection, use propensity score matching techniques to identify an appropriate comparison group for children with incarcerated fathers in order to estimate a “treatment effect for the treated,” and conduct two types of sensitivity analysis to assess the extent to which observed effects of paternal incarceration on school readiness are robust to omitted variable bias. I find that paternal incarceration negatively affects children’s school readiness and that these effects are strongest for boys and disproportionally experienced by black children, creating lasting consequences for their educational trajectories. These results enhance our understanding of how inequality is transmitted from parent to child and the role mass incarceration plays in the persistence of racial and gendered disparities in educational outcomes.
PATERNAL INCARCERATION AND CHILDREN’S EDUCATIONAL DEVELOPMENT
Paternal incarceration can affect children emotionally, developmentally, and socially through: trauma experienced as a result of parent-child separation (e.g. Braman 2004; Comfort 2008); the isolation and shame brought on by the stigma associated with having a family member incarcerated (e.g. Goffman 1963; Murray and Farrington 2008); and the social, psychological, and economic strain imposed upon children of the incarcerated due to financial hardship and family disruption or dissolution (e.g. Hagan and Dinovitzer 1999; Swisher and Waller 2008). Moreover, Geller et al. (2012) find that these harmful effects can occur regardless of the resident status of fathers at the time of their incarceration, suggesting that a change in a father’s presence is a significant but not necessary condition for children to be harmed by paternal incarceration.
Experiencing any of the social, emotional, or material consequences of paternal incarceration during early childhood can be quite detrimental, as this is a particularly sensitive developmental stage during which the foundation for a child’s cognitive and non-cognitive capacities is laid (Blair 2002; Knudsen et al. 2006). School readiness reflects this age-appropriate skill development and refers to the constellation of skills needed in early childhood for a successful transition to formal schooling. Cognitive indicators (i.e., early numeracy, shape knowledge, language abilities, and literacy skills) represent a child’s ability to process information, apply knowledge, and engage in reasoning and problem solving. The non-cognitive dimension encompasses the attention, social, and behavioral components of learning and includes a child’s ability to concentrate, stay on task, cooperate, interact with peers, and exercise emotional self-regulation.
Young children’s early attention skills, socio-emotional behaviors, and cognitive knowledge are linked to later educational achievement, educational attainment, and labor market outcomes (McLeod and Kaiser 2004; Knudsen 2006; Duncan et al. 2007). Therefore, crucial differences in a child’s preparedness for school—his or her “school readiness”—set the course for the growth of educational disparities, and understanding the sources of these disparities early on is paramount to illuminating later-life divergent trajectories by race and gender.
Previous Research and the Potential for Heterogeneity in Effects
There is currently limited work exploring how mass paternal incarceration shapes racial and gendered disparities in early educational outcomes. Correspondingly, little attention has been paid to the potential implications this has for intergenerational transmissions of educational inequality. Existing research has tended to focus on adolescent outcomes (Foster and Hagan 2007; Foster and Hagan 2009; Hagan and Foster 2012), demonstrating that paternal incarceration decreases adolescent educational achievement and attainment, which results in the youth’s social exclusion as an adult. However, this research provides little aid in understanding how paternal incarceration affects educational outcomes for younger children at the onset of formal schooling. And while recent studies of younger children do emphasize impacts across individual dimensions of behavior (e.g., externalizing or internalizing) (Wildeman 2010; Craigie 2011; Wakefield and Wildeman 2011; Geller et al. 2012) or cognitive measures (Geller et al. 2012) that tap into aspects of school readiness, they leave largely unexplored any implications for education and how the effects translate into differences in early schooling trajectories for black and white boys and girls.
Given the well documented racial and gendered disparities in both incarceration rates and schooling outcomes, a focused look at whether paternal incarceration has heterogeneous effects by race and gender is needed. Wildeman’s (2010) work on physical aggression has shown impacts to be concentrated among young boys. However, Foster and Hagan (2007) find that the incarceration of a resident father places adolescent daughters at a unique risk of later-life homelessness and abuse. All in all, there are many possible reasons sons and daughters may respond differently when a father is incarcerated.
Moreover, effects of paternal incarceration may also be experienced differently depending on the race of the child. The double jeopardy hypothesis (Dowd and Bengtson 1978) suggests that being associated with multiple marginalized statuses (in this case, the dual stigma of race and criminality; Goffman 1963) could result in stronger or more negative outcomes for black children with incarcerated fathers. Alternatively, the resilience hypothesis suggests that forms of disruption or environmental shocks are less stressful when the experience is less unexpected and alternative support systems are in place (Mineka and Kihlstrom 1978). Because paternal incarceration is more common among recent cohorts of African American children, the effects of paternal incarceration could potentially be less negative at the individual level for black children compared to white, while still having lasting effects on racial inequality at a population level.
SELECTION INTO INCARCERATION
Complicating any work in this area is the fact that incarceration does not happen at random, and many of the same factors that predict incarceration also predict child school readiness. The incarcerated are disproportionally poor, African American, and poorly educated (Western and Beckett 1999). Thus, children of the incarcerated and formerly incarcerated are likely to suffer from forms of socio-structural disadvantage independent of their parent’s incarceration. Second, controlling for demographics, fathers who become incarcerated exhibit higher levels of antisocial and deviant behavior (e.g., domestic violence, impulsivity, and substance abuse) (Murray, Loeber and Pardini 2012), and these behaviors also have consequences for child outcomes. Because these differences likely impact child outcomes outside of the father’s incarceration, it is necessary for researchers to contend with the possibility that both types of preexisting differences account for much of the disadvantage these children experience.
In this paper, I attempt to address the ubiquitous problem of separating the causal effect of paternal incarceration from differential selection into incarceration by using the restricted Fragile Families Study data, which allows for the inclusion of measures that account for economic constraints, demographic and household characteristics, neighborhood context, and a number of paternal psycho-social and deviant behaviors (all measured prior to the father’s incarceration) that might drive the association between paternal incarceration and child schooling outcomes. Moreover, I employ quasi-experimental matching methods in the form of propensity score matching models that allow me to make appropriate school readiness comparisons between children with differing paternal incarceration experiences but with similar characteristics of preexisting disadvantage. Finally, I conduct two types of sensitivity analysis to assess the extent to which observed effects of paternal incarceration on school readiness are robust to omitted variable bias.
In the following sections I describe my data, outline the measures and methods used, and report the results. I hypothesize that paternal incarceration has a negative impact on child school readiness and later special education placement, with the strongest deleterious effects observed for black children and boys.
DATA, MEASURES, AND METHODS
Data
The Fragile Families and Child Wellbeing Study (FFS) is a longitudinal birth-cohort study that follows 4,898 focal children and their parents. In 20 large U.S. cities between the years of 1998 and 2000, marital and non-marital births were randomly sampled within hospitals that were stratified by labor market conditions and policy environments (for a complete description see Reichman et al. 2001). The FFS provides several benefits for directly studying the effects of a father’s incarceration on their child’s school readiness because it: follows both parents over time as their child grows; comprises a large and diverse sample of children with sufficient variation in paternal incarceration experiences to explore effects; and collects information on a variety of background, demographic, environmental, behavioral, health, and economic indicators to allow for a rich set of controls.
The data, which include interviews of both parents and in-home assessments of children and their home environments, are collected from mothers and fathers separately. This study attribute helps to validate the reliability of the child and parent measures, in addition to providing information (via maternal reports) about disadvantaged fathers otherwise unavailable given their frequent underrepresentation in surveys (Hernandez and Brandon 2002). The initial baseline wave of interviews was conducted for mothers in the hospital within 48 hours after the birth of the focal child and for fathers soon thereafter. Four follow-up waves of interviews of both mothers and fathers were conducted by phone approximately one, three, five, and nine years after the focal child’s birth. In-home assessments occurred at the three-, five-, and nine-year follow-up waves. The baseline response rate for the nationally representative sample of mothers is 86 percent, while for fathers it is slightly lower at 79 percent. Follow-up interview response rates for both parents across waves can be found in Appendix A of the supplementary materials.
Given my interest in the effects of paternal incarceration and of black-white racial disparities in both the criminal justice system and in educational outcomes, I exclude from my analytic sample Latino children (n=1,224), as well as any children who experience maternal incarceration (n=283).1 Additionally, any children with missing information on the school readiness outcome measures were dropped, providing final analytic samples of N=2,602 (for non-cognitive readiness) and N=1,709 (for cognitive readiness). Appendix B in the supplementary materials presents a descriptive snapshot of this analytical sample by paternal incarceration status. I preserve missing covariates by producing five multiply imputed datasets and averaging across them (Rubin 1987).
Measures
School Readiness
The two outcomes of interest—cognitive and non-cognitive school readiness—together comprise the behavioral, social, and cognitive dimensions of learning. To conceptually encompass the non-cognitive component of school readiness, a single index was created using 17 parent-reported items from the reduced Child Behavior Checklist (CBCL) (Achenbach and Rescorla 2000). The items were reported on at the five-year follow-up wave, when the focal child was approximately age five.2 The CBCL is one of the most widely used standardized measures in child psychology for evaluating maladaptive behavioral and emotional problems. The dimensions measured in the non-cognitive readiness scale include internalizing (anxiety, depression, social withdrawal), externalizing (aggression, disobedience), and attention (hyperactivity, concentration) behaviors. To compute non-cognitive readiness scores, responses to each of the 17 items (0=not true; 1=somewhat/sometimes true; 2=very true/often true) were summed, averaged, and then reversed scaled so that higher numbers would indicate higher non-cognitive school readiness. The Cronbach alpha for this composite measure is 0.835.
The second outcome of interest, cognitive readiness, is represented by the child’s standard score on the Peabody Picture Vocabulary Test-III (PPVT). The PPVT, which is often used as an indicator of cognitive knowledge for preschool-aged children, is an individually administered, norm-referenced assessment used in early-childhood screenings to evaluate Standard American English language development (Dunn and Dunn 1997). It measures receptive vocabulary—an individual’s listening comprehension of spoken words—which is distinct from expressive vocabulary or a measure of cognitive aptitude such as an IQ test. Thus, although the PPVT isn’t the ideal singular measure for representing a child’s broader cognitive ability or developmental potential, it is among one of the best-established indicators of childhood verbal intelligence and general scholastic aptitude (Tenenbaum et al. 2007). PPVT assessments were administered to the subset of focal children whose parents agreed to participate in the five-year “in-home” portion of survey/data collection. For ease of interpretation, the scores for both cognitive and non-cognitive readiness are standardized with coefficients reported in standard deviation units.
Special Education Placement
This secondary outcome of interest is a binary indictor representing primary caregiver reports of whether the focal child was receiving any special education or related services at their elementary school during the day. The responses were collected at the nine-year follow-up, when the focal children were on average nine years old and in third grade, with about 18 percent of the full study sample indicating parent-reported special education receipt.
Paternal Incarceration
The key explanatory variable used is based on a combination of maternal and paternal reports of the father’s current or previous incarceration status across the first four study waves. This measure combines reports of whether the father was “currently incarcerated” at the time of the interview and whether the father was “ever incarcerated” at any point prior to the interview wave. Mothers are asked, through a variety of interview questions, if their child’s father ever spent time in jail or prison, and fathers are asked if they have ever been imprisoned.3 If either the mother or father answers yes, then the father is indicated as “ever” incarcerated for that and subsequent waves. Many of the fathers in FFS experience incarceration. Figure 1 shows this percentage for children in the full FFS sample by year. At the first follow-up wave, when the focal child is one year old and paternal incarceration is first measured,4 approximately 30 percent of the fathers in the study have experienced incarceration at some point in their lives, and this increases to nearly 42 percent by year five—totaling over 2,000 dads.
Figure 1.

Prevalence of Paternal Incarceration in the Fragile Families Study over Waves (in percentages)
Notes: Full non-imputed study sample used, N=4898
Previous studies using FFS data have used various indicators of paternal incarceration, some without fully accounting for the temporal ordering of relevant covariates (e.g., Geller et al. 2009); others only measure short-term impacts across a few years (e.g., Wildeman 2010). I instead use a measure that improves upon these earlier operationalizations by parsing out children who experience paternal incarceration into two mutually exclusive groups. The first group of children’s fathers experienced incarceration before or by year one. Fathers in this group could have experienced incarceration at any point before the one-year follow-up interview. This group is the largest in the data as well as the most difficult to make causal claims about because incarceration potentially occurred before the measurement of important baseline covariates. Therefore, while impacts for this group are still important to understand, it is hard to differentiate the direction of influences, which renders any estimates of the effect of paternal incarceration on outcomes for children in this first group susceptible to bias.
Acknowledging this concern, I then created a second group of children whose fathers experienced first-time incarceration sometime between the one- and five-year follow-up interviews, and not earlier. This group excludes any father with previously indicated incarceration experience at year one. Fathers in the between year 1 and 5 group account for a smaller proportion of the incarcerated fathers, but they are more appropriate for estimating effects since their first-time incarceration occurred after the collection of baseline and year–one covariates. Finally, I use children with never incarcerated fathers by year five as the comparison group. Figure 2 shows what these three groups look like within the black-white subset of the FFS sample.
Figure 2.

Exposure to Paternal Incarceration in the Fragile Families Study by Year 5 by Race (in percentages)
Notes: Imputed black-white only Study sample used, n=3674.
Controls
Given the wealth of information in the restricted FFS data, the analyses control for a host of characteristics of mothers, fathers, and their children that likely to be associated with paternal incarceration and child school readiness. These include demographic and household characteristics, measures of economic wellbeing, an indicator for interview city, a number of census-tract characteristics, and measures of paternal psycho-social and deviant behaviors. Adjusting for this last set of paternal behavior measures diminishes concerns that a father’s behavior drives both his incarceration and impacts his child’s readiness for formal schooling. Estimates of the effect of paternal incarceration are only plausible if included controls adequately address both socio-structural and deviant behavior selection. This requires nuanced measures of both that precede incarceration. In order to maintain appropriate time ordering between the dependent, explanatory, and control variables, I only include controls that were measured prior to first paternal incarceration or are assumed fixed characteristics. A list of all variables, along with descriptive statistics by paternal incarceration status, is provided in Appendix B of the supplementary materials.
Methods
The bulk of my analyses rely on propensity score matching (PSM) (Rosenbaum and Rubin 1983) to estimate the relationship between paternal incarceration and child school readiness. Ordinary least squares (OLS) regression models are estimated to assess the overall association between paternal incarceration and behavioral and cognitive school readiness for the full sample of black and white children in the FFS (N=2,602 for non-cognitive readiness; N=1,709 for cognitive readiness). However, for the reasons discussed earlier, OLS regression is limited in its ability to extract causal inferences since for some children paternal incarceration occurred before baseline covariates were measured. Therefore, I use PSM to focus on the relationship between paternal incarceration and child school readiness for the second group of children, those whose fathers’ first-time incarceration occurred between years 1 and 5, and their comparison counterparts who by year five have no paternal incarceration experience (N=1,780 for non-cognitive readiness; N=1,119 for cognitive readiness).5
The large number of children in the OLS models who have paternal incarceration experiences occurring before or by year 1 are dropped from the PSM analyses. As Figure 2 demonstrated, this is a substantial proportion of both black (40 percent) and white (22 percent) children, and impacts of paternal incarceration on their school readiness are substantively important—especially when considering population-level impacts of mass paternal incarceration on children. However, their exclusion from the analytic sample for PSM purposes is purely to be able to provide as unbiased estimates of the effect of paternal incarceration as possible.
While propensity score matching is not a panacea for selection concerns, as it can only account for observed differences between treatment and control groups, it is a valuable technique when used in conjunction with a rich set of observed characteristics. The main purpose of the PSM model is to ensure that observed characteristics that would predict having an incarcerated father are balanced across those children who, in reality, do and do not have incarcerated fathers (Augurzky and Schmidt 2001). The PSM analyses estimate the average effect of having an incarcerated father on child school readiness by simulating “treatment” and “control” groups from the observational FFS data. This allows me to make appropriate school readiness comparisons by using a reference group of children who do not experience paternal incarceration but are similarly at risk based on the observed, theoretically relevant pre-treatment characteristics included in the matching model. Moreover, the technique allows for the systematic judgment of whether treatment and control groups are properly balanced on observables based on a balance test.6 Propensities are generated via a probit regression model predicting selection into paternal incarceration. I employ the kernel matching technique using a Gaussian kernel and a bandwidth of 0.08 to estimate the average treatment effect.7
RESULTS
As discussed in Figure 1, a large number of children in the FFS experience paternal incarceration by age five, yielding sufficient variation to examine its effects on child outcomes. Looking within the black-white sample, Figure 2 shows these percentages by race for children at year five. In these data, early life-course racial disparities are already present, with over 53 percent of black children experiencing some form of paternal incarceration. Said differently, by the time black children in this sample enter formal schooling, more have experienced paternal incarceration than have not. For whites, the percentage of children experiencing paternal incarceration by year five is around 30 percent. Exposure to paternal incarceration for both blacks and whites in the FFS sample is high. Using age-appropriate population-level cumulative risk estimates from Wildeman (2009) as a point of comparison, the prevalence of paternal incarceration in the FFS for black children of pre-school age is more than three times as large (53 percent versus 15 percent). However, the prevalence of paternal incarceration for white pre-school age children in the FFS is twenty times larger (30% v. 1.5%) than what is expected for similar age white children on average in the U.S. With regard to gender, boys and girls experience paternal incarceration nearly equally.
The two panels of Table 1 present unadjusted means and standard deviations for both school readiness measures in standardized units, weighted to be nationally representative. On average, black children are less school ready than whites on both measures; boys are less behaviorally ready than girls; and children in either of the groups that experience an incarcerated father by age five (before age one and between ages one and five) have lower cognitive and non-cognitive readiness scores compared to those who do not. Not accounting for controls, the racial and gender gaps in non-cognitive readiness are both one-fifth of a standard deviation (SD). For cognitive readiness, the racial gap is equivalent to a difference of more than one SD, while the gender gap in comparison is quite small. Moving to the second panel, girls (and white girls in particular) with never-incarcerated fathers have the highest non-cognitive readiness scores, while black boys, especially those who experience either form of paternal incarceration, are consistently lowest. Moreover, as shown in Appendix B of the supplementary materials, children experiencing paternal incarceration are more likely to suffer a whole host of other disadvantages.
Table 1.
Weighted Means and Standard Deviations for School Readiness Variables by Race, Gender, and Paternal Incarceration Status
| by Paternal Incarceration Status | by Race and Gender | |||||||||||
|---|---|---|---|---|---|---|---|---|---|---|---|---|
|
|
||||||||||||
| by Race | by Gender | Never | Before or By YR1 | Between YR1 & YR5 | White | Black | ||||||
|
|
|
|||||||||||
| Overall | White | Black | Male | Female | Male | Female | Male | Female | ||||
| Non-cognitive Readiness (NR) Standardized | 0.10 (0.97) | 0.19 (0.94) | −0.01 (0.99) | 0.01 (1.04) | 0.20 (0.88) | 0.20 (0.93) | −0.12 (0.99) | −0.13 (1.12) | 0.09 (1.03) | 0.32 (0.81) | −0.09 (1.03) | 0.10 (0.94) |
|
| ||||||||||||
| Cognitive Readiness (CR) Standardized | 0.29 (0.98) | 0.89 (0.75) | −0.13 (0.90) | 0.26 (1.02) | 0.33 (0.92) | 0.54 (0.92) | −0.03 (0.94) | −0.27 (0.91) | 0.84 (0.78) | 0.96 (0.71) | −0.20 (0.96) | −0.05 (0.82) |
|
| ||||||||||||
| NR | N=2602 | n=765 | n=1837 | n=1375 | n=1227 | n=1452 | n=822 | n=328 | n=413 | n=352 | n=962 | n=875 |
| CR | N= 1709 | n=424 | n=1285 | n=890 | n=819 | n=880 | n=590 | n=239 | n=226 | n=198 | n=664 | n=621 |
|
|
||||||||||||
| by Race and Gender and Paternal Incarceration Status
|
||||||||||||
|---|---|---|---|---|---|---|---|---|---|---|---|---|
| Father Never Incarcerated | Father Incarcerated
|
|||||||||||
| Before or By YR1 | Between YR1 and YR5 | |||||||||||
|
| ||||||||||||
| White | Black | White | Black | White | Black | |||||||
|
| ||||||||||||
| Male | Female | Male | Female | Male | Female | Male | Female | Male | Female | Male | Female | |
| Non-cognitive Readiness (NR) Standardized | 0.12 (1.00) | 0.49 (0.80) | 0.09 (0.99) | 0.21 (0.86) | −0.10 (1.30) | −0.13 (0.72) | −0.15 (0.96) | −0.10 (0.97) | −0.15 (0.88) | 0.33 (0.80) | −0.51 (1.19) | 0.19 (1.03) |
|
| ||||||||||||
| Cognitive Readiness (CR) Standardized | 0.93 (0.74) | 1.06 (0.64) | −0.01 (0.90) | 0.06 (0.84) | 0.54 (0.71) | 0.55 (0.91) | −0.29 (0.98) | −0.13 (0.80) | 0.23 (1.04) | 0.61 (0.51) | −0.56 (0.93) | −0.21 (0.75) |
|
| ||||||||||||
| NR | n=309 | n=257 | n=463 | n=423 | n=72 | n=65 | n=359 | n=326 | n=32 | n=30 | n=140 | n=126 |
| CR | n=158 | n=138 | n=301 | n=283 | n=47 | n=42 | n=257 | n=244 | n=21 | n=18 | n=106 | n=94 |
|
|
||||||||||||
Note: National weights and imputed black-white sample data used. YR1 and YR5 stand for Year 1 and Year 5 respectively. Standard deviations are in parentheses.
Effects of Paternal Incarceration on Child School Readiness
Propensity Score Matching Models
OLS regression models (not shown) suggest that paternal incarceration is negatively associated with the non-cognitive component of child school readiness for whites and boys, even after adjusting for a large set of observed baseline covariates. The following PSM models are not directly analogous but instead allow me to focus the analyses on the group of children with incarcerated fathers that has the potential to produce more causal estimates. Attention can also then be paid to the temporal ordering of relevant covariates, and I take further steps to ameliorate selection concerns by introducing into the matching algorithm additional characteristics of fathers predictive of incarceration measured at year one that were not included in OLS models. In these PSM models, analysis is restricted to the children whose father was incarcerated for the first time between year 1 and year 5 and their matched controls.
Table 2 presents PSM results for the effect of paternal incarceration on both components of child school readiness. Starting with Model 1a and the overall effect of paternal incarceration on non-cognitive readiness, the standardized point estimate of −0.143 indicates that after matching, children with fathers who experience first-time incarceration between the ages of one and five rank just over one-seventh of an SD lower in non-cognitive readiness compared to their matched controls, and this difference is statistically significant. In the education literature, effect sizes ranging between one-fourth and one-eighth are substantial, and these non-cognitive readiness results suggest that this difference of 0.143 is equivalent to a loss of almost two months of schooling.
Table 2.
Results from Propensity Score Matching Predicting both types of School Readiness at Age Five
| NON-COGNITIVE READINESSa | matched pairs | |||
|---|---|---|---|---|
|
| ||||
| Difference | N | treated | control | |
| Model 1a: Paternal Incarceration | −0.143* (0.070) | 1780 | 322 | 1445 |
| Model 2a: within Black Males | −0.223* (0.123) | 603 | 132 | 464 |
| Model 3a: within Black Females | 0.005 (0.119) | 549 | 118 | 420 |
| Model 4a: within White Males | −0.422* (0.231) | 341 | 30 | 253 |
| Model 5a: within White Females | 0.148 (0.244) | 287 | 23 | 189 |
| COGNITIVE READINESSb | matched pairs | |||
|---|---|---|---|---|
|
| ||||
| Difference | N | treated | control | |
| Model 1b: Paternal Incarceration | −0.100 (0.079) | 1119 | 229 | 877 |
| Model 2b: within Black Males | 0.022 (0.129) | 407 | 98 | 299 |
| Model 3b: within Black Females | −0.132 (0.142) | 377 | 92 | 282 |
| Model 4b: within White Males | −0.299 (0.382) | 179 | 15 | 155 |
| Model 5b: within White Females | −0.239 (0.297) | 156 | 14 | 138 |
Note: Kernel matching model estimates shown. See Appendix B in the supplementary materials for a complete list of variables used in models predicting the treatment. Analyses are unweighted and done on imputed data. Standard errors are in parentheses. Significance levels are the following: † p<0.1; * p<.05; ** p<.01; *** p<.001 (one-sided).
Matched pairs are average “on support” counts of treated and control cases. To help with model convergence, neither Models 4a or 5a include census tract characteristics in the matching algorithm.
Matched pairs are average “on support” counts of treated and control cases. To help with model convergence, neither Models 4b or 5b include city indicators and census tract characteristics in the matching algorithm.
Models 2a–5a show the effect of paternal incarceration on non-cognitive readiness within the four race-gender pairings in the data: black boys, white boys, black girls, and white girls. Looking at differences in effects within these race-gender pairings allows for a direct comparison of like with like, making additional race- or gender-motivated differences less of a concern. Results indicate both black boys (Model 2a) and white boys (Model 4a) who experience first-time paternal incarceration between ages one and five perform significantly worse on the non-cognitive readiness measure than matched boys who have never had an incarcerated father. In particular, black boys perform 0.223 SD units lower, and white boys 0.422 SD units lower. These significant differences in non-cognitive readiness have educational relevance, representing a two month loss of schooling for black boys with incarcerated fathers, and a four month loss for white boys. A test of the difference between these point estimates for black and white boys shows they are not statistically different from each other; however, it is less clear whether this indicates that paternal incarceration has a similarly negative effect on the non-cognitive readiness on both black and white boys, or that the current sample size of white boys experiencing paternal incarceration is too small to precisely determine this relationship. I find no within-race differences in non-cognitive readiness between treatment and control groups for black or white girls.
Results for cognitive readiness (Models 1b–5b) are less clear. Comparisons of overall treatment effects between non-cognitive readiness (Model 1a) and cognitive readiness (Model 1b) show similarities in size and direction, but the cognitive readiness measure does not reach statistical significance. Looking within the race-gender pairings (Models 2b–5b), treatment effects for black girls, white girls, and white boys are large and negative in direction; however, the inflated standard errors indicate that these estimates are imprecise, as there is not enough power to determine effects. Nonetheless, the non-effect of paternal incarceration on a child’s receptive vocabulary across both OLS and PSM models does indicate that the cognitive and non-cognitive components of school readiness should be distinguished; non-cognitive school readiness appears to be more subject to localized family conditions, while cognitive readiness appears to be mainly correlated with race, and highly sensitive to poverty, maternal education, and parental cognitive abilities. Therefore, while it is unclear whether children with incarcerated fathers are less cognitively prepared for school than their matched counterparts, paternal incarceration does produce significant deficiencies in pre-school boys’ socio-behavioral abilities. Simply put, boys with incarcerated fathers possess fewer of the non-cognitive skills needed to successfully navigate and adjust to the expectations and interactions present at school entry.
Sensitivity Analyses and Robustness Checks
In the absence of an experiment, it is fair to assume that unobservable characteristics inevitably play some role in determining which children experience paternal incarceration and which do not. To address this concern, I do two types of sensitivity analysis on the treatment effects found for boys’ non-cognitive readiness. The first is a falsification test that makes use of the recently released year nine FFS data. For this, I run an analysis (not shown) to see if future paternal incarceration experienced for the first time between year five and year nine would predict a child’s past non-cognitive readiness at year five, accounting for all covariates.8 I find that future paternal incarceration does not predict past non-cognitive readiness, providing additional evidence that the treatment effects estimated from the PSM models are measuring something unique to paternal incarceration.
Secondly, I use Rosenbaum bounds (Rosenbaum 2002; DiPrete and Gangl 2004) to check the sensitivity of the estimated treatment effects to omitted variable bias.9 This test assesses how strong a hypothetical unmeasured variable related to selection into paternal incarceration would need to be to undermine the results. These analyses provide support for the argument that paternal incarceration has a negative effect on boys’ non-cognitive school readiness. In comparison to observed measures in the dataset, an unobserved confounding variable would need to have an effect on predicting paternal incarceration that fell in magnitude between what having a father with only a high school diploma and having a father with drug and alcohol problems does to undermine the reported effects. Given the richness of the FFS data, it is difficult to identify a theoretically relevant variable not already included that has this suggested strength.
Mediation Models for Special Education
The earlier analyses demonstrated the deleterious impact of paternal incarceration on the non-cognitive readiness of five-year-old black and white boys. Given that differences found this early have the potential to grow over time and influence later schooling outcomes, it is worth considering whether consequences of paternal incarceration for school readiness at year five also present problems for boys’ educational outcomes after the start of schooling. One way to answer this question is to ask whether a portion of the negative effects we see for later schooling outcomes (Haskins 2013) is attributable to the negative effects on school readiness shown here. To address this question, I perform Sobel-Goodman mediation tests10 to analyze the contribution of paternal incarceration’s effect on boys’ non-cognitive school readiness to paternal incarceration’s total effect on parent-reported special education placement, measured at year nine, a later schooling outcome especially meaningful for boys (Hibel, Farkas and Morgan 2010), and black males in particular (Davis 2003).
The first row of Table 3 shows the total effect of first-time paternal incarceration occurring between years one and five on special education placement at year nine. Paternal incarceration has a statistically significant positive relationship for boys’ likelihood of receiving special education services by age nine. Secondly, school readiness measured four years prior mediates nearly one-fifth of the total effect, even after accounting for relevant controls; therefore, these analyses demonstrate not only the importance of school readiness for these young boys, but also the importance of paternal incarceration and its effects on special education assignment, mediated through school readiness. Thus, paternal incarceration’s deleterious impact on school readiness at year five accounts for a meaningful portion, though not a majority, of the negative impact it presents for year nine educational outcomes of affected boys.
Table 3.
Results from Non-cognitive School Readiness Mediation Models for Special Education Placement at Year 9
| Special Education Services | |
|---|---|
| Total Effect | .08* |
| (0.03) | |
|
| |
| Direct Effect of Paternal Incarceration | 0.07* |
| (0.03) | |
|
| |
| Indirect Effect mediated through Non-cognitive | 0.01* |
| Readiness | (0.01) |
|
| |
| confidence interval | [0.001, 0.031] |
|
| |
| Proportion of Total Effect Mediated | 0.18 |
|
| |
| N | 827 |
Note: Analyses are unweighted and done on imputed data. All PSM controls (see Table 2) are included in model. Bootstrapped standard errors in parentheses. Significance levels are the following: † p<0.1; * p<.05; ** p<.01; *** p<.001 (two-sided). In order to maintain correct temporal ordering, boys who experienced first-time paternal incarceration between Year 5 and Year 9 were excluded (N=73); an additional 44 boys were lost due to missing data on the Year 9 outcome.
DISCUSSION
This study contributes to a growing body of literature on the implications of mass incarceration for inequality among U.S. children. It demonstrates the direct consequences of paternal incarceration for children’s educational preparedness and underscores the importance of this early schooling outcome for later educational decisions. Moreover, it enhances our understanding of both the persistence of racial and gendered disparities in educational outcomes and the intergenerational transmission of inequality. Using multiple estimation strategies and attending to selection concerns, I found that paternal incarceration negatively affects boys’ non-cognitive school readiness and that these effects have lingering impacts on later special education placement. These findings are in line with recent work using similar data and methods (Wildeman 2010; Wakefield and Wildeman 2011; Geller et al. 2012) and present an important extension by providing evidence that the negative effect of paternal incarceration on non-cognitive school readiness is one pathway through which mass incarceration creates educational disadvantages in the next generation.
White and black boys with incarcerated fathers possessed lower levels of the non-cognitive skills necessary for successful entry into formal schooling. In the PSM models, the magnitude of the effect was large for both groups—0.4 standard deviations for white boys and 0.2 for black boys, representing a two- to four-month loss of schooling. To benchmark the relevance of this gendered effect, paternal incarceration explains two-thirds of the white gender gap and all of the black gender gap in non-cognitive school readiness. In the absence of heterogeneous effects of paternal incarceration by gender, these boys would be similarly behaviorally ready to their female counterparts at school entry and potentially less likely to be later placed in special education. Moreover, together with the fact that black children are disproportionally exposed to paternal incarceration, these findings have important implications for racial educational inequality as the rise in incarceration and the excessive incarceration of African American males threatens to shatter what educational scholars have called the “virtuous cycle” (Gamoran 2001) in which present generations of black children benefit from previous generations’ efforts to narrow gaps in achievement and attainment.
These findings have three major implications for sociologists interested in the intersection of incarceration, race, gender, and educational inequalities. First, they add to a growing body of literature that shows young boys appear to be more sensitive to disruptions and instability in family structure than girls across a range of educational outcomes (Cooper et al. 2011; DiPrete and Buchmann 2013). Second, they may help explain the persistence of the black male disadvantage in educational outcomes, as black men continue to lag behind white men and white and black women in high school and college completion rates (McDaniel et al. 2011). Third, as DiPrete and Jennings (2012) have recently shown, gender differences in non-cognitive skills present in early schooling grow throughout elementary school, impacting cognitive test scores and explaining a large portion of the gender gap in later academic outcomes. Socio-behavioral skills are central to children’s later educational success (Duckworth and Seligman 2005), and DiPrete and Jennings (2012) call for studies to think about family-level processes that produce gender gaps in these non-cognitive skills. This study presents evidence of a father’s incarceration as a family-level process able to produce such differences.
Limitations and Future Directions
While informative, the results I present also raise additional questions and highlight areas where future work is sorely needed. Specifically, I call for additional work on mechanisms, which I did not fully test for in these analyses. It is also worth having a discussion with regard to the null-effect found for cognitive readiness. The development of cognitive and non-cognitive skills is interrelated, and while the treatment effects found for cognitive readiness did not reach significance, they were in general negatively associated with paternal incarceration, and of similar magnitude to the effects found for non-cognitive readiness. Therefore, I hesitate to conclude that paternal incarceration has no impact on cognitive skills, and I encourage future work along these lines.
The use of a parent-reported composite measure of non-cognitive readiness also has potential limitations. A focus on the fine-grained distinctions between various non-cognitive skills, as done by Geller et al. (2012), has highlighted some differences between types of child behaviors and a father’s incarceration. In exploratory factor analyses, the 17 components used in the creation of my non-cognitive readiness measure aligned well with sub-scales for internalizing, externalizing, and attention behaviors.11 Supplementary analyses indicated that the components driving the negative effect of paternal incarceration on non-cognitive readiness were mainly from the externalizing and attention behaviors sub-scales, similar to what has been found by Wildeman (2010) and Geller et al. (2012). Maternal reports of behaviors characteristic of internalizing problems like depression, anxiety, or withdrawal seemed less affected by paternal incarceration for pre-school aged children. However, this could be due to inaccuracy in maternal reports, as internalizing behaviors are harder to identify in young children. Some work comparing agreement of child self-reports and parent reports finds that parents especially underreport internalizing behaviors (Sourander, Helstela, and Helenius 1999). Future work that can bring child self-reports of non-cognitive skills or even reports from another involved adult into the picture would greatly add to our knowledge of the effects of paternal incarceration on important components of children’s educational development.
Future studies could also work to uncover if there is indeed a stronger relationship between paternal incarceration and non-cognitive readiness for white boys. While this study was unable to make any conclusions on this matter, I can offer a few different interpretations that future studies could explore. Given that incarceration is more proportionally prevalent for black children, and therefore more visible in minority communities, this could suggest that black families and communities are more resilient, supportive, or for other reasons less sensitive to the effects of paternal incarceration than the white children and families represented in the FFS data. Moreover, since the criminal justice system comes into contact with a broader swath of the black community than the white, another interpretation could be that the white incarcerated fathers in the FFS are in some way selectively “worse” (e.g., committed a more severe crime or spent more time incarcerated) than the black fathers, thus possibly affecting their sons more severely. A third reason could be that white families tend to be more nuclear than black families, which can often rely on extended kin networks (Dunifon and Kowaleski-Jones 2002); thus for white children the loss of a father to incarceration leaves a larger hole that in a black family could be filled by other familial sources of support. A final interpretation might be that for blacks—given residential segregation, spatial inequality in punishment, and the local concentration of incarceration in predominantly black neighborhoods (Sobel 2006; Sampson and Loeffler 2010)—paternal incarceration is a community-level as well as an individual-level phenomenon, affecting the educational trajectories of children with and without incarcerated fathers at a more aggregate level. If this is the case, spillover effects of incarceration would produce dampened estimates of the effect of paternal incarceration on black children (but not white) when compared to same-race “control” counterparts, as the control group would be indirectly exposed to the treatment.
Conclusion
School readiness represents a developmental outcome necessary for successful entry into formal schooling. Because early cognitive and non-cognitive abilities are central to children’s educational success, differences in school readiness affect children’s future academic and labor market trajectories. Moreover, in the first few years of school, key educational decisions such as placement in special education and ability groups are made, and this study found that a child’s behavior, attention, and social skills play an important role in those decisions. As a result, early problems with non-cognitive skills such as aggression, inattentiveness, disobedience, and hyperactivity can set children on a pathway of cumulative disadvantage (Raver 2002; McLeod and Kaiser 2004; Heckman, Stixrud, and Urzua 2006). This, coupled with evidence that effects of paternal incarceration at this young age are strongest for boys and are disproportionally experienced by black children, points to one potential pathway through which paternal incarceration facilitates the intergenerational transmission of disadvantage from father to son and plays a role in explaining the presence of racial and gendered differences in early schooling outcomes. In short, the incarceration of a father affects how ready children are for formal schooling, and the mass incarceration of fathers in this country is limiting the educational potential of their male children.
Acknowledgments
This research was supported by a National Science Foundation Graduate Research Fellowship, a Ford Foundation Dissertation Fellowship, the American Sociological Society’s Minority Fellowship Program, and by the Institute of Education Sciences, US Department of Education through grant R305C050055 to the University of Wisconsin-Madison. The author also thanks the Eunice Kennedy Shriver National Institute of Child Health and Human Development (NICHD) through grants R01HD36916, R01HD39135, and R01HD40421, as well as a consortium of private foundations for their support of the Fragile Families and Child Wellbeing Study. All errors are my own, and the contents of this paper do not necessarily reflect the official views of any funding agencies. This paper has benefited from numerous rounds of helpful comments--too many to fully acknowledge here. I graciously thank all those who provided feedback over the years, especially Paul Hanselman, Elizabeth Wrigley-Field and Jeffery Grigg.
Appendix A Response Rates for Fragile Families and Child Wellbeing Study
| Mothers
|
Fathers
|
|||||
|---|---|---|---|---|---|---|
| Overall | Married | Unmarried | Overall | Married | Unmarried | |
| Baseline | 86% | 82% | 87% | 79% | 89% | 77% |
| Year 1 | 91% | 91% | 91% | 74% | 83% | 71% |
| Year 3 | 88% | 90% | 88% | 72% | 83% | 68% |
| Year 5 | 87% | 88% | 87% | 70% | 79% | 67% |
| Year 9 | 76% | 59% | ||||
Source: Fragile Families and Child Wellbeing Study (Bendheim-Thoman Center for Research on Child Wellbeing 2008).
Appendix B Weighted Means and Standard Deviations (when appropriate) for Dependent and Independent Variables by Paternal Incarceration Status
|
|
||||||||
|---|---|---|---|---|---|---|---|---|
| Father Never Incarcerated | Father Incarcerated
|
|||||||
| Before or by YR1 | Btw YR1 & YR5 | in OLS | in PSM | |||||
|
| ||||||||
| Variable Names (range) | Mean | SD | Mean | SD | Mean | SD | ||
| Outcome Variables | ||||||||
| Non-cognitive Readiness (0–2) | 1.64 | (0.28) | 1.54 | (0.30) | 1.54 | (0.34) | ||
| Standardized | 0.20 | (0.93) | −0.12 | (0.99) | −0.13 | (1.12) | ||
| Cognitive Readiness (40–160) | 101.85 | (15.27) | 92.40 | (15.55) | 88.42 | (15.06) | ||
| Standardized | 0.54 | (0.92) | −0.03 | (0.94) | −0.27 | (0.91) | ||
|
| ||||||||
| Special Education Placement at Year 9 | .15 | .16 | .19 | |||||
|
| ||||||||
| Demographic and Household Characteristics | ||||||||
| child race Black | 0.36 | 0.75 | 0.79 | x | x | |||
| child race White | 0.64 | 0.25 | 0.21 | x | x | |||
| child gender Male | 0.55 | 0.53 | 0.55 | x | x | |||
| Low Birth Weight | 0.06 | 0.12 | 0.08 | x | ||||
| Maternal Cognitive (0–15) | 7.78 | (2.58) | 6.69 | (2.37) | 6.82 | (2.10) | x | |
| Maternal Age at 1st Birth (13–45) | 25.18 | (5.87) | 20.00 | (4.57) | 19.75 | (3.80) | x | |
| Mother Cohabiting with Father | 0.15 | 0.32 | 0.31 | x | x | |||
| Mother Married to Father | 0.69 | 0.20 | 0.19 | x | x | |||
| Grandparent in HH | 0.13 | 0.36 | 0.32 | x | ||||
| Number of Children in HH | 1.04 | (1.16) | 1.48 | (1.41) | 1.38 | (1.35) | x | |
| Economic Indicators | ||||||||
| Poverty Status (1–5) | 1.91 | (1.25) | 3.35 | (1.29) | 3.32 | (1.29) | x | x |
| Maternal Education (1–4) | 2.83 | (1.07) | 1.89 | (0.84) | 1.89 | (0.79) | x | |
| Living in Public Housing | 0.04 | 0.14 | 0.18 | x | ||||
| Neighborhood Unsafe | 0.08 | 0.18 | 0.17 | x | x | |||
| Census Tract Characteristics | ||||||||
| % of population White | 0.55 | (0.35) | 0.33 | (0.34) | 0.33 | (0.33) | x | x |
| % of population Black | 0.31 | (0.34) | 0.54 | (0.37) | 0.54 | (0.37) | x | x |
| % of female pop. of childbearing age | 0.52 | (0.07) | 0.51 | (0.06) | 0.51 | (0.06) | x | x |
| % of HHs female-headed w/children <18 | 0.16 | (0.13) | 0.26 | (0.16) | 0.26 | (0.15) | x | x |
| mean # of persons per HH | 2.62 | (0.50) | 2.69 | (0.43) | 2.64 | (0.44) | x | x |
| % of 25+ population with HS+ education | 0.80 | (0.14) | 0.70 | (0.13) | 0.73 | (0.12) | x | x |
| % of 25+ population with BA+ education | 0.25 | (0.18) | 0.14 | (0.11) | 0.15 | (0.14) | x | x |
| % of civilian labor force unemployed | 0.08 | (0.07) | 0.12 | (0.08) | 0.12 | (0.09) | x | x |
| % of housing units vacant | 0.07 | (0.05) | 0.09 | (0.07) | 0.09 | (0.07) | x | x |
| % of occupied housing units renter-occ | 0.44 | (0.25) | 0.52 | (0.22) | 0.54 | (0.23) | x | x |
| median housing value in dollars in 1999 | 133593 | (122773) | 82854 | (55793) | 91154 | (85873) | x | x |
| % of HH on public assistance | 0.05 | (0.07) | 0.09 | (0.08) | 0.09 | (0.08) | x | x |
| % of families below poverty level in 1999 | 0.12 | (0.13) | 0.22 | (0.16) | 0.21 | (0.15) | x | x |
| % of families w/1999 income <$10K | 0.08 | (0.09) | 0.15 | (0.12) | 0.15 | (0.12) | x | x |
| % of families w/1999 income $10–14,999 | 0.05 | (0.04) | 0.07 | (0.04) | 0.07 | (0.04) | x | x |
| % of families w/1999 income $15–24,999 | 0.11 | (0.06) | 0.15 | (0.06) | 0.16 | (0.05) | x | x |
| % of families w/1999 income $25–34,999 | 0.12 | (0.05) | 0.14 | (0.05) | 0.14 | (0.04) | x | x |
| % of families w/1999 income $35–49,999 | 0.16 | (0.06) | 0.17 | (0.05) | 0.16 | (0.05) | x | x |
| % of families w/1999 income $50–74,999 | 0.21 | (0.08) | 0.17 | (0.08) | 0.17 | (0.07) | x | x |
| % of families w/1999 income $75–99,999 | 0.12 | (0.06) | 0.08 | (0.05) | 0.08 | (0.05) | x | x |
| % of families w/1999 income $100–149,999 | 0.09 | (0.07) | 0.05 | (0.04) | 0.05 | (0.05) | x | x |
| Interview City (20 indicator variables) | x | x | ||||||
| Paternal Demographic, Psycho-Social, and Delinquent Behavior Characteristics | ||||||||
| Paternal Age (15–53) | 30.93 | (6.83) | 26.46 | (6.76) | 27.62 | (8.06) | x | |
| Father Employed | 0.94 | 0.74 | 0.77 | x | ||||
| Father U.S. Citizen | 0.90 | 0.98 | 0.88 | x | ||||
| Paternal Cognitive (0–15) | 7.41 | (2.58) | 6.55 | (2.45) | 5.72 | (2.63) | x | x |
| Paternal Education (1–4) | 2.94 | (0.93) | 1.89 | (0.76) | 1.91 | (0.79) | x | x |
| Paternal Self-Control (6–24) | 18.68 | (3.63) | 16.62 | (4.50) | 17.31 | (4.12) | x | x |
| Paternal Drug and Alcohol Problems | 0.06 | 0.21 | 0.16 | x | x | |||
| Paternal Domestic Violence | 0.02 | 0.07 | 0.07 | x | x | |||
| Father Incarcerated at Child’s Birth | 0.0 | 0.11 | 0.0 | x | ||||
| Father had Two Bio-Parents in HH at 15 | 0.60 | 0.31 | 0.46 | x | ||||
| Father’s Bio Father Involved | 0.76 | 0.59 | 0.55 | x | ||||
| Father Lives in Public Housing | 0.04 | 0.11 | 0.12 | x | ||||
|
| ||||||||
| Paternal Multi-partner Fertility at YR1 | 0.20 | 0.49 | 0.46 | x | ||||
| Maternal Parenting Stress at YR1 (0–12) | 4.55 | (2.59) | 4.97 | (2.66) | 4.70 | (2.52) | x | |
| Paternal Anxiety at YR1 | 0.03 | 0.06 | 0.04 | x | ||||
| Paternal Depression at YR1 | 0.09 | 0.19 | 0.05 | x | ||||
| Paternal Contact with Child at YR1 (0–30) | 18.50 | (14.18) | 12.64 | (13.89) | 15.39 | (13.79) | x | |
|
| ||||||||
| Non-cognitive Readiness: N=2602 | n=1452 | n=822 | n=328 | |||||
| Cognitive Readiness: N=1709 | n=880 | n=590 | n=239 | |||||
|
|
||||||||
Note: National weights are used; descriptive means provided include black and white children only using the non-cognitive readiness sample; YR1 and YR5 stand for Year 1 and Year 5 respectively. All variables above double line are measured at baseline or are assumed fixed characteristics. Variables below the double line are measured at YR1.12
Appendix C Scaled Variables, Components, and Respective Cronbach’s Alphas
| Scale Name (alpha) | Components |
|---|---|
| Non-cognitive Readiness (.835) | can’t concentrate, can’t pay attention can’t sit still, is restless or hyperactive clings to adults or is too dependent cries a lot is disobedient doesn’t get along with other children doesn’t seem to feel guilty after misbehaving has trouble getting to sleep nervous, high strung, or tense is stubborn, sullen, or irritable has sudden changes in mood or feelings has temper tantrums or a hot temper is too fearful or anxious is unhappy, sad, depressed wants a lot of attention is withdrawn, doesn’t get involved acts too young for their age |
| Paternal Self-Control (.842)13 | often say whatever comes into head w/o thinking don’t think enough before I act often say/do things w/o considering consequences often get into trouble b/c I don’t think before I act my plans fail b/c I fail to think them through first often make up mind w/o considering the situation |
| Maternal Parenting Stress (.614) | being a parent is harder than I thought feel trapped by my parental responsibilities taking care of children is more work than pleasure often feel tired and worn out by raising a family |
Paternal self-control is a measure based on father reports collected at wave 2 (child aged one). This variable is constructed from reports of whether fathers (1) strongly agreed, (2) agreed, (3) disagreed, or (4) strongly disagreed with six questions asking about their impulsive behaviors. It is based on the Dickman impulsivity scale.
Appendix D Examples of Survey Questions (across waves) Used for Paternal Incarceration Composite Variable
Indirect Reports of Paternal Incarceration*
On Father Surveys
Why weren’t you looking for work?
Why did your romantic relationship with [baby’s mother] end?
What are the reasons you and [baby’s mother] are not living together (or married) now?
What are the reasons you and [baby’s mother] are not planning to get married?
Thinking about (the last/that) separation, why were you and (child) separated?
What is your current housing situation?
On Mother Surveys
What was [baby’s father] doing most of last week—working at a regular job, going to school, or something else?
Why did your romantic relationship with [baby’s father] end?
What are the reasons you and [baby’s father] are not living together (or married) now?
What are the reasons you and [baby’s father] are not planning to get married?
Where does [baby’s father] live most of the time? Is [baby’s father] currently working, in school, unemployed, or in jail or prison?
Has any action been taken by a welfare office, court, or judge to try to get [baby’s father] to pay the child support he owes?
Direct reports of Paternal Incarceration*
On Father Surveys
Have you ever spent time in a correctional institution, like a county jail, a state or federal prison, or a youth correctional institution like a training school or reform school?
Did you spend any time in an adult correctional institution like a county, state, or federal jail or prison?
On Mother Surveys
Has [baby’s father] (ever) spent any time in jail or prison?
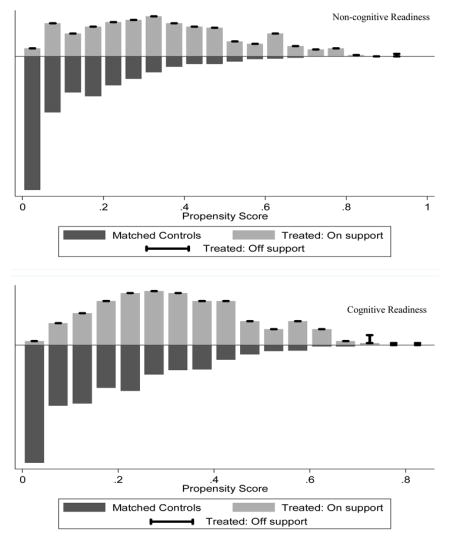
Appendix E Figures showing the Distribution of Propensity Scores by Treatment and Region of Common Support for Non-cognitive and Cognitive Readiness
Appendix F Covariate Balance Statistics for PSM Analyses
| Mean Bias Before and After Matching
| |||||
|---|---|---|---|---|---|
| Sample | Overall | Black Boys | Black Girls | White Boys | White Girls |
| Before (raw) | 25.2 | 14.7 | 18.5 | 35.5 | 34.0 |
| After (matched) % | 4.4 | 4.3 | 3.7 | 9.5 | 11.7 |
| Reduction in Bias | 82% | 70% | 81% | 73% | 65% |
Notes: Covariate balance tests were done using the PSTEST command in Stata. See Footnote 6 for more information.
Appendix G Results from OLS Regression Models Predicting School Readiness at Age Five
| Non-cognitive Readiness | ||||
|---|---|---|---|---|
| Model 0 | Model 1 | Model 2 | Model 3 | |
|
| ||||
| Variable Names | Null | Full | Race*PI | Gender*PI |
| Paternal Incarceration | ||||
| Before/By YR1 | −0.325*** (0.04) | −0.168** (0.05) | −0.284* (0.10) | −0.143* (0.07) |
| Btw YR1 & YR5 | −0.205*** (0.06) | −0.084 (0.07) | −0.142 (0.14) | 0.081 (0.09) |
| Black*PI Before/By YR1 | 0.146 (0.11) | |||
| Black*PI Btw YR1 & YR5 | 0.075 (0.16) | |||
| Male*PI Before/By YR1 | −0.047 (0.08) | |||
| Male*PI Btw YR1 & YR5 | −0.312* (0.12) | |||
|
| ||||
| Black (child) | −0.004 (0.04) | 0.086 (0.07) | 0.041 (0.07) | 0.087 (0.06) |
| Male (child) | −0.136*** (0.04) | −0.128** (0.04) | −0.128** (0.04) | −0.074 (0.05) |
| Constant | 0.266*** (0.04) | −0.91 (0.75) | −0.844 (0.75) | −0.929 (0.75) |
|
| ||||
| All OLS Controls Included | x | x | X | |
|
| ||||
| N=2602 | N=2602 | N=2602 | N=2602 | |
|
|
||||
| Cognitive Readiness | ||||
|---|---|---|---|---|
| Variable Names | Model 0 | Model 1 | Model 2 | Model 3 |
|
| ||||
| Null | Full | Race*PI | Gender*PI | |
| Paternal Incarceration | ||||
| Before/By YR1 | −0.204*** (0.05) | 0.001 (0.05) | 0.009 (0.11) | 0.039 (0.07) |
| Btw YR1 & YR5 | −0.231*** (0.07) | −0.051 (0.06) | −0.168 (0.15) | −0.1 (0.09) |
| Black*PI Before/By YR1 | −0.01 (0.12) | |||
| Black*PI Btw YR1 & YR5 | 0.14 (0.16) | |||
| Male*PI Before/By YR1 | −0.075 (0.09) | |||
| Male*PI Btw YR1 & YR5 | 0.091 (0.13) | |||
|
| ||||
| Black (child) | −0.736*** (0.05) | −0.375*** (0.07) | −0.389*** (0.09) | −0.373*** (0.07) |
| Male (child) | −0.208*** (0.04) | −0.202*** (0.04) | −0.202*** (0.04) | −0.188** (0.06) |
| Constant | 0.868*** (0.05) | −0.567 (0.93) | −0.57 (0.93) | −0.593 (0.93) |
|
| ||||
| All OLS Controls Included | X | x | x | |
|
| ||||
| N=1709 | N=1709 | N=1709 | N=1709 | |
|
|
||||
Note: Standardized results are reported with standard errors in parentheses. Analyses are unweighted and done on imputed data. Coefficients for included covariates not shown. Significance levels are the following: † p<0.1; * p<.05; ** p<.01; *** p<.001 (two-sided tests).
Appendix H Rosenbaum Bounds Sensitivity Analysis Results
| Rosenbaum Bounds for Paternal Incarceration Treatment Effect on Non-cognitive School Readiness | |||||
|---|---|---|---|---|---|
|
| |||||
| Overall | Black Boys | White Boys | |||
|
| |||||
| Gamma | p-critical | Gamma | p-critical | Gamma | p-critical |
|
|
|
|
|||
| 1 | 0.019 | 1 | 0.016 | 1 | 0.013 |
| 1.05 | 0.042 | 1.05 | 0.027 | 1.05 | 0.017 |
| 1.1 | 0.087 | 1.1 | 0.047 | 1.1 | 0.023 |
| 1.15 | 1.15 | 0.076 | 1.15 | 0.049 | |
| 1.2 | 1.2 | 1.2 | 0.060 | ||
Notes: Results are based on sensitivity analysis done in Stata using the rbounds software package (DiPrete and Gangl 2004). P-values exceeding 0.10 have been omitted to demonstrate the point where the relationship becomes statistically insignificant.
Appendix I Means, Standard Deviations, and Factor Loadings for Individual Items of Non-cognitive Readiness Scale by Paternal Incarceration Status
|
|
|||||||||
|---|---|---|---|---|---|---|---|---|---|
| Father Never Incarcerated | Father Incarcerated
|
Factor Loadings | |||||||
| Before or by YR1 | Btw YR1 & YR5 | ||||||||
|
|
|||||||||
| Mean | SD | Mean | SD | Mean | SD | F1 | F2 | F3 | |
|
|
|
||||||||
| (He/She) acts too young for age | 0.12 | (0.39) | 0.12 | (0.40) | 0.14 | (0.43) | 0.339 | 0.526 | |
| (He/She) clings to adults or is too dependent | 0.45 | (0.66) | 0.63 | (0.74) | 0.56 | (0.73) | 0.525 | ||
| (He/She) is nervous, high strung, or tense | 0.13 | (0.39) | 0.19 | (0.47) | 0.18 | (0.46) | 0.421 | ||
| (He/She) is too fearful or anxious | 0.25 | (0.49) | 0.36 | (0.59) | 0.27 | (0.50) | 0.403 | ||
| (He/She) is unhappy, sad, depressed | 0.07 | (0.28) | 0.1 | (0.31) | 0.09 | (0.31) | −0.332 | 0.682 | |
| (He/She) is withdrawn; (he/she) doesn’t get involved with others | 0.09 | (0.34) | 0.12 | (0.37) | 0.11 | (0.33) | 0.760 | ||
| (He/She) is disobedient | 0.48 | (0.57) | 0.55 | (0.63) | 0.5 | (0.63) | 0.558 | ||
| (He/She) doesn’t seem to feel guilty after misbehaving | 0.38 | (0.59) | 0.48 | (0.66) | 0.47 | (0.65) | 0.310 | ||
| (He/She) is stubborn, sullen, or irritable | 0.56 | (0.63) | 0.66 | (0.68) | 0.56 | (0.66) | 0.751 | ||
| (He/She) has temper tantrums or hot temper | 0.5 | (0.62) | 0.61 | (0.68) | 0.59 | (0.69) | 0.800 | ||
| (He/She) cries a lot | 0.31 | (0.58) | 0.43 | (0.67) | 0.41 | (0.64) | 0.322 | ||
| (He/She) doesn’t get along with other children | 0.16 | (0.41) | 0.22 | (0.48) | 0.17 | (0.42) | 0.432 | ||
| (He/She) has trouble getting to sleep | 0.28 | (0.54) | 0.33 | (0.60) | 0.3 | (0.58) | 0.298 | ||
| (He/She) has sudden changes in mood or feelings | 0.42 | (0.58) | 0.57 | (0.64) | 0.54 | (0.63) | 0.620 | ||
| (He/She) can’t concentrate, can’t pay attention for long | 0.43 | (0.61) | 0.53 | (0.65) | 0.48 | (0.62) | 0.795 | ||
| (He/She) can’t sit still; (he/she) is restless or hyperactive | 0.5 | (0.68) | 0.71 | (0.77) | 0.68 | (0.73) | 0.794 | ||
| (He/She) wants a lot of attention | 0.98 | (0.74) | 1.13 | (0.74) | 1.16 | (0.72) | 0.360 | 0.383 | |
Note: Factor 1 aligns with externalizing behaviors, Factor 2 with attention-related skills, and Factor 3 with internalizing behaviors. The scale ranges from 0 to 2, with 0=not true, 1=somewhat true, and 2=very true.
Footnotes
Children of mothers with an incarceration history are excluded in order to isolate the effect of paternal incarceration. Earlier analyses were run using a sample that included Latinos, but for the purposes of clarity and parsimony they have currently been excluded.
See Appendix C of the supplementary materials for the list of questions that comprise this scaled measure.
I use the constructed paternal incarceration measures provided by the FFS. These indicators combine both direct and indirect reports of fathers’ incarceration status at each of the four waves. See Appendix D of the supplementary materials for a sample of these survey questions. Unfortunately, the FFS paternal incarceration data does not offer any information on duration or frequency of incarceration, nor can it distinguish between stays in prison as opposed to jail or levels of severity in the crime committed.
Technically, the incarceration status of some fathers (n=182) was known at baseline, but this is only if mothers (or fathers) answered that the father was in jail or prison at the time of the child’s birth/baseline interview. No direct question was asked of either parent at baseline about past or current episodes of paternal incarceration.
This is done in order to avoid introducing “post-treatment bias” (Ho, Imai, King and Stuart 2007) by ensuring that only pre-treatment variables are used in the matching procedure.
Analyses were restricted to observations within the region of common support. I tested that the PSM technique achieved covariate balance using the ‘pstest’ command in Stata. Results for the distribution of support and a reporting of covariate balance statistics are available in Appendices E and F of the supplementary materials.
Nearest neighbor and radius matching were also performed and results were similar.
A small number of children (61 black boys and 12 white boys) fall into this subgroup experiencing first-time paternal incarceration between year five and year nine.
See Appendix H of the supplementary materials for these results.
I run bootstrapped Sobel-Goodman mediation tests using the ‘sgmediation’ program in Stata 12 in order to replicate within Stata the more appropriate Preacher and Hayes (2004) bootstrapping method of mediation analysis (http://ederosia.byu.edu/blog/Eric_DeRosia/using-stata-to-perform-the-preacher-and-hayes-1994-bootstrapped-test-of-mediation/).
See Appendix I of the supplementary materials for these results.
Cognitive ability, measured at wave 3 using the Wechsler Adult Intelligence Test, is treated as a fixed trait of parents. Based on the Dickman impulsivity scale, paternal self-control is reverse-scaled and consists of father reports of impulsive behaviors collected at wave 2; it is also assumed a fixed trait. Paternal domestic violence is based on mother’s reports of if the focal child’s father hit, slapped, or seriously hurt her at any point up to wave 2. Baseline paternal drug and alcohol abuse is indicated by combined mother and father reports of whether drinking or drugs have ever interfered with father’s work or relationships, or if father ever sought help for a drug or alcohol problem. Maternal and paternal education categories are the following: 1=less than high school, 2=high school or equivalent, 3=some college, technical school, and 4=college or graduate degree. Poverty categories range from low (1) to high (5) and are measured as the percentage of income that is above the poverty line.
For each of the questions, “in jail,” “incarceration,” or “sent to jail” was one of a number of responses (depending on the question) fathers/mothers could have indicated.
These questions were first asked on the second wave of data collection, when the child was approximately one year old.
References
- Achenbach Thomas M, Rescorla Leslie A. Manual for the ASEBA Preschool Forms and Profiles. Burlington, VT: University of Vermont, Research Center for Children, Youth, and Families; 2000. [Google Scholar]
- Augurzky Boris, Schmidt Christoph M. IZA Discussion Paper 271. Institute for the Study of Labor (IZA); 2001. The Propensity Score: A Means to an End. [Google Scholar]
- Bendheim-Thoman Center for Research on Child Wellbeing. Introduction to the Fragile Families Public-Use Data: Baseline, One-Year, Three-Year, and Five-Year Telephone Data. Princeton, NJ: Office of Population Research, Princeton University; 2008. [Google Scholar]
- Blair Clancy. School Readiness: Integrating Cognition and Emotion in a Neurobiological conceptualization of Children’s Functioning at School Entry. American Psychologist. 2002;57:111–127. doi: 10.1037//0003-066x.57.2.111. [DOI] [PubMed] [Google Scholar]
- Braman Donald. Doing Time on the Outside: Incarceration and Family Life in Urban America. Ann Arbor, MI: University of Michigan Press; 2004. [Google Scholar]
- Buchmann Claudia, DiPrete Thomas A, McDaniel Anne. Gender Inequalities in Education. Annual Review of Sociology. 2008;34:319–337. [Google Scholar]
- Clear Todd R. Imprisoning Communities. New York: Oxford University Press; 2007. [Google Scholar]
- Comfort Megan. Doing Time Together: Love and Family in the Shadow of the Prison. Chicago: University of Chicago Press; 2008. [Google Scholar]
- Cooper Carey E, Osborne Cynthia A, Beck Audrey N, McLanahan Sara S. Partnership Instability, School Readiness, and Gender Disparities. Sociology of Education. 2011;84:246–259. doi: 10.1177/0038040711402361. [DOI] [PMC free article] [PubMed] [Google Scholar]
- Craigie Terry-Ann L. The Effect of Paternal Incarceration on Early Child Behavioral Problems: A Racial Comparison. Journal of Ethnicity in Criminal Justice. 2011;9:179–99. [Google Scholar]
- Davis James E. Early Schooling and Academic Achievement of African American Males. Urban Education. 2003;38:515–537. [Google Scholar]
- DiPrete Thomas A, Buchmann Claudia. The Rise of Women: The Growing Gender Gap in Education and What It Means for American Schools. New York: Russell Sage Foundation; 2013. [Google Scholar]
- DiPrete Thomas A, Gangl Markus. Assessing Bias in the Estimation of Causal Effects: Rosenbaum Bounds on Matching Estimators and Instrumental Variables Estimation with Imperfect Instruments. Sociological Methodology. 2004;34:271–310. [Google Scholar]
- DiPrete Thomas A, Jennings Jennifer L. Social and Behavioral Skills and the Gender Gap in Early Educational Achievement. Social Science Research. 2012;41:1–15. doi: 10.1016/j.ssresearch.2011.09.001. [DOI] [PubMed] [Google Scholar]
- Dowd James J, Bengtson Vern L. Aging in Minority Populations: An Examination of the Double Jeopardy Hypothesis. Journal of Gerontology. 1978;33:427–36. doi: 10.1093/geronj/33.3.427. [DOI] [PubMed] [Google Scholar]
- Duckworth Angela L, Seligman Martin EP. Self-Discipline Outdoes IQ in Predicting Academic Performance of Adolescents. Psychological Science. 2005;16:939–944. doi: 10.1111/j.1467-9280.2005.01641.x. [DOI] [PubMed] [Google Scholar]
- Duncan Greg J, Claessens Amy, Huston Aletha C, Pagani Linda, Engel Mimi, Sexton Holly, Dowsett Chantelle J, Magnuson Katherine, Klebanov Pamela, Feinstein Leon, Brooks-Gunn Jeanne, Duckworth Katherine. School Readiness and Later Achievement. Developmental Psychology. 2007;43:1428–1446. doi: 10.1037/0012-1649.43.6.1428. [DOI] [PubMed] [Google Scholar]
- Dunifon Rachel, Kowaleski-Jones Lori. Who’s in the House? Race Differences in Cohabitation, Single Parenthood, and Child Development. Child Development. 2002;73:1249–1264. doi: 10.1111/1467-8624.00470. [DOI] [PubMed] [Google Scholar]
- Dunn Lloyd M, Dunn Leota M. Peabody Picture Vocabulary Test—Third Edition. Circle Pines, MN: American Guidance Service; 1997. [Google Scholar]
- Entwisle Doris R, Alexander Karl L, Olson Linda Steffel. Early Schooling: The Handicap of Being Poor and Male. Sociology of Education. 2007;80:114–138. [Google Scholar]
- Foster Holly, Hagan John. Incarceration and Intergenerational Social Exclusion. Social Problems. 2007;54:399–433. [Google Scholar]
- Foster Holly, Hagan John. The Mass Incarceration of Parents in America: Issues of Race/Ethnicity, Collateral Damage to Children, and Prisoner Reentry. Annals of the American Academy of Political and Social Science. 2009;623:179–194. [Google Scholar]
- Gamoran Adam. American Schooling and Educational Inequality: A Forecast for the 21st Century. Sociology of Education. 2001;74:135–153. [Google Scholar]
- Geller Amanda, Garfinkel Irwin, Cooper Carey E, Mincy Ronald. Parental Incarceration and Child Wellbeing: Implications for Urban Families. Social Science Quarterly. 2009;90:1186–1202. doi: 10.1111/j.1540-6237.2009.00653.x. [DOI] [PMC free article] [PubMed] [Google Scholar]
- Geller Amanda, Cooper Carey E, Garfinkel Irwin, Schwartz-Soicher Ofira, Mincy Ronald B. Beyond Absenteeism: Father Incarceration and Child Development. Demography. 2012;49:49–76. doi: 10.1007/s13524-011-0081-9. [DOI] [PMC free article] [PubMed] [Google Scholar]
- Glaze Lauren E, Maruschak Laura M. Bureau of Justice Statistics Special Report. Washington, DC: Bureau of Justice Statistics; 2008. Parents in Prison and Their Minor Children. [Google Scholar]
- Goffman Erving. Stigma: Notes on the Management of Spoiled Identity. Englewood Cliffs, NJ: Prentice-Hall; 1963. [Google Scholar]
- Hagan John, Dinovitzer Ronit. Collateral Consequences of Imprisonment for Children, Communities, and Prisoners. In: Tonry M, Petersilia J, editors. Prisons. Chicago: University of Chicago Press; 1999. pp. 121–162. [Google Scholar]
- Hagan John, Foster Holly. Intergenerational Educational Effects of Mass Imprisonment in America. Sociology of Education. 2012;85:259–286. [Google Scholar]
- Haskins Anna R. Fragile Families Working Paper Series, No. WP13–15FF. Center for Research on Child Wellbeing: Princeton University; 2013. Mass Imprisonment and the Intergenerational Transmission of Disadvantage: Paternal Incarceration and Children’s Cognitive Skill Development. [Google Scholar]
- Heckman James J, Stixrud Jora, Urzua Sergio. The Effects of Cognitive and Noncognitive Abilities on Labor Market Outcomes and Social Behavior. Journal of Labor Economics. 2006;24:411–482. [Google Scholar]
- Hernandez Donald, Brandon Peter. Who Are the Fathers of Today? In: Tamis-Lemonda C, Cabrera N, editors. Handbook of Father Involvement: Multidisciplinary Perspectives. New Jersey: Erlbaum; 2002. pp. 33–62. [Google Scholar]
- Hibel Jacob, Farkas George, Morgan Paul L. Who is Placed into Special Education? Sociology of Education. 2010;83:312–332. doi: 10.1177/0038040710383518. [DOI] [PMC free article] [PubMed] [Google Scholar]
- Ho Daniel E, Imai Kosuke, King Gary, Stuart Elizabeth. Matching as Nonparametric Preprocessing for Reducing Model Dependence in Parametric Causal Inference. Political Analysis. 2007;15:199–236. [Google Scholar]
- Jencks Christopher, Phillips Meredith. The Black-White Test Score Gap. Washington, DC: The Brookings Institute Press; 1998. [Google Scholar]
- Knudsen Eric I, Heckman James J, Cameron Judy L, Shonkoff Jack P. Economic, Neurobiological, and Behavioral Perspectives on Building America’s Future Workforce. Proceedings of the National Academy of Sciences. 2006;103:10155–10162. doi: 10.1073/pnas.0600888103. [DOI] [PMC free article] [PubMed] [Google Scholar]
- Magnuson Katherine, Waldfogel Jane. Steady Gains and Stalled Progress: Inequality and the Black-white Test Score Gap. New York: Russell Sage Foundation; 2008. [Google Scholar]
- McDaniel Anne, DiPrete Thomas A, Buchmann Claudia, Shwed Uri. The Black Gender Gap in Educational Attainment: Historical Trends and Racial Comparisons. Demography. 2011;48:889–914. doi: 10.1007/s13524-011-0037-0. [DOI] [PubMed] [Google Scholar]
- McLeod Jane D, Kaiser Karen. Childhood Emotional and Behavioral Problems and Educational Attainment. American Sociological Review. 2004;69:636–658. [Google Scholar]
- Mineka S, Kihlstrom J. Unpredictable and Uncontrollable Events: A New Perspective on Experimental Neurosis. Journal of Abnormal Psychology. 1978;87:256–271. doi: 10.1037//0021-843x.87.2.256. [DOI] [PubMed] [Google Scholar]
- Morgan Paul L, Frisco Michelle, Farkas George, Hibel Jacob. A Propensity Score Matching Analysis of the Effects of Special Education Services. Journal of Special Education. 2010;43:236–54. doi: 10.1177/0022466908323007. [DOI] [PMC free article] [PubMed] [Google Scholar]
- Mumola Christopher J. Incarcerated Parents and their Children. Washington, DC: Bureau of Justice Statistics; 2002. [Google Scholar]
- Murray Joseph, Farrington David. The Effects of Parental Imprisonment on Children. Crime and Justice. 2008;37:133–206. [Google Scholar]
- Murray Joseph, Loeber Rolf, Pardini Dustin. Parental Involvement in the Criminal Justice System and the Development of Youth Theft, Marijuana Use, Depression, and Poor Academic Performance. Criminology. 2012;50:255–302. [Google Scholar]
- Parke Ross D, Alison Clarke-Stewart K. The Effects of Parental Incarceration on Children: Perspectives, Promises, and Policies. In: Travis J, Waul M, editors. Prisoners Once Removed: The Impact of Incarceration and Re-entry on Children, Families, and Communities. Washington, DC: The Urban Press Institute; 2003. pp. 189–232. [Google Scholar]
- Preacher Kristopher J, Hayes Andrew F. SPSS and SAS Procedures for Estimating Indirect Effects in Simple Mediation Models. Behavior Research Methods, Instruments, & Computers. 2004;36:717–31. doi: 10.3758/bf03206553. [DOI] [PubMed] [Google Scholar]
- Raver C Cybele. Emotions Matter: Making the Case for the Role of Young Children’s Emotional Development for Early School Readiness. Social Policy Report. 2002;16:3–19. [Google Scholar]
- Reichman Nancy, Teitler Julian, Garfinkel Irwin, McLanahan Sara. Fragile Families: Sample and Design. Children and Youth Services Review. 2001;23:303–326. [Google Scholar]
- Rosenbaum Paul R. Observational Studies. 2. New York: Springer; 2002. [Google Scholar]
- Rosenbaum Paul R, Rubin Donald B. The Central Role of the Propensity Score in Observational Studies for Causal Effects. Biometrika. 1983;70:41–55. [Google Scholar]
- Rubin Donald B. Multiple Imputation for Non-Response in Surveys. New York: John Wiley and Sons; 1987. [Google Scholar]
- Sampson Robert J, Loeffler Charles. Punishment’s Place: The Local Concentration of Mass Incarceration. Daedalus. 2010;139:20–31. doi: 10.1162/daed_a_00020. [DOI] [PMC free article] [PubMed] [Google Scholar]
- Shifrer Dara, Callahan Rebecca, Muller Chandra. Equity or Marginalization? The High School Course-taking of Students Labeled with a Learning Disability. American Educational Research Journal. 2013;50:656–82. doi: 10.3102/0002831213479439. [DOI] [PMC free article] [PubMed] [Google Scholar]
- Sobel Michael E. Spatial Concentration and Social Stratification: Does the Clustering of Disadvantage Beget Bad Outcomes? In: Bowles S, Durlauf SN, Hoff K, editors. Poverty Traps. New York: Russell Sage Foundation; 2006. pp. 204–229. [Google Scholar]
- Sourander Andre, Helstela Leila, Helenius Hans. Parent-adolescent agreement on emotional and behavioral problems. Social Psychiatry and Psychiatric Epidemiology. 1999;34:657–663. doi: 10.1007/s001270050189. [DOI] [PubMed] [Google Scholar]
- Swisher Raymond, Waller Maureen. Confining Fatherhood: Incarceration and Paternal Involvement among Nonresident White, African American and Latino Fathers. Journal of Family Issues. 2008;29:1067–1088. [Google Scholar]
- Tenenbaum Harriet, Porche Michele, Snow Catherine, Tabors Patton, Ross Stephanie. Maternal and Child Predictors of Low-Income Children’s Educational Attainment. Journal of Applied Developmental Psychology. 2007;28:227–238. [Google Scholar]
- Wakefield Sara, Uggen Christopher. Incarceration and Stratification. Annual Review of Sociology. 2010;36:387–406. [Google Scholar]
- Wakefield Sara, Wildeman Christopher. Mass Imprisonment and Racial Disparities in Childhood Behavioral Problems. Criminology & Public Policy. 2011;10(3):793–817. [Google Scholar]
- Western Bruce, Beckett Katherine. How Unregulated is The US Labor Market? The Penal System as a Labor Market Institution. The American Journal of Sociology. 1999;104:1030–1060. [Google Scholar]
- Wildeman Christopher. Parental Imprisonment, the Prison Boom, and the Concentration of Childhood Disadvantage. Demography. 2009;46:265–280. doi: 10.1353/dem.0.0052. [DOI] [PMC free article] [PubMed] [Google Scholar]
- Wildeman Christopher. Parental Incarceration and Children’s Physically Aggressive Behaviors: Evidence from the Fragile Families and Child Wellbeing Study. Social Forces. 2010;89:285–310. [Google Scholar]
- Wildeman Christopher, Muller Christopher. Mass Imprisonment and Inequality in Health and Family Life. Annual Review of Law and Social Science. 2012;8:11–30. [Google Scholar]
- Zhang Dalun, Katsiyannis Antonis, Ju Song, Roberts Eric. Minority Representation in Special Education: 5-Year Trends. Journal of Child & Family Studies. 2014;23(1):118–27. [Google Scholar]